
ABSTRACT
In this paper, we set out the first step towards the measurement of learning gain in higher education by putting forward a conceptual framework for understanding learning gain that is relevant across disciplines. We then introduce the operationalisation of this conceptual framework into a new set of measurement tools. With the use of data from a large-scale survey of 11 English universities and over 4,500 students, we test the reliability and validity of the measurement instrument empirically. We find support in the data for the reliability of most of the measurement scales we put forward, as well as for the validity of the conceptual framework. Based on these results, we reflect on the conceptual framework and associated measurement tools in the context of at-scale deployment and the potential implications for policy and practice in higher education.
Introduction
Globally, higher education participation has steadily increased over the past two decades; in the US, over 52% of young people attend some form of college (OECD, Citation2017); in England, the context for our research, around 69% of young people participate in some form of tertiary education (OECD, Citation2017), and around 30% of all 18-year-olds in the system are enrolled in a higher education institution (Department for Education, Citation2017b). As has been documented elsewhere, university attendance results in myriad benefits for individuals, including increased employability (Knight & Yorke, Citation2003), employment (Blundell, Dearden, Goodman, & Reed, Citation2000) and earning gains (Britton, Dearden, Shephard, & Vignoles, Citation2016). There is recognition, however, that these economic benefits do not encompass the totality of learning in universities, and that in particular they do not necessarily capture learning gain.
The broader methodologically focused project from which this paper draws aims to understand the extent to which new, and existing measurement instruments, both self-report and test-like, may be used to capture non-subject specific learning gain in English universities. As the first step in that process, the present paper first reviews existing evidence on definitions, conceptualisations, and measurement of learning gain. It then introduces a new conceptual framework and an associated measurement instrument, developed intentionally to include a variety of measurement types and tools, before presenting an empirical test of this instrument, using data collected from English university students. The paper concludes with a discussion of the feasibility of large-scale measurement of learning gains in an accountability-rich higher education sector and proposes implications for policy makers.
Background to the problem
The broad interest in how, and what, students learn during their time in higher education has resulted in a variety of understandings, and measurement options, for learning gain. In England, the view that we need to measure learning in higher education mirrors efforts to measure learning at the school level, where attainment tests, school league tables, and associated metrics have served to provide information to students and their parents, and to inform the accountability system. In comparison, the accountability system for higher education is far less developed in England, but it is currently undergoing significant changes, with dramatic shifts in policy (e.g. the Higher Education and Research Bill, Department for Education, Citation2016a). Learning gain, a term taken generally to mean the overall gains in learning during higher education (but note discussion of precise definitions later) has made the transition into the research and policy parlance in the UK, despite a limited body of knowledge theoretically or empirically addressing it (McGrath, Guerin, Harte, Frearson, & Manville, Citation2015). There is therefore a pressing need for theoretical and empirical evidence on this issue, not least because the limited existing evidence on learning gain is primarily from the US and may therefore not be directly applicable to the English context.
This drives the main remit of our study, which is to explore the possibility of measuring learning gain, however defined, across a range of disciplines with an instrument that is short, easily understandable, and potentially amenable to at-scale distribution. It is with this aim in mind that we review the literature around learning gain, and then propose our theoretical framework and associated measurement instrument.
Literature review
The assessment of learning and student outcomes in education has a long history in England (Leckie & Goldstein, Citation2009, Citation2017). The English education system has relied heavily on measurement of student learning through exams (Goldstein & Leckie, Citation2016) and the usage of these data for accountability and policy-making purposes (Department for Education, Citation2016, Citation2017a; Goldstein, Citation2014). In relation to higher education, however, it is the US (Pascarella & Terenzini, Citation1991, Citation2005), Australia (e.g. Barrie, Citation2004) and to some extent other European countries (OECD, Citation2012a, Citation2012b, Citation2012c) that provide the widest body of evidence, and the accompanying policy analysis (e.g. Dill & Soo, Citation2005) and broader system-level implications (Brooks, Citation2012).
Definitions of learning gain
From the variety of empirical studies that make up the evidence around higher education learning outcomes and development, learning gain emerges as a concept with multiple definitions. Firstly, there is a definitional distinction in relation to whether learning gain is taken as subject-specific content knowledge, or, conversely, non-subject-specific knowledge that encompasses a wide range of skills, competencies and personal development attributes. In the US, the Wabash Study (Center for Inquiry at Wabash College, Citation2016) explored learning gain in a liberal arts context, measuring ‘the development of 12 outcomes associated with undergraduate liberal arts education’. Similarly, in England, learning gain is often defined as ‘the “distance travelled”, or the difference between the skills, competencies, content knowledge and personal development demonstrated at two points in time’ (McGrath et al., Citation2015, p. xi). This latter definition refers therefore to both subject-specific and subject-nonspecific domains. This raises important questions about which of these domains is of primary interest (or indeed, if they are equally important) for students, policymakers and higher education practitioners. It also raises questions about what exactly these skills, competencies and knowledge entail, and how they may be captured in a meaningful and useful manner.
Secondly, the manner in which the gain aspect is defined is also of relevance. The OECD (Citation2012a) put forward a definition that focuses on gain as simple change observed on a set of learning outcomes defined a priori. This approach is mirrored in a wide range of empirical studies on learning gain (e.g. Coates & Richardson, Citation2012; Liu, Citation2011), but is distinct from the value-added approach employed in both UK school research (Leckie & Goldstein, Citation2017; Liu, Citation2011), and some US-based studies (e.g. Rodgers, Citation2005, on UK lessons for the US; 2007), which explore the differences between students’ expected outcomes from higher education on the basis of their characteristics, and their actual attained outcomes. The latter is therefore a contextualised estimate of learning gain.
The OECD learning gain definition above can be seen to draw on earlier conceptualisations of learning gain in the English (Bennett, Dunne, & Carré, Citation1999; Dunne, Bennet, & Carré, Citation1997), Australian (Barrie, Citation2004, see discussion below), and US (Rodgers, Citation2007) contexts. For English higher education, Bennett et al. (Citation1999) set out a concept of learning gain from the perspective of the generic, or core skills that students may acquire in higher education. At the time, they pointed to the difficulty of defining core skills, but proposed a model that split them into management of self, and of task (composed largely of what we would call metacognitive aspects), management of information (mapping mostly onto cognitive abilities), and management of others (an interpersonal dimension). We expand and extend on their conceptual model in this paper, and return to the multidimensional nature of learning gain in a subsequent section.
A further issue with the variety of learning gain definitions, as well as with the range of skills, knowledge, attitudes and values for which this gain may occur, is lack of clear understanding by students of what these are, can, or should be. Jorre de St Jorre and Oliver (Citation2018) find that even when the language of capabilities (employed by some in the field) is abandoned for that of graduate learning outcomes, students are still unclear what they mean, and it is only the lens of employability skills that goes some way to clarify this. In qualitative work associated with this project, and contributing to the development of our conceptual framework (which report fully in Vermunt, Vignoles, & Ilie, Citation2016), we find that a majority of students are capable of articulating the set of skills, knowledge and competencies that they gain during higher education, but they do so in a variety of ways, and at various levels of engagement and intellectual depth. Therefore, and to address this lack of clarity, we include students’ views in our operationalisation of the conceptual framework, specifically by developing new measurement scales directly drawing on their voices, as described later.
In addition to the definitional diversity noted above, it must be noted that learning gain is only one of several constructs put forward by the wider literature surrounding student learning in higher education (Hill, Walkington, & France, Citation2016). Other similar, but subtly distinct concepts include: graduate attributes (with Australian research leading the way in terms of both theoretical understandings and empirical evidence, e.g. see Barrie, Citation2004, Citation2007; or Oliver, Citation2013); graduate profiles, competencies, qualities, or outcomes; generic attributes; transferable, employability, or soft skills; and core capabilities. The differentiating factor with regard to learning gain in comparison to these other concepts is the embeddedness of an aspect of change (Spronken-Smith et al., Citation2015). We find this aspect of change, in knowledge, in attitudes, skills and values, a necessary element of defining the constituent skills, abilities, attitudes and knowledge on which gain may be achieved. We turn to this in what follows.
Operationalising definitions and approaches to measurement
Operationalising the definition of learning gain into practical measurement instruments is a major challenge in the attempt to capture higher education learning gain. Already over a decade ago Barrie (Citation2004, p. 263) claimed that ‘even though claims of graduate attributes sit at a vital intersection of many of the forces shaping higher education […], they by and large lack the support of a conceptual framework or theoretical underpinning’. This is illustrated by the large variety of measures that have been implemented as learning gain indicators to capture gain across disciplines. Briefly, these measures include: degree outcomes (degree classifications, GPAs or exam scores) (Smith & Naylor, Citation2001); general standardised achievement tests (Klein, Benjamin, Shavelson, & Bolus, Citation2007); standardised critical thinking or reasoning tests (Blaich & Wise, Citation2011; Loes, Salisbury, & Pascarella, Citation2015); subject-specific learning progression or progress tests, as distinct from regular examinations (Van der Vleuten, Verwijnen, & Wijnen, Citation1996; Verhine, Dantas, & Soares, Citation2006); employability measures (Smith, McKnight, & Naylor, Citation2000); career readiness and career development (Camara, Citation2013); engagement (Carini, Kuh, & Klein, Citation2006; Ewell, Citation2010); experience and engagement in research study (Kilgo & Pascarella, Citation2016); motivation (An, Citation2015); openness to diversity (Bowman, Citation2010a); moral reasoning (Mayhew, Citation2012); and epistemological beliefs (Rosman, Mayer, Kerwer, & Krampen, Citation2017). Randles and Cotgrave (Citation2017) sum up the problem of appropriately measuring learning gain, when they argue that ‘it is difficult to conclude the best way to proceed with learning gain measures in English HE’ [higher education] (p. 57). It is important to note, from a methodological standpoint, that a vast majority of these measurement instruments have been successfully used in longitudinal assessment of gain, i.e. they have been used for repeated measurement of the same students over time, and not just as an outcome measure. As we argue later, this aspect of change is fundamental to the concept of gain from a theoretical standpoint, as it differentiates it from learning outcomes.
Although the aims of this paper are not to extensively review all existing measures and measurement instruments for learning gain, some aspects emerge as particularly noteworthy, especially given the relatively small proportion of empirical studies on the topic that provide extensive theoretical or conceptual justifications.
Firstly, the use of standardised achievement tests is widespread in the US context, but potentially more difficult to implement in England (Pollard et al., Citation2013). This is despite the fact that US evidence indicates that tests, such as the ETS Proficiency Profile (EPP) and Collegiate Learning Assessment (CLA+) predict later outcomes from degrees, such as employment and earnings (Roohr, Liu, & Liu, Citation2017). Other work has also used standardised tests and GPAs in combination to capture various measures of learning gain (Murtaugh, Burns, and Schuster (Citation1999); Bauer and Liang (Citation2003) and Astin and Lee (Citation2003)). However, using standardised tests to assess learning gain in English higher education would be difficult, since universities in England place greater emphasis on subject-specific content knowledge and, with their freedom to set their own curricula, there is not necessarily a common core of knowledge that one might assess straightforwardly (Pollard et al., Citation2013).
Other ‘objective’ measures for which gains may be empirically assessed exist, and are already in operation at English institutions. For instance, some higher education institutions in England employ a GPA-based system of student progress monitoring, while others are exploring options around learning analytics, looking at engagement with online learning platforms and modules test scores (McGrath et al., Citation2015).
Such measures, stemming mostly from exams and general assessments, do not however aim to capture the learning gain that is independent of subject-specific content knowledge. Nor are these measures comparable across institutions. This leaves one large category of measures that are regularly deployed: proxy measures, which work across a wide range of disciplines and focus on generic attributes, skills and abilities.
From this category of measures, student engagement is a popular proxy for learning gain, raising several issues. Firstly, although there is evidence that engagement correlates with subject-specific learning in higher education (e.g. Kuh, Citation2003), measures of student engagement are likely to suffer from social desirability and other biases. Secondly, as the National Student Survey in England (HEFCE, Citation2017) and others (e.g. Herzog, Citation2011; Pascarella, Seifert, & Blaich, Citation2010) report, student engagement is consistently high across a majority of higher education institutions, potentially rendering the engagement measure a weak indicator for the purposes of exploring what learning gains are made across different subjects, disciplines and courses. However, given significant evidence that (psychological) engagement is correlated with learning (Astin, Citation1996; Pascarella & Terenzini, Citation2005), the construct should arguably not be excluded from consideration when attempting to measure learning gain, especially if sufficiently refined measures can be developed. Even recent evidence from the UK Engagement Survey (Neves & Stoakes, Citation2018), the foremost engagement survey in the English context, suggests that other elements of this survey (on self-reported levels of skill) should be considered alongside more established measures of engagement.
Other measures with comprehensive theoretical underpinnings focus on cognitive and metacognitive aspects of learning, with patterns of learning measures (for which there is substantial evidence, not necessarily in relation to learning gain, e.g.: Vermetten, Lodewijks, & Vermunt, Citation1999; Vermunt & Vermetten, Citation2004) being both robust and validated against other subject-specific knowledge in assessments (Baeten, Kyndt, Struyven, & Dochy, Citation2010; Boyle, Duffy, & Dunleavy, Citation2003; Meyer, Citation2000). However, robust the measurements these instruments may provide, many of them are extensive, and incur significant completion time costs. At the same time, however, such measures provide robust evidence as to their use in a longitudinal framework, which is of paramount importance for the measurement of gain, as opposed to one-off learning outcomes. In particular, measures of self-regulation of learning have been successfully used in longitudinal self-report frameworks (e.g. Fryer, Ginns, & Walker, Citation2016), while others (e.g. Coertjens et al., Citation2013) have tested the different methodological approaches to longitudinal model estimation to also reach positive conclusions about the use of self-report questionnaires, despite limitations noted elsewhere (e.g. Bowman, Citation2010b).
In a context of at-scale delivery of a measure of learning gain relevant across disciplines, we argue that there is a high opportunity cost associated with using long subject-specific assessments, be they ‘objective’ tests of constructs, such as critical thinking, or self-report instruments. This calls, in our view, for a pragmatic revisiting of the conceptual underpinnings of the concept of learning gain, in a manner that is sensitive to the higher education context in which it is to be employed, and which allows for measurement instruments which seek to maximise user-friendliness and the potential for at-scale administration.
In what follows, we set out the main aims of the wider study this research is part of, proposing a conceptual framework of the dimensions of learning gain relevant across disciplines, and outlining the rationale behind the choice of associated measurement instruments.
Study and paper aims
The conceptual framework and associated empirical data we present in this paper emerge from a two-year longitudinal study of students’ learning gain in higher education in England. The overall aims of this study are threefold: first, to develop a conceptual understanding of learning gain applicable to the English higher education system; second, to create new, and adapt existing measurement instruments specifically for the purpose of capturing learning gain across disciplines, that are practical, user-friendly, and have the potential for at-scale administration; and third, to empirically test the extent to which this newly developed measurement tool works as expected, both scientifically and practically. Ultimately, the study is focused on the methods that may be used to capture learning gain at scale, as well as the potential limitations associated with this. The present paper explores the extent to which the conceptual framework developed in relation to the literature reviewed above and to students’ own views of their learning (see Vermunt et al., Citation2016 for a discussion) is borne out in quantitative empirical data.
Our research questions are:
What are the core dimensions of student learning gains across different disciplines?
Is it possible to develop a measurement tool that captures these core dimensions of student learning gains? What practical and scalable measurement instruments could such a tool encompass?
To what extent are a set of theoretically-embedded measures of non-subject-specific learning gain in higher education reliable, valid and practically usable?
To what extent do the assumptions about the relationships between the dimensions of non-subject specific learning gain observed empirically in the data match theoretical assumptions about learning gain?
As discussed above, the answers to these questions have direct implications for policy currently being developed in England and elsewhere in relation to the measurement of teaching and learning in higher education. We return to these points in our discussion.
A conceptual framework for learning gain
In light of the above evidence, we propose a definition of learning gain that encompasses an element of change, and is relevant regardless of the discipline pursued by students. Learning gain, in our interpretation, sits alongside the development of discipline-specific content knowledge. As such, we see learning gain as students’ change in knowledge, skills, attitudes, and values that may occur during higher education across disciplines. Our learning gain concept shows links to generic graduate attributes, which are the ‘qualities, skills and understandings a university community agrees its students should develop during their time with the institution’ (Bowden, Hart, King, Trigwell, & Watts, Citation2000, p. 21); it also links to Bennett et al.’s (Citation1999) notion of ‘generic skills’, especially in relation to the intrinsic flexibility required for any collection of skills and attitudes relevant across disciplines. Lastly, it draws on our own prior conceptual model of learning in higher education (Vermunt & Donche, Citation2017), based on prior empirical evidence.
The aim is to allow for measurement over time, though in this paper we do not present longitudinal analyses, instead we provide the conceptual and methodological background for the instrument that will enable this in the future. While the concept of learning gain that we put forward aims to be relevant across disciplines, we are not suggesting that the same pattern of gain must occur in all these disciplines. We argue, instead, that the range of knowledge, skills, attitudes and values we describe in what follows is relevant, and could exhibit change, in any discipline. More precisely, they are aspects that can change during any higher education course, whether explicitly included in the curriculum or (more frequently) implicitly embedded in the wider learning experience.
Drawing on the across-discipline relevance, we further understand the set of knowledge, skills, attitudes and values to be multi-dimensional. The exploratory work with students (Vermunt et al., Citation2016) and university staff (Bennett et al., Citation1999), and the existing literature, lends credence to our assumption about the multi-dimensional nature of learning gain.
In our development of the framework, we also draw on broad understandings of the aims and purposes of higher education in general. Looking at these espoused aims of higher education institutions around the world, some are remarkably universal (see Allen & Allen, Citation1988; Martin, Citation2016). Universities aim to educate people who are able to think independently and critically, to think deeply about problems in and around their discipline, to keep on learning and developing throughout their professional lives. They also aim to enable graduates to be able to work independent and collaboratively, to be engaged with society, to contribute to understanding and solving complex problems, to be able to communicate with people from other disciplines and with practitioners, and to be open to multiple perspectives. We take all these aspects under consideration when proposing the set of skills, attitudes, values and knowledge constituent of learning gain.
Additionally, we build on contemporary theoretical and empirical evidence around student learning in higher education, to relate our own conceptual framework to existing approaches around learning patterns (Vermunt & Donche, Citation2017); student approaches to learning (Asikainen & Gijbels, Citation2017); and self-regulated learning models (e.g. Pintrich, Citation2004; Zusho, Citation2017). From these distinct but overlapping approaches to understanding student learning we draw both systematising assumptions, about the potential relationships between the hypothesised dimensions of learning gain, and (later on), operationalisation assumptions, in relation to the measurement of learning gain associated with our proposed framework. We connect this with work by Bennett et al. (Citation1999, discussed earlier) and Dunne et al. (Citation1997) as a starting point for assembling the different constituents of the multi-dimensional concept of learning gain.
We propose a conceptual framework () consisting of four distinct components and three cross-cutting dimensions. For each of the components and dimensions we specify the skills, knowledge, attitudes, and values that they comprise. We also discuss how they fit together into the overall model for across-discipline learning gain and later turn to the measurement model associated with this conceptual framework.
Figure 1. Full initial conceptual framework for learning gain.
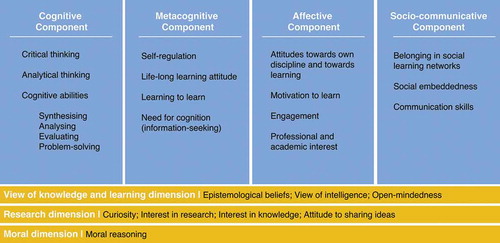
We refer to all of these aspects as general learning outcomes for which gains can be brought about during university education. Our model of change presupposes that these learning outcomes refer to attributes which students might already possess in some measure (e.g. critical thinking), but that could undergo further development as part of any degree course programme. Overall, we hold that gains on these learning outcomes complement development of subject-specific knowledge and skills, and may be identified (if present) in students of any discipline.
The first component is the cognitive component. This builds heavily on the management of information aspect of the core skills defined by Bennett et al. (Citation1999), as well as on the cognitive processing strategies component of the learning patterns model (Vermunt & Vermetten, Citation2004). This latter model assumes these strategies represent the step in the development of student learning that is most closely related to other (measurable) student outcomes (Vermunt & Donche, Citation2017). It also draws on literature that places significant emphasis on the development of critical thinking skills as one of the foremost roles of university education (e.g. Kules, Citation2016).
The skills we assume the cognitive component to comprise are: deep thinking, including critical thinking (based on skills, such as inference, recognition of assumptions, deduction, interpretation, evaluation of arguments); analytical thinking; and cognitive or reasoning abilities in the range of synthesising, analysing, evaluating and problem solving. Taken together, development of these skills would constitute a shift towards what the student learning literature refers to as ‘meaning-directed learning’ (Lonka, Olkinuora, & Makinen, Citation2004; Vermunt & Vermetten, Citation2004), or ‘deep approaches to learning’ (Biggs, Citation1987; Entwistle & McCune, Citation2004; Marton & Säljö, Citation1984).
The second component is the meta-cognitive component. This component is closely aligned to models of self-regulated learning (Dinsmore, Citation2017; Pintrich, Citation2004; Zusho, Citation2017) that place emphasis on the constructive nature of the learning process, which sees students control, monitor and modify their attitudes and behaviours in order to attain certain learning goals. Empirical evidence on self-regulated learning strategies (e.g. Dent & Koenka, Citation2016) also finds strong associations with subject-specific learning outcomes. Arguably (Dörrenbächer & Perels, Citation2016), the skills and abilities subsumed under the meta-cognitive component are the types of abilities and skills that differentiate higher education from all other levels of education, by way of requiring self-direction on the part of the student. The meta-cognitive skills we include contain elements of: self-regulation of learning; learning to learn; and information seeking behaviours, or need for cognition, with particular skills embedded within: reflecting, planning, self-awareness in relation to learning needs and goals, monitoring, adjusting and evaluating. We also include grit (Duckworth, Peterson, Matthews, & Kelly, Citation2007; Duckworth & Quinn, Citation2009) in our set of meta-cognitive aspects, in direct response to students’ perspectives in our preparatory qualitative work referring to specific aspects captured by the particular operationalisation of grit by Duckworth and Quinn (Citation2009, e.g. in relation to not giving up when faced with adversity). Other research has associated grit with conscientiousness (showing strong correlations, but not conceptual overlap, e.g. MacCann & Roberts, Citation2010), with the kind of self-regulatory behaviours we already include in this component, and also with later academic outcomes (Ivcevic & Brackett, Citation2014; Wolters & Hussain, Citation2015).
The third component relates to effective learning outcomes, which includes overall attitudes towards a subject, and towards learning and studying in general. Although not directly traceable to self-regulated learning or the learning approaches literature, the effective component is nonetheless an essential aspect of learning in higher education (e.g. Biggs, Citation1987; Fredricks, Filsecker, & Lawson, Citation2016; Fryer & Ainley, Citation2017). The international focus on student engagement, manifested in the US and England through large-scale surveys of student engagement and student satisfaction, highlights the importance the sector already attributes this component. Under this component we include: motivation (to learn); engagement with the pursued degree course, and with learning in general; professional/academic interest; and life-long learning attitudes and motivation.
Fourthly, the socio-communicative component captures learning outcomes that relate to the wider social world. The social aspect of this component originates from a wider reading of stated university aims and goals, to ‘transform[s] lives, strengthen[s] the economy, and enrich[es] society’ (HEFCE – Higher Education Funding Council for England, Citation2015, on the role of the higher education sector in England in general). The socio-communicative aspect is linked to existing evidence from the Wabash Study (2012) and elsewhere (Tynjälä, Citation2001) of a positive correlation between, for instance, academic writing conceptions and approaches and other subject-specific learning outcomes (Lonka et al., Citation2013). The learning outcomes that we include in this dimension are: level of belonging in social (professional/learning) networks; social embeddedness; communication skills; and societal engagement.
Underpinning these four components is a set of three dimensions. We theorise that these dimensions can act as moderators of each of the abilities, skills, and attitudes identified above, and are, on the whole, specific to higher education.
The view of knowledge and learning dimension shares commonalities with the conceptions of learning component of learning patterns models of student learning, according to Vermunt and Donche (Citation2017). It further draws on empirical evidence emphasising the fundamental role of higher education in changing students’ views of knowledge (e.g. Perry, Citation1970; Schommer-Aikins, Beuchat-Reichardt, & Hernández-Pina, Citation2012; Schommer-Aikins & Easter, Citation2009). We assume that this cross-cutting dimension includes students’ epistemological stance (or beliefs about knowledge), open-mindedness, and their view of intelligence.
We propose a second cross-cutting dimension, the research attitude dimension, in direct relation to the context of our study (England, and within that research-intensive universities, as we explain subsequently), and also drawing on further aspects of the conceptions of learning aspect of the learning patterns model mentioned above, and in particular, cooperative learning behaviours. We therefore include the following aspects under this dimension: curiosity; interest in research; interest in knowledge; and attitude to sharing ideas.
Lastly, the moral dimension relies on a key skill, moral reasoning, which is understood to reflect the degree to which a person uses higher order moral reasoning, a process that relies on: consensus-building procedures; insisting on due process; safeguarding minimal basic rights and organising social arrangement in terms of appealing to ideals (King & Mayhew, Citation2002), and is relevant in the context of higher education (Buchannan, Citation2015). The background to the inclusion of this dimension relates to further theories of learning in higher education not mentioned previously, in particular the theory of planned behaviour, which has been put forward as an explanation for certain illicit academic behaviours (e.g. cheating, see Harding, Mayhew, Finelli, & Carpenter, Citation2007), and can also be seen as a precursor (in the original proposition by Ajzen, Citation1985) of current self-regulated learning theories.
The theorised relationships between the components set out above draw on existing models integrating aspects of learning patterns (Vermunt & Donche, Citation2017). More precisely, we assume a strong relationship between cognitive and meta-cognitive processes, potentially moderated by the attitude to research (but this remains to be explored empirically), and the view of knowledge. At the same time, the self-regulated learning aspects of the meta-cognitive component are likely to underpin a wide variety of aspects in this framework, in line with prior evidence. In particular, we hypothesise that self-regulation of learning will have a negative association with lack of regulation, and a positive relationship with cognitive skills (such as relating and structuring). We do not hypothesise as to the strength of some of these associations, which we seek to explore in more detail with the use of our data. Further, we expect that within the socio-communicative dimension, which may present stronger links to the affective component and the moral dimension than to other aspects of the framework, social and emotional engagement will be positively correlated with each other, even after controlling for other aspects of cognitive or metacognitive skills, abilities, and competencies. We return to these hypotheses in the final section of the paper, addressing the relationships between the measured constructs from the perspective of validity of the framework. In doing so, we address convergent validity, whereby we explore the extent to which our hypothesised relationships are supported empirically; and discriminant validity, whereby we check that where we have not assumed a link (for instance between social and emotional engagement and reasoning ability, respectively) this is indeed the case.
Additionally, we posit that exploratory analysis is required. Barring any indication that the relationships are driven by the method of data collection (which we address below), we will explore the relationships between some of the constructs we are measuring, for which there is little or no prior evidence, at least not in the context of a comprehensive framework, such as the one we propose. We return to this in our Results section later on.
Operationalising the conceptual framework
The comprehensive conceptual framework introduced above is too broad to be directly operationalised into a set of measures. We therefore undertook the preliminary step of selecting from existing literature those measures that have robust empirical evidence to support them and that have been trialled at scale.
The choice of measurement instruments was strongly driven by the reality within which this research is embedded, as well as its aims. In particular, it was driven by the need for any instrument, either newly developed or already established, to be practical, easily usable by the wider higher education sector, and amenable to students, with evidence on the engagement of students in survey-based data collection suggesting this was not trivial, and amenable to substantial between-institutional differences (Porter & Umbach, Citation2006).
As a result of these drivers, we set out to assemble a measurement instrument that combined established measurement scales with re-developed instruments specifically adapted to the English context, and with newly developed scales that drew directly on qualitative work undertaken with students in English universities. This latter approach differs from the approach generally adopted in psychological and psychometric research (i.e. the use of existing scales), but is driven by the need to directly include students’ voice in how the aspect of learning gain that they have themselves identified as crucial are measured, as well as by this study’s explicit focus on testing out different methodological aspects of learning gain measurement.
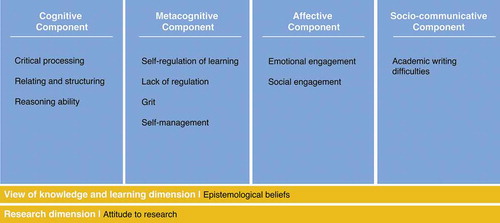
The measurement model derived from this choice process spans all four of the conceptual framework components, two of the three dimensions, and employs 12 separate measurement instruments. Some instruments were used in their original form with permission from other authors, some underwent substantial shortening and adaptation from existing instruments and some were compiled from an existing item bank. Additionally, given the remit of our study, we derived two scales specifically for the purposes of this research. illustrates how each of the four components and two dimensions is represented by at least one measurement scale.
Figure 2. Operationalised conceptual framework for learning gain.
Scales used directly from other authors include four sub-scales of the ILS (Vermunt & Donche, Citation2017; Vermunt & Vermetten, Citation2004), namely relating and structuring, critical processing, self-regulation of learning and lack of regulation in learning. The three former instruments employed a 5-point Likert-type response scale of the form ‘I rarely or never do this’ to ‘I almost always do this’, while the lack of regulation scale 5-point Likert response options ranged from ‘Not like me at all’ to ‘Very much like me’. Initial reliabilities for these scales were high across a wide range of studies reviewed by Vermunt and Vermetten (Citation2004), with internal consistency coefficients above 0.7 for a wide variety of studies, and even higher for our chosen subscales (up to 0.85 for processing strategies; and up to 0.79 for regulation strategies in a selective university sample).
The grit scale was also used, without changes, from Duckworth and Quinn (Citation2009), also with a 5-point Likert-type response scale that asked participants to respond to the extent to which certain behaviours listed in the items were ‘like them’ (from ‘Not like me at all’ to ‘Very much like me’). In testing this short-form grit scale, the above authors reported reliability coefficients between 0.73 and 0.83 indicating good internal consistency.
The scales for which permissions were obtained for usage and adaptation underwent a significant process of shortening, and as such are not comparable to the initial instruments. The reason for this adaptation emerged in the piloting phases of the initial instruments whereby, without exception, participants noted the length of the questionnaire as a substantial barrier to completion. The pragmatic decision to alter the scales was therefore taken. The modification approach differed by scale, as follows.
For academic writing behaviours (from Lonka et al., Citation2013), the items reflecting writing difficulties were selected and compiled into one scale. These also employed a 5-point response scale, from ‘Strongly disagree’ to ‘Strongly agree’. The initial scale included six separate subscales, which the authors’ empirical analysis suggested was the best fit. Given our item selection procedure (based on the items related to difficulty with academic writing), the initial reliabilities are only indicative, but the sub-scale from which most of our items come (‘Perfectionism’) had an internal consistency coefficient of 0.81.
The epistemological belief scale initially stood at 29-items long (Schommer-Aikins, Mau, Brookhart, & Hutter, Citation2000). Given that our entire learning gain instrument consisted of just over twice that when excluding epistemological beliefs, two subscales were selected (on the stability of knowledge, and the structure of knowledge), and the final scale only consisted of eight of the items from the original scale. The 5-point response scale also relied on agreement statements, from ‘Strongly disagree’ to ‘Strongly agree’. The initial scale had undergone significant trialling with younger students than our own sample (which we considered a positive aspect, in terms of accessibility and speed of response), and yielded an internal consistency coefficient of 0.88 (not reported in the paper, but calculated from reported inter-item correlations).
The emotional and social engagement scales (from Fredricks, Wang, et al., Citation2016, and Wang, Fredricks, Ye, Hofkens, & Linn, Citation2016) underwent a substantially less dramatic process, which still resulted in fewer items included in the final version than initially intended. The emotional engagement scale went from 11 items to 5 items through the removal of items that in the original scale were seen to be closely correlated with other scale items. The social engagement scale saw the removal of one item only, again for the same reason as above. Both these scales used 5-point agreement response scales, as per the original scales, which showed good internal consistency (alpha coefficients between 0.73 and 0.90).
The reasoning ability scale was derived from the ICAR bank of reasoning ability items (see Condon & Revelle, Citation2014, for a discussion), with support from the Cambridge Psychometrics Centre, and was composed of 12 items, of 4 different types: three-dimensional rotational reasoning, verbal reasoning, letters and numbers reasoning, and matrix reasoning.
Lastly, two new scales were generated for the purposes of this project, drawing on qualitative interviews conducted with 33 students in the participating institutions, which are discussed elsewhere (Vermunt et al., Citation2016). The self-management scale reflected students’ consistent reporting of time management and planning as an important aspect of their learning and development while at university. The attitude to research scale addressed the last component of the conceptual framework and was composed of six items. For both these scales, the item wording was derived directly from interview quotes, before being adapted to match the remainder of the questionnaire items employed.
Once the instrument was compiled, it was re-piloted with a small (N = 8) sample of students in a separate discipline, who were asked to comment on the clarity of the items and response options, on the length of the whole instrument, and their overall impressions. Positive views were obtained from this exercise, which we viewed as supporting our decision to adapt scales to the extent we had, despite the substantial methodological implications of this, including comparability with previous results. We note, however, that since the aim of this study is to provide the opportunity for the exploration as to whether such measures can be used for at-scale measurement of learning gain across disciplines, cross-study comparability is not the driving rationale behind our approach.
Overall research approach
The empirical component of the study as a whole comprises a two-year longitudinal survey. Over three survey waves (the first two 5–6 months apart, the third one a year after the second measurement round), the study invited students in 11 research-intensive universities to respond to an online tool which included the measurement instruments outlined above. The respondents were drawn from the population of both undergraduate and postgraduate students in four broad disciplinary areas: Business (and Business studies); Chemistry (and a broader set of life sciences if at least a component of the degree was Chemistry); English; and Medicine (including Medicine-related postgraduate courses). These disciplines were selected to include a range of average entry tariff points, a range of vocational orientations, traditionally small, as well as large subjects, and both the sciences and the humanities/social sciences or related.
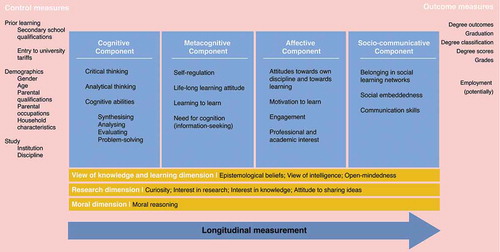
The conceptual framework introduced and tested in this paper draws on data from the first round of the longitudinal survey only. Later papers will assess learning gains over the two-year period and test the results from this framework against other outcomes from higher education (for instance degree outcomes or employability), as set out in below.
Figure 3. Conceptual framework, background variables controlled for, and outcome measures, for the wider study.
Method
Participants
In the first round of the survey, 49,118 students from the 11 participating institutions were initially contacted. To be eligible to participate, students were only required to be enrolled in a degree course where at least 50% of their course’s JACS code represented one of our four target disciplines described above. The sample therefore includes undergraduates and postgraduates; and home, EU, and international students. In total, 6,275 students provided valid responses (for an overall response rate of 12.78% – a good response rate for low-stakes educational online surveys with similar target participants (Nulty, Citation2008)). Of these, 4,782 responded fully to all measurement scale items in the questionnaire. These respondents make up the analysis sample for which results are presented in what follows. Of these 4,782 respondents, 71.63% reported being enrolled in undergraduate programs, 66.87% were female, 64.01% of the sample identified as ‘White’, Just under 84% were regularly domiciled in England, and of these English-domiciled students, 13.54% reported having been eligible for free school meals while at school, an indicator of low socio-economic status. Our respondents’ mean age was 22.64 years. This is higher than the average age for first-degree UK domiciled students, 57% of which are estimated by HESA to be under 20 (2018). But our sample includes 16% non-England domiciled students, and also postgraduate students, for which HESA estimates that roughly 41% are 30 and over (2018). Additionally, at least one institution operates a graduate-entry-only degree course in one of our target disciplines (with a much higher age range).
Procedure
All data were collected through on-line questionnaires using the Qualtrics online platform (using an EU server, in full compliance with the Data Protection Act, 1998) and sent to students at the 11 English universities between November 2016 (9 universities) and March 2017 (2 further universities). Questionnaires were either directly distributed to individual students, after securing personal contact details from institutions in accordance with Data Protection regulations in place at the time of data collection; or sent via the institution itself without the sharing of contact details with the research team. Participants had on average 3 weeks to respond to the questionnaire, and could return to an incomplete questionnaire to finish it. They received a small monetary token (£5) for their participation in the survey, which was emailed upon the questionnaire being completed. Moreover, they were informed that, upon completion of all three rounds of the survey, they would be entered in a raffle to win electronic prizes (as a result of evidence, Porter & Whitcomb, Citation2003 suggesting at least a small uptake in the response rate for lottery entry). Ethical approval was sought and received for the broader study from the Faculty of Education, University of Cambridge.
Data analysis
A key aim of this paper is to establish the extent to which the measurement scales used in this study (whether newly developed, adapted, or borrowed) show sufficiently good measurement characteristics to allow for later analysis of gain (in further work). To achieve this goal, confirmatory factor analysis was undertaken to explore the theorised conceptual structures of each of the 12 measurement scales against the empirical data, using the 4,782 complete cases from the first round of the survey only. This is therefore not an analysis of the gains potentially made by students on each of these dimensions, but rather an investigation of whether the dimensions themselves can be measured in this large survey framework. The analytical procedure first considered individual scales separately. After measurement models for each individual scales were derived, correlations between these scales were computed. Since we do not conceive the conceptual framework as a hierarchical model, we did not test a hierarchical model through SEM analyses here. Instead, we explored both convergent and discriminant validity, as well as further relationships beyond the above, without defining a priori hypotheses about direction or size of these relationships. All analyses were performed in Stata/IC 13.1 using a maximum likelihood estimator.
Sample size considerations
Determining sample size requirements in structural equation modelling (SEM) is neither trivial, nor does it rely on agreed-upon rules (Wang & Wang, Citation2012). There is a substantial amount of discussion (e.g. Kline, Citation2005; Marsh & Hau, Citation1999; Wang, Hefetz, & Liberman, Citation2017) about the lower bounds of acceptable sample sizes, but no consensus, with minimum sample sizes for fairly simple models ranging from 100 to 200. Muthén and Muthén (Citation2002, using a Monte Carlo simulation approach) suggest a sample size of 150 is minimally required for a simple CFA model of the kind we report in the first instance in this paper. Generally, the required sample size for SEM, and the specific case of confirmatory factor analysis (Kelley & Lai, Citation2018) is seen to be dependent on the number of parameters to be estimated, with specific requirements and larger sample sizes required for longitudinal models, which this work will in later stages entail (Schultzberg & Muthén, Citation2017). Wolf, Harrington, Clark, and Miller (Citation2013) argue that an increase in the number of latent factors in a model increases the minimum sample size significantly, but this quickly reaches a ceiling.
Our sample of 4,782 clearly exceeds this lower bound, so the data is sufficiently large. However, this immediately raises questions regarding as to whether it is too large. There is far less discussion on maximum sample sizes, despite that fact that this could potentially affect the estimates in a confirmatory factor analysis. Even the Satorra and Saris method (Citation1985) for the estimation of statistical power in such models, widely assumed to be one of the most robust a-priori approaches (Wang & Wang, Citation2012), does not provide estimates for the upper bounds of the sample size. We note, for instance, that the χ2 index of fit, an often-reported model fit statistic for SEM, such as the CFA, is sensitive to sample size, whereby a higher sample is more likely to result in the rejection of the tested model (i.e. of Type 1 error) (Wang & Wang, Citation2012). We therefore exercise caution in our interpretation of results from all our models.
Results
Measurement quality and reliability
Considering all of the above, the scales drawn directly from the ILS were tested individually. For the relating and structuring scale, made up of 7 items (), the results suggested that a uni-dimensional structure was appropriate, with a RMSEA of 0.060 (no rounding, 90% CI: 0.053, 0.067), and a CFI of 0.979 after the specification of an association between two pairs of items. Similarly, the critical processing scale, made up of four items, also showed the expected single-factor structure, RMSEA = 0.048 (90% CI: 0.027, 0.074), CFI = 0.998, with the need to specify only one covariance, between items 3 and 4 ().
Table 1. Scale: Relating and structuring (from Vermunt & Vermetten, Citation2004).
Table 2. Scale: Critical processing (from Vermunt & Vermetten, Citation2004).
The third scale derived from the ILS was the self-regulation of learning scale, which was composed of six items. Again, the model fit was good for a single factor solution, with RMSEA = 0.031 (90% CI: 0.023, 0.040) and CFI = 0.995, and only one allowed covariance, between items 3 and 4 (). Lastly, the ILS-derived scale lack of regulation, was made up of five items. The addition of two covariance paths between two pairs of items (1 and 2, 3 and 4) resulted in very good model fit for the uni-dimensional solution, with RMSEA = 0.013 (90% CI: 0.000, 0.030) and CFI = 1.00 ().
Table 3. Scale: Self-regulation of learning (from Vermunt & Vermetten, Citation2004).
Table 4. Scale: Lack of regulation (from Vermunt & Vermetten, Citation2004).
The standardised factor loadings for individual items for each respective scale were moderately-high to high, and point to positive latent constructs, with higher factor scores that would be indicative of higher levels of each respective aspect of learning (e.g. a higher factor score would indicate higher levels of self-regulation of learning or a more pronounced lack of regulation). All four scales emerged as reliable, with reliability coefficientsFootnote1 between 0.733 for self-regulation of learning, and 0.815 for relating and structuring.
Secondly, scales adopted without changes or adapted from other instruments were also analysed. Grit (from Duckworth & Quinn, Citation2009) was the first scale of this category to undergo the confirmatory procedure. The theoretical assumption was that this would be a one-dimensional scale, requiring only minimal addition of covariances between closely related individual items. The results of the analysis suggested that the single-factor model fit the data well. The one-factor model with three pre-specified covariances yielded a RMSEA of 0.056 (90% CI: 0.050, 0.062), and a CFI of 0.968, both within acceptable ranges. The standardised factor loadings were high, with the exception of item 2 (), which showed a low and negative loading of −0.15. A model removing this item from the structure of the scale yielded worse model fit, and therefore the item was retained in the analysis. Scale items were both positively and negatively worded, with positively-worded items loading negatively on the latent factor. To avoid interpretation difficulties, the factor was reversed, so that items reflective of higher grit loaded positively onto the latent factor. Therefore, the final grit construct is positively coded, whereby higher scores would indicate higher levels of grit. The final measurement scale was reliable, with a Cronbach’s α of 0.735.
Table 5. Scale: Grit (from Duckworth & Quinn, Citation2009, no changes).
Emotional engagement and social engagement were then individually tested as single factor structures. A model testing whether engagement (both social and emotional) was a better description of the empirical data did not yield acceptable model fit, even after a series of 10 consecutive modifications and was therefore rejected as an alternative. This is in line with empirical evidence, including that stemming from the original work from where the measurement scale derives (i.e. Fredricks, Wang, et al., Citation2016), and broader work on engagement (Fredricks, Filsecker, et al., Citation2016). For emotional engagement, a very good model fit was attained through the specification of two covariance paths between two pairs of items (item 2 and 5, and 4 and 5, in ): RMSEA = 0.043 (90% CI: 0.030, 0.058), and CFI = 0.998 (). For social engagement a good model fit was also achieved: RMSEA = 0.075 (90% CI: 0.066, 0.086), CFI = 0.961, with the pre-specification of two covariance paths (between item 1 and 2, item 2 and 4), and high emerging standardised factor loadings (). Both engagement latent variables are reflective of positive underlying constructs, where higher scores would indicate higher emotional and social engagement. The emotional engagement scale showed good reliability (α = 0.867). Social engagement, however, exhibited an internal consistency coefficient that is modest at best and potentially beyond the accepted margin (α = 0.665). The often-cited cut-off point of 0.7 is however not universally agreed upon (e.g. Vaske, Beaman, & Sponarski, Citation2017), and it is fairly well-established (Boyle, Citation1991; Peterson, Gischlar, & Peterson, Citation2017) that high internal consistency indices can also be indicative of item redundancy. We do not go as far as to argue (as McDonald, Citation1981, for instance) that Cronbach’s alpha is improper for determining internal consistency, but we suggest (in line with Cattell, Citation1978; Boyle, Stankov, & Cattell, Citation1995; and Ponterotto & Ruckdeschel, Citation2007) that strict cut-off points are not necessarily appropriate when the constructs being measured are either broader in nature, or the items do not exhibit identical covariance properties or close-to-overlapping meanings. Indeed, simulated data shows that Cronbach’s alpha is negatively biased when more realistic data properties are assumed (Trizano-Hermosilla & Alvarado, Citation2016), and other indices, such as the McDonald (Citation1999) or the Guttman λ2 are better suited.Footnote2 For the purposes of consistency, and given the fact that alternative indicators of internal consistency continue to be rarely reported, we report Cronbach’s α, but with a degree of leniency in its cut-off points.
Table 6. Scale: Emotional engagement (from Fredricks, Wang, et al., Citation2016, with substantial adaptations).
Table 7. Scale: Social engagement (from Fredricks, Wang, et al., Citation2016, with substantial adaptations).
In the initial reliability analyses for the academic writing behaviours scale (from Lonka et al., Citation2013), item 4 (It is useful to get other people’s comments on my texts) downwardly affected the reliability coefficient. Therefore, two structural models were estimated, one with, and one without item 4. The latter model (consisting of only six items) displayed better model fit statistics (RMSEA = 0.003, vs. 0.083; CFI = 0.994 vs. 0.908; with the same number, 3, of pre-specified covariance paths). The standardised factor loadings were mostly high, though items 1 and 3 showed very low loadings (<0.15). It was then decided to test a further model, of 4 items only, and with no other modifications. This model resulted in the best model fit of all academic writing difficulties models previously tested: RMSEA = 0.018 (90% CI: 0.000, 0.038; CFI = 0.999). The final latent factor captures the element of academic writing difficulties, with a reliability index of α = 0.667.Footnote3 Although this is modest, we argue that for the current purposes, and given the wide range of issues addressed by items in the scale, this is sufficiently high. A higher score on this factor would indicate a higher level of perceived difficulty when engaging with academic writing. All factor loadings were high, and in alignment with this understanding of the concept ().
Table 8. Scale: Academic writing difficulties (from Lonka et al., Citation2013, with substantial adaptations).
The epistemological beliefs scale was the last of the adapted scales to be tested. In the development of the scale, it was initially assumed it would consist of a two-dimensional construct made up of one scale on the stability of knowledge, and one scale on the structure of knowledge, respectively. Measurement models using both a two-dimensional and a one-dimensional latent structure were tested, and none yielded good model fit. The two-dimensional model with a higher-order epistemological beliefs latent factor did not converge, regardless of number of (theoretically-supported) modifications and was therefore discarded. A variation on this model, assuming stability and structure of knowledge as two correlated factors but without the higher-order latent construct, did converge. However, it did not achieve good model fit, and was also discarded. A one-dimensional model was subsequently tested, which did not achieve a good model fit either (), even after the pre-specification of several correlation paths between pairs of observed items. Therefore, and with the added support of the low reliability index (α = 0.479), this measurement scale was completely removed from analysis. The implications of this for the operationalisation of the conceptual framework will be discussed below.
Table 9. Scale: Epistemological beliefs (from Schommer-Aikins et al., Citation2000, with substantial adaptations).
Thirdly, newly derived scales were subjected to the same confirmatory analysis as above. The self-management scale was composed of seven items. The specification of two covariance paths between two pairs of items (items 3 and 4; and 6 and 7, see ) yielded a satisfactory model fit for the one-factor model. The factor loadings were mostly high, with the exception of item 4, which was moderate only. Given its low factor loading, the fact that it required a pre-specified covariance and that removing it improved the model fit, this item was removed from the analysis. The new self-management scale contained 6 items only and showed both sufficient reliability (α = 0.741) and good model fit: RMSEA = 0.066 (90% CI: 0.058, 0.075), CFI = 0.973. The factor loadings for the new scale were moderate to high ().
Table 10. Scale: Self-management (newly-created scale).
Foreshadowed by the earlier discussion of the development of the attitude to research newly-derived scale, this scale only displayed a good model fit for a uni-dimensional structure when covariance paths were included for five separate pairs of items. Removing items was not successful in reducing this sufficiently (and did not yield better model fit either) to warrant altering the set of items making up the scale. Therefore, it was retained as is stands, with an RMSEA of 0.066 (90% CI: 0.054, 0.078), and CFI = 0.996 (). The overall reliability of the scale was very high, at α = 0.916, potentially owing, as discussed earlier, to the similarity of the items employed.
Table 11. Scale: Attitude to research (newly created scale).
For the reasoning ability instrument, derived from items of four different kinds (matrix reasoning, verbal reasoning, letters and numbers reasoning, and rotational reasoning), the initial hypothesis was that a four-dimensional structure was the most accurate representation of the construct. Two sets of alternative models were therefore tested using the correlation matrix provided by tetrachoric correlations to account for the binary nature of each underlying item: one with a simple one-dimensional structure; and one with a four-dimensional structure underscoring a higher-order latent factor of reasoning ability. The one-dimensional model, in its simplest form, resulted in model fit statistics that were not within acceptable limits (RMSEA = 0.110 (90% CI: 0.107, 0.113), CFI = 0.847). The pre-specification of two covariance paths, between Items 2 and 3 of the Matrix type, and Items 1 and 2 of the Cube type, respectively, significantly improved the model fit, to just within accepted limits (RMSEA = 0.079 (90% CI: 0.0760 0.082), CFI = 0.925). All standardised factor loadings were in the moderate-to-high range, and the overall scale was sufficiently reliable, with Cronbach’s α = 0.769.
The alternative four-dimensional structure (with a higher-order Reasoning Ability factor) was tested given the theoretical assumption accompanying the four different types of items making up the scale. The model showed good fit, with RMSEA = 0.061 (90% CI: 0.058, 0.064), and CFI = 0.957, even without further specification, and the AIC and BIC Information criteria were smaller than in the one-dimensional model tested above, suggesting better fit ().
As a result, and despite the less complex structure of the single-dimensional model, the four-dimensional higher-order factor model was retained, as it required no modifications to show good model fit, and since the theoretical background and development of the scale (with items of four different types) also supported the more complex structure.
Validity
In addition to testing individual scales for their fit with the theorised structure and for their internal consistency, we undertook the testing of convergent and discriminant validity, to understand the extent to which the hypothesised relationships between the constructs were borne out in the data. For several relationships the existing evidence did not provide sufficient grounding to create hypotheses as to the strength or direction of association beforehand. We proceed to explore these with our subsequent analysis.
It is not our intention to test the full model of the framework as if it had a hierarchical structure, whereby the components and the dimensions represented factors which are in turn supported by other factors (i.e. our constructs). To do so would amount to a mis-representation of the full conceptual framework we have proposed (see ) precisely because of the pragmatic choices around which constructs to measure. As such, we do not see the measured constructs to provide a complete picture of the initial conceptual framework, but instead as a practical way forward towards measuring learning gain across academic disciplines (in a subsequent longitudinal design).
Therefore, in what follows we focus on exploring the validity of the framework, carrying out analyses that allow for the 11 latent factors with good measurement properties (i.e. all of the above except epistemological beliefs) to be correlated with each other in a pairwise manner.
Before turning to the results of the above, it is necessary to acknowledge the possibility that collecting data on 11 scales with one survey-based instrument renders the results liable to common method bias (Podsakoff, MacKenzie, Lee, & Podsakoff, Citation2003). More precisely, we need to check whether a single factor is able to capture more than 50% of the total variance across all our observed variables (i.e. the instrument’s items). Several approaches exist to undertaking this assessment (Richardson, Simmering, & Sturman, Citation2009). We employed the most parsimonious of these methods, by running a simple confirmatory factor analysis model with one only latent factor (i.e. the common method variance). This model showed very poor fit, with RMSEA = 0.084 (90% CI: 0.000, – Footnote4), SRMR = 0.098, CFI = 0.360, and TLI = 0.341. A single factor model explained just under 37% of the total variance across the items. We would therefore reject the hypothesis that a single factor is the best solution, and therefore also reject the hypothesis that common method variance biases our results.
We therefore carried out the exploration of validity without the addition of a single common method variance factor. We ran separate models correlating each of the 11 scales (except Epistemological Beliefs) with each other, and report results by returning to our hypothesised relationships between factors, as well as to several relationships where existing evidence did not provide a sufficiently strong basis on which to develop hypotheses of association. illustrates the pairwise latent factor correlation matrix.
Table 12. Scale: reasoning ability (individual items from ICAR, 2015, own assembly).
Table 13. Zero-order correlations between latent constructs (Pearson’s r).
As an indication of convergent validity, a vast majority of the theorised relationships between latent constructs were confirmed in the data. We report each in turn. First, we observed a cluster of moderate to high correlations between latent constructs in the cognitive component, with crossovers into the metacognitive component. In our sample, critical processing was very strongly associated to relating and structuring (r = 0.94). Further high correlations might suggest multicollinearity, but removal of specific items to address this (and the common method bias issue discussed earlier) does not result in conceptually-grounded removals of individual scale items from the analysis. We discuss the possibility of removing full scales from the analysis later on. Reasoning ability, however, did not show any linear correlation with the above two scales, which contradicts our initial assumptions. We return to this matter later on, in the discussion of our results. Within the meta-cognitive component, self-regulation was negatively associated with lack of regulation, confirming our initial assumptions, however the association was not particularly strong (r = –0.14). This was also the case for self-regulation and grit (r = 0.24) and self-management (r = 0.27), where the associations were weak to moderate, but statistically significant at the 1% level. Grit and self-management, on the other hand, exhibited the direction and strength of association we had originally assumed (r = 0.72).
Secondly, our assumptions around correlations between latent factors making up the affective component were more closely supported by the data, with social engagement correlating highly to emotional engagement (0.61).
Thirdly, and since we could not explore within-category associations for the dimensions and components where we had only measured one single construct, we focused on cross-component correlations. Our initial assumptions as to the observable correlations related to a relationship between the attitude to research and critical processing. We observed this in the data, with r = 0.55, significant at the 1% level. We also observed an initially theorised negative relationship between attitude to research and academic writing difficulties, but only with a moderate correlation (r = –0.29).
In terms of discriminant validity, we found few significant correlations between reasoning ability and cognitive or metacognitive processes and none are strong (). For instance, there appeared to be no linear association between reasoning ability and critical processing (r = –0.01, p = 0.736); correlations with relating and structuring approaches (0.05) and self-regulation (−0.02) were very weak and also non-significant (at even a 10% level); and the strongest, yet still only moderately-strong, relationships emerged between reasoning ability and social engagement (r = 0.24), and emotional engagement (r = 0.10), something our initial model would not have hypothesised. It remains to be seen in further work as to whether confounding factors (or mediation/moderation effects through other measured constructs) affect these relationships, and whether they potentially capture something else in the background of students.
Lastly, there are several relationships which we did not pre-specify an assumption for, as they were not supported by sufficient evidence from previous research in our particular higher education context. As such, we explore these relationships here. For instance, concepts within the affective component correlated negatively with academic writing difficulties (in the socio-communicative component, r = –0.33 between emotional engagement and writing difficulties; and r = –0.17 between social engagement and writing difficulties, both still statistically significant at the 1% level despite low-to-moderate strength).
Within the boundaries of the measurement-related caveats presented earlier, we take this evidence to be indicative of a broadly valid conceptual and measurement framework, as least from a discriminant, and convergent validity perspective. In further work we will explore the link to student characteristics measured outside our survey, as well as academic attainment, through data linked into our survey from administrative sources. For the time being, however, our results suggest that the framework as it currently stands is based on sufficiently good (though not perfect) measurement instruments, that can be deployed at scale, and which relate to one another mostly in ways that mirror initial theoretical assumption. We conclude with a discussion of the finer points made above, and implications for further work, ours and others’.
Discussion and conclusions
As a first step towards the measurement of learning gain over time, in this paper we have proposed a new conceptual framework for learning gain, as comprising seven main aspects: four components: cognitive, metacognitive, affective, and socio-communicative; and three cross-cutting dimensions: views of knowledge and learning, attitude to research, and moral aspects.
The empirical analysis, using at this point only data from the first round of the longitudinal survey, suggests that it is indeed possible to develop a measurement tool that captures these core dimensions of student learning gains, but that there are also limitations associated with this. The measurement tool developed to reflect six of the seven aspects above included12 measurement scales, and was grounded in both prior theoretical and empirical evidence, and in students’ own views about learning gain. This was done to maximize the potential construct validity of the tool. Nine measurement scales showed high reliability, two scales showed modest reliability and one scale showed unacceptably low reliability.We then explored convergent and discriminant validity in the above, finding sufficient support for our hypothesised set of relationships between constructs.
Limitations of the approach
Using data from the first round of our three-round longitudinal survey, from over 4,000 respondents, we found support for most, though not all, of the measurement scales we have employed, though we note the various caveats that come with any analysis of this nature. Firstly, to fully understand the extent to which the framework is valid, we must engage in further empirical work, as follows. To ascertain external validity, we will compare the characteristics of our analysis sample to that of the relevant student population of our 11 participating institutions. We argue that for the present aims, of understanding the underlying structure of measurement scales, representativeness is not the most important consideration, though we will revisit this when the availability of data permits. To address predictive validity, we plan to collect other control and outcome data enabling us to ascertain the relationships between our learning gain variables and other personal, contextual and outcome variables.
Secondly, several data-related and analytical limitations must be noted. To begin with, the present paper does not provide the longitudinal perspective required to understand gains over time. This is intentional, and the subject of further work. Additionally, some of the scales used in our survey have been subjected to fundamental alterations compared to their original sources. Our rationale in doing so is to provide an instrument that can be administered at scale, especially in light of evidence from other similar learning gain-focused initiatives that have experienced difficulties in engaging students (Mason-Apps, Citation2017). Despite these and other limitations addressed earlier, we contend that our pragmatic approach is sound and indicative of the potential to use the instrument for future longitudinal analysis.
Revisiting the framework in light of our results
In addition to the measurement-related discussion, the empirical data also provides an opportunity to re-cast a different perspective on the conceptual framework: we contend that while as a whole the measurement framework is a reliable and valid tool, the identification of further clusters of concepts in the theoretical framework, described in what follows, is useful for a deeper understanding of the aspects of learning gain to be explored further.
We interpret the correlations we observe above (in ) to suggest that the set of abilities, skills, attitudes, and view appear to create four broad clusters. First, a cluster comprising of self-regulation, critical learning and love for research (critical processing, relating and structuring, research attitude), that can be interpreted as deep, research-based and self-directed learning and thinking. Second, an affective/motivational cluster combining social and emotional engagement. Third, a cluster combining grit and self-management on the one hand, and lack of regulation and academic writing difficulties on the other. Finally, and surprisingly, a separate cluster of reasoning ability, not strongly related to any of the other learning gain aspects. The role of epistemological beliefs in this conceptual framework, which we were unable to measure successfully here, will be revisited after our second wave of data collection, where we have employed an alternative measure.
These clusters are closely aligned to the four initially theorised components. The cognitive component splits into deep learning and reasoning ability, however, which would suggest we are observing two relatively independent aspects of cognition. The relationship between deep learning and metacognition is seen to be very strong, so much so that a single cluster, of deep and self-directed learning and thinking could be constructed. From a practicality perspective, were the aim of the work to create the shortest possible measurement instrument (even at the expense of conceptual diversity), the strong correlations between concepts in this cluster could be interpreted as reason to remove one, or several such concepts from the measurement tool altogether. It remains to be explored to what extent this is desirable, and methodologically sound.
Further, the affective component emerges as particularly internally consistent, with emotional and social engagement strongly linked to each other. The initial assumption that the research dimension and the socio-communicative component could be strongly associated is only partially reflected in the data. Although a moderate negative correlation emerges between writing difficulties and attitude to research, it is the relationships of each of these aspects to self-regulatory learning patterns (e.g. strong negative relationship between academic writing difficulties and self-management behaviours) that are perhaps more interesting.
The reasoning ability aspect of the cognitive dimension appears to be only loosely related to other aspects of our framework. There may be several explanations for this. First, our research participants (almost all from Russell group universities) represent a relatively homogeneous group in their cognitive ability and thus the variation on this variable is relatively low compared the population of similar age. A second possible explanation could emerge from the hypothesis that cognitive reasoning ability as measured here and the other elements of the framework we have developed are really different things. Veenman, Wilhelm, and Beishuizen (Citation2004), for example, found only moderate correlations between intelligence and metacognition for university students, though our measure of reasoning ability is not analogous to intelligence. A third explanation, reaching back to our initial discussion of the limitations of measuring learning gain through self-report scales, could rest in the different measurement modes of cognitive reasoning (test-like items) and the other gain variables (self-reports). These may be alternative or even additive explanations, and the current evidence is insufficient to be conclusive about them. Further data drawn from the linked administrative data, and also the longitudinal data from our survey may shed some light on this. Work currently underway using these data explores the extent to which reasoning ability relates to subject-specific knowledge and attainment, both before and after higher education. If that analysis were to reveal associations between reasoning ability and pre higher education attainment in standardised national assessments, then our finding here would suggest that our instrument enables us to discern variation in other cognitive and metacognitive learning patterns irrespective of reasoning ability, which will have implications for looking at students’ learning gain in the broader context of their own, and their institutional backgrounds.
Implications for research
This paper represents the necessary first step towards the measurement of learning gain across disciplines. As such, its aim is to establish the conceptual and empirical tools to aid this measurement. Our further work, tracking the change over time in the aspects that have identified above, represents the second step, which we will report on in due course.
The empirical work here has, however, revealed several issues relevant to further longitudinal work. For instance, the findings have revealed concerns about parts of the measurement instruments employed. As has been documented elsewhere, students’ views of knowledge are difficult to capture reliably and even more so when the measurement instrument necessarily has to be limited in length because of practical considerations. We have therefore used an additional scale capturing views of knowledge in the second round of the survey, adapted from Heikkilä, Lonka, Nieminen, and Niemivirta (Citation2012). We will therefore be in a position to compare the reliability of these scales and to decide based upon empirical data as to the inclusion of a scale in the third round of the survey.
Looking forward, the longitudinal nature of the broader study from which this paper draws is necessary for the measurement of change, and therefore of learning gain. The second round of data collection has recently been completed, and a third round is underway at the time of writing. All participants responding, even partially, to the first round survey have been invited to return. This will provide the opportunity to retain the sample size, an issue of concern in all longitudinal research.
Implications for policy and practice
With regard to usability, we contend that our measurement instrument, grounded in theoretical and empirical evidence and developed alongside the key stakeholders in higher education (the students) does not compromise on usability. Its online implementation allows for fairly low-cost at-scale data collection, even when considering the costs associated with student incentives. The extent to which at-scale implementation hinges on considerations other than just costs remains to be explored. In terms of the time costs on the part of the participants, for the first round instrument, which included extensive information regarding the project, necessary for informed consent with regard to participation in the study and for data linkage, and also included the collection of background information, our most reliable estimates suggest the questionnaire required an average of 23–24 min’ completion time. This varied between students, but suggests that large-scale collection might not be hampered by the length of the instrument, and we have suggested a potential avenue (though with caveats) about shortening it even further above.
Large-scale collection raises a further important point of discussion: the voluntary or mandatory nature of participation. Voluntary cooperation by students puts high demands on ensuring student engagement to realize representative response rates. One could argue that students in higher education get mandatory assignments every day that form a natural part of their course, and that completing a learning gain measurement could be part of these mandatory assignments, if its results were to be beneficial to their education. This would, of course, ensure high response rates and good representativeness, but would require careful consideration before at-scale deployment.
A further aim of this research project was that the outcomes (both the conceptual framework and the measurement tools) would be used in the practice of higher education. We are working with the participating universities to realize this goal, by providing feedback to the institutions on: how the instrument was developed; its usability and operationalisation in each institution; response rates for each subject/institution combination (and the profile of students responding); and key findings. We also have worked in partnership with the 11 participating institutions from the beginning of the project to ensure that practicability and applicability were considered in the development of the framework, and in the adaptation and design of the measurement instruments.
Conclusion
In this paper, we have undertaken the first step towards the theory-driven and robust measurement of learning gain, putting forward a conceptual framework for understanding learning gain that is relevant across disciplines in higher education, and testing empirically the extent to which the measurement instrument derived from this framework can be put into practice. The empirical evidence is supportive of the validity of the proposed framework and the accompanying measurement tool has, we believe, the potential to be used at scale in English higher education to measure important aspects of learning gain across of academic disciplines. Given the importance of capturing learning gain as understood here, as distinct from other types of gains from higher education (content knowledge, employability, earnings, or degree outcomes), we suggest that our framework and instrument could usefully be trialled in a wider group of institutions.
Ethical approval
This research sought and received ethical approval from the Faculty of Education University of Cambridge. Explicit consent was obtained from all participants whose data are reported in this paper.
Acknowledgments
We would like to acknowledge the funding from the Office for Students (Higher Education Funding Council for England at the time of the award) under the Learning Gain Pilots scheme. We thank Prof Christina Hughes for her leadership of the LEGACY project, and all our LEGACY colleagues. The survey tool we introduce in this paper draws in part on existing published research and we would like to thank the following authors for their permission to use or modify their instruments, or for making them publicly available to other researchers: Prof Marlene Schommer-Aikins, Prof Kirsti Lonka, Prof Jennifer Fredricks, Prof Angela Duckworth, and The International Cognitive Ability Resource. Finally, we are indebted to the leaders, staff, and students of the 11 universities who gave their time to facilitate, and participate in, our study.
Disclosure statement
All authors declare they have no financial interest or benefit arising from the direct application of this research
Additional information
Funding
Notes
1. The risk of artificially low internal consistency coefficients (such as Cronbach’s alpha) increases for scales made up of small numbers of items. For the original critical processing scale, this means that the 0.733 internal consistency coefficient may have been downwardly biased by the small number of items, but still within acceptable margins.
2. For robustness, we have also computed Guttman’s λ2 for all our scales, and the results indicate good internal consistency for all of them.
3. See our discussion above in relation to the below 0.7 Cronbach’s alpha coefficient.
4. Not computable.
Related Research Data
References
- Ajzen, I. (1985). From intentions to actions: A theory of planned behavior. In J. Kuhl & J. Beckman (Eds), Action control (pp. 11–39). Berlin, Heidelberg: Springer.
- Allen, M.D., & Allen, M. (1988). The goals of Universities. Milton Keynes: Open University Press.
- An, B.P. (2015). The role of academic motivation and engagement on the relationship between dual enrollment and academic performance. The Journal of Higher Education, 86:, 98–126.
- Asikainen, H., & Gijbels, D. (2017). Do students develop towards more deep approaches to learning during studies? A systematic review on the development of students’ deep and surface approaches to learning in higher education. Educational Psychology Review, 29(2), 205–234.
- Astin, A. (1996). Involvement in learning revisited: Lessons we have learned. Journal of College Student Development, 37, 123–134.
- Astin, A.W., & Lee, J.J. (2003). How risky are one-shot cross-sectional assessments of undergraduate students? Research in Higher Education, 44(6), 657–672.
- Baeten, M., Kyndt, E., Struyven, K., & Dochy, F. (2010). Using student-centred learning environments to stimulate deep approaches to learning: Factors encouraging or discouraging their effectiveness. Educational Research Review, 5(3), 243–260.
- Barrie, S.C. (2004). A research-based approach to generic graduate attributes policy. Higher Education Research & Development, 23(3), 261–275.
- Barrie, S.C. (2007). A conceptual framework for the teaching and learning of generic graduate attributes. Studies in Higher Education, 32(4), 439–458.
- Bauer, K.W., & Liang, Q. (2003). The effect of personality and precollege characteristics on first-year activities and academic performance. Journal of College Student Development, 44(3), 277–290.
- Bennett, N., Dunne, E., & Carré, C. (1999). Patterns of core and generic skills provision in higher education. Higher Education, 37(1), 71–93.
- Biggs, J. (1987). Student approaches to learning and studying. Melbourne: Australian Council for Educational Research.
- Blaich, C.F., & Wise, K.S. (2011). From gathering to using assessment results: Lessons from the Wabash National Study. Urbana, IL: National Institute for Learning Outcomes Assessment.
- Blundell, R., Dearden, L., Goodman, A., & Reed, H. (2000). The returns to higher education in Britain: Evidence from a British cohort. The Economic Journal, 110(461), 82–99.
- Bowden, J., Hart, G., King, B., Trigwell, K., & Watts, O. (2000). Generic capabilities of ATN university graduates Canberra. Canberra: Australian Government Department of Education, Training and Youth Affairs. Retrieved from http://www.gradskills.anu.edu.au/generic-capabilities-framework
- Bowman, N.A. (2010a). Disequilibrium and resolution: The nonlinear effects of diversity courses on well-being and orientations toward diversity. Review of Higher Education, 33, 543–568.
- Bowman, N.A. (2010b). Can first-year college students accurately report their learning and development? American Educational Research Journal, 47(2), 466–496.
- Boyle, E.A., Duffy, T., & Dunleavy, K. (2003). Learning styles and academic outcome: The validity and utility of Vermunt’s inventory of learning styles in a British higher education setting. British Journal of Educational Psychology, 73(2), 267–290.
- Boyle, G.J. (1991). Does item homogeneity indicate internal consistency or item redundancy in psychometric scales? Personality and Individual Differences, 12(3), 291–294.
- Boyle, G.J., Stankov, L., & Cattell, R.B. (1995). Measurement and statistical models in the study of personality and intelligence. In D.H. Saklofske & M. Zeidnre (Eds.), International handbook of personality and intelligence (pp. 417–446). New York: Plenum.
- Britton, J., Dearden, L., Shephard, N., & Vignoles, A. (2016). How English domiciled graduate earnings vary with gender, institution attended, subject and socio-economic background. Institute for Fiscal Studies Working Paper W, 16.
- Brooks, P. (2012). Outcomes, testing, learning: What’s at stake? Social Research, 79, 601–611.
- Buchannan, A. (2015). Education and social moral epistemology. In H. Brighouse & M. McPherson (Eds.), The aims of higher education: Problems of morality and justice. Chicago: University of Chicago Press.
- Camara, W. (2013). Defining and measuring college and career readiness: A validation framework. Educational Measurement: Issues and Practice, 32(4), 16–27.
- Carini, R.M., Kuh, G.D., & Klein, S.P. (2006). Student engagement and student learning: Testing the linkages. Research in Higher Education, 47(1), 1–32.
- Cattell, R. B. (1978). The scientific use of factor analysis in behavioral and life sciences. New York: Plenum Press.
- Center for Inquiry at Wabash College. (2016). Wabash National Study 2006–2012. Retrieved from http://www.liberalarts.wabash.edu/study-overview/
- Coates, H., & Richardson, S. (2012). An international assessment of Bachelor degree graduates’ learning outcomes. Higher Education Management and Policy, 23(3), 51–69.
- Coertjens, L., Van Daal, T., Donche, V., De Maeyer, S., Vanthournout, G., & Van Petegem, P. (2013). Analysing change in learning strategies over time: A comparison of three statistical techniques. Studies in Educational Evaluation, 39, 49–55.
- Condon, D.M., & Revelle, W. (2014). The International cognitive ability resource: Development and initial validation of a public-domain measure. Intelligence, 43, 52–64.
- Dent, A.L., & Koenka, A.C. (2016). The relation between self-regulated learning and academic achievement across childhood and adolescence: A meta-analysis. Educational Psychology Review, 28(3), 425–474.
- Department for Education. (2016). Educational excellence everywhere. Policy Paper. Retrieved from https://www.gov.uk/government/publications/educational-excellence-everywhere
- Department for Education. (2017a). New education and skills measures. Retrieved from https://www.gov.uk/government/news/new-education-and-skills-measures-announced
- Department for Education. (2017b, June 29). Participation in education, training and employment by 16–18 year olds in England: End 2016. Statistical first release. SFR 29/2017. Retrieved from https://www.gov.uk/government/uploads/system/uploads/attachment_data/file/623310/SFR29_2017_Main_text_.pdf
- Dill, D., & Soo, M. (2005). Academic quality, league tables and public policy: A cross-national analysis of University ranking systems. Higher Education, 49(4), 495–537.
- Dinsmore, D. (2017). Toward a dynamic, multidimensional research framework for strategic processing. Educational Psychology Review, 29, 235–268.
- Dörrenbächer, L., & Perels, F. (2016). Self-regulated learning profiles in college students: Their relationship to achievement, personality, and the effectiveness of an intervention to foster self-regulated learning. Learning and Individual Differences, 51:, 229–241.
- Duckworth, A.L., Peterson, C., Matthews, M.D., & Kelly, D.R. (2007). Grit: Perseverance and passion for long-term goals. Journal of Personality and Social Psychology, 92(6), 1087–1101.
- Duckworth, A.L., & Quinn, P.D. (2009). Development and validation of the short grit scale (GRIT–S). Journal of Personality Assessment, 91(2), 166–174.
- Dunne, E., Bennett, N., & Carré, C. (1997). Higher education: Core skills in a learning society. Journal of Education Policy, 12(6), 511–525.
- Entwistle, N., & McCune, V. (2004). The conceptual bases of study strategy inventories. Educational Psychology Review, 16, 325–345.
- Ewell, P.T. (2010). The US national survey of student engagement (NSSE). In D. Dill & M. Beerkens (Eds.), Public policy for academic quality (pp. 83–97). Netherlands: Springer.
- Fredricks, J.A., Filsecker, M., & Lawson, M.A. (2016). Student engagement, context, and adjustment: Addressing definitional, measurement, and methodological issues. Learning and Instruction, 43, 1–4.
- Fredricks, J.A., Wang, M.T., Linn, J.S., Hofkens, T.L., Sung, H., Parr, A., & Allerton, J. (2016). Using qualitative methods to develop a survey measure of math and science engagement. Learning and Instruction, 43, 5–15.
- Fryer, L.K., & Ainley, M. (2017). Supporting interest in a study domain: A longitudinal test of the interplay between interest, utility-value, and competence beliefs. Learning and Instruction. Corrected proof. Retrieved from https://doi.org/10.1016/j.learninstruc.2017.11.002
- Fryer, L.K., Ginns, P., & Walker, R. (2016). Reciprocal modelling of Japanese university students’ regulation strategies and motivational deficits for studying. Learning and Individual Differences, 51, 220–228.
- Goldstein, H. (2014). Using league table rankings in public policy formation: Statistical issues. Annual Review of Statistics and Its Application, 1, 385–399.
- Goldstein, H., & Leckie, G. (2016). Trends in examination performance and exposure to standardised tests in England and Wales. British Educational Research Journal, 42(3), 367–375.
- Harding, T.S., Mayhew, M.J., Finelli, C.J., & Carpenter, D.D. (2007). The theory of planned behavior as a model of academic dishonesty in engineering and humanities undergraduates. Ethics & Behavior, 17(3), 255–279.
- HEFCE. (2017). National student satisfaction survey 2017. Results. Retrieved from http://www.hefce.ac.uk/lt/nss/results/2017/
- HEFCE - Higher Education Funding Council for England. (2015 February). Business Plan. Creating and sustaining the conditions for a world-leading higher education system. Retrieved from http://www.hefce.ac.uk/media/hefce/content/about/How,we,operate/Corporate,planning/Business,plan/HEFCE%20Business%20plan%2011%202%2015.pdf
- Heikkilä, A., Lonka, K., Nieminen, J., & Niemivirta, M. (2012). Relations between teacher students’ approaches to learning, cognitive and attributional strategies, well-being, and study success. Higher Education, 64(4), 455–471.
- Herzog, S. (2011). Gauging academic growth of bachelor degree recipients: Longitudinal vs. self-reported gains in general education. New Directions for Institutional Research, Report no. 150, p. 21–39. DOI: 10.1002/ir.387.
- Hill, J., Walkington, H., & France, D. (2016). Graduate attributes: Implications for higher education practice and policy: Introduction. Journal of Geography in Higher Education, 40(2), 155–163.
- Ivcevic, Z., & Brackett, M. (2014). Predicting school success: Comparing conscientiousness, grit, and emotion regulation ability. Journal of Research in Personality, 52, 29–36.
- Jorre de St Jorre, T., & Oliver, B. (2018). Want students to engage? Contextualise graduate learning outcomes and assess for employability. Higher Education Research & Development, 37(1), 44–57.
- Kelley, K., & Lai, K. (2018). Confirmatory factor models: Power and accuracy for effects of interest. In P. Irwing, T. Booth, & D. Hughes (Eds.), The Wiley handbook of psychometric testing: A multidisciplinary reference on survey, scale and test development (pp. 113–139). Chichester: Wiley.
- Kilgo, C.A., & Pascarella, E.T. (2016). Does independent research with a faculty member enhance four-year graduation and graduate/professional degree plans? Convergent results with different analytical methods. Higher Education, 71(4), 575–592.
- King, P.M., & Mayhew, M.J. (2002). Moral judgement development in higher education: Insights from the defining issues test. Journal of Moral Education, 31(3), 247–270.
- Klein, S., Benjamin, R., Shavelson, R., & Bolus, R. (2007). The collegiate learning assessment: Facts and fantasies. Evaluation Review, 31(5), 415–439.
- Kline, R.B. (2005). Principles and practice of structural equation modeling (2nd ed.). Guilford: New York.
- Knight, P.T., & Yorke, M. (2003). Employability and good learning in higher education. Teaching in Higher Education, 8(1), 3–16.
- Kuh, G.D. (2003). What we’re learning about student engagement from NSSE: Benchmarks for effective educational practices. Change: the Magazine of Higher Learning, 35(2), 24–32.
- Kules, B. (2016). Computational thinking is critical thinking: Connecting to university discourse, goals, and learning outcomes. Proceedings of the Association for Information Science and Technology, 53(1), 1–6.
- Leckie, G., & Goldstein, H. (2009). The limitations of using school league tables to inform school choice. Journal of the Royal Statistical Society: Series A (Statistics in Society), 172(4), 835–851.
- Leckie, G., & Goldstein, H. (2017). The evolution of school league tables in England 1992–2016: ‘Contextual value-added’, ‘expected progress’ and ‘progress 8ʹ. British Educational Research Journal, 43(2), 193–212.
- Liu, O.L. (2011). Measuring value added in education: Conditions and caveats. Assessment & Evaluation in Higher Education, 36(1), 81–94.
- Loes, C.N., Salisbury, M.H., & Pascarella, E.T. (2015). Student perceptions of effective instruction and the development of critical thinking: A replication and extension. Higher Education, 69(5), 823–838.
- Lonka, K., Chow, A., Keskinen, J., Hakkarainen, K., Sandström, N., & Pyhältö, K. (2013). How to measure PhD. students’ conceptions of academic writing-and are they related to well-being? Journal of Writing Research, 5(3), 1–25.
- Lonka, K., Olkinuora, E., & Makinen, J. (2004). Aspects and prospects of measuring studying and learning in higher education. Educational Psychology Review, 16(4), 301–331.
- MacCann, C., & Roberts, R.D. (2010). Do time management, grit, and self-control relate to academic achievement independently of conscientiousness? In R.E. Hicks (Ed.), Personality and individual differences: Current directions (pp. 79–90). Bowen Hills, QLD, Australia: Australian Academic Press.
- Marsh, H.W., & Hau, K.T. (1999). Confirmatory factor analysis: Strategies for small sample sizes. Statistical Strategies for Small Sample Research, 1:, 251–284.
- Martin, C. (2016). Should students have to borrow? Autonomy, wellbeing and student debt. Journal of Philosophy of Education, 50(3), 351–370.
- Marton, F., & Säljö, R. (1984). Approaches to learning. In F. Marton, D. Hounsell, & N. Entwistle (Eds.), The experience of learning (pp. 36–55). Edinburgh: Scottish Academic Press.
- Mason-Apps, E. (2017). Portsmouth HEFCE learning gain project. Presentation at the Annual Teaching and Learning Conference, Portsmouth. Retrieved http://www.port.ac.uk/research/learning-gain/about-the-project/
- Mayhew, M.J. (2012). A multilevel examination of the influence of institutional type on the moral reasoning development of first-year students. Journal of Higher Education, 83, 367–388.
- McDonald, R.P. (1981). The dimensionality of tests and items. British Journal of Mathematical and Statistical Psychology, 34(1), 100–117.
- McDonald, R. P. (1999). Test theory: A unified treatment. Mahwah, NJ: Lawrence Erlbaum Associates.
- McGrath, C.H., Guerin, B., Harte, E., Frearson, M., & Manville, C. (2015). Learning gain in higher education. Research Report RR996. Cambridge: RAND Europe. Retrieved from https://www.rand.org/pubs/research_reports/RR996.html
- Meyer, J.H. (2000). The modelling of ‘dissonant’study orchestration in higher education. European Journal of Psychology of Education, 15(1), 5–18.
- Murtaugh, P.A., Burns, L.D., & Schuster, J. (1999). Predicting the retention of university students. Research in Higher Education, 40(3), 355–371.
- Muthén, L.K., & Muthén, B.O. (2002). How to use a Monte Carlo study to decide on sample size and determine power. Structural Equation Modeling, 9(4), 599–620.
- Neves, J., & Stoakes, G. (2018). UKES, learning gain and how students spent their time. Higher Education Pedagogies, 3(1), 1–3.
- Nulty, D.D. (2008). The adequacy of response rates to online and paper surveys: What can be done? Assessment & Evaluation in Higher Education, 33(3), 301–314.
- OECD (2012a). AHELO feasibility study report. Volume 1: Design and Implementation. Retrieved from http://www.oecd.org/edu/skills-beyond-school/AHELOFSReportVolume1.pdf
- OECD (2012b). AHELO feasibility study report. Volume 2: Data analysis and national experiences. Retrieved from http://www.oecd.org/edu/skills-beyond-school/AHELOFSReportVolume2.pdf
- OECD (2012c). AHELO feasibility study report. Volume 3: Value-added Measurement and the Conference proceedings. Retrieved from http://www.oecd.org/edu/skills-beyond-school/AHELOFSReportVolume3.pdf
- OECD. (2017). Education at a glance 2017. OECD indicators. Retrieved from http://www.oecd-ilibrary.org/education/education-at-a-glance-2017_eag-2017-en
- Oliver, B. (2013). Graduate attributes as a focus for institution-wide curriculum renewal: Innovations and challenges. Higher Education Research & Development, 32(3), 450–463.
- Pascarella, E., Seifert, T., & Blaich, C. 2010. ‘How effective are the NSSE benchmarks in predicting important educational outcomes?’ Change Magazine (December). Retrieved from http://www.changemag.org/Archives/Back%20Issues/January-February%202010/full-how-effective.html
- Pascarella, E.T., & Terenzini, P.T. (1991). How college affects students: Findings and insights from twenty years of research. San Francisco: Jossey-Bass.
- Pascarella, E.T., & Terenzini, P.T. (2005). How college affects students: A third decade of research (Vol. 2.). San Francisco: Jossey-Bass.
- Perry, W.G., Jr. (1970). Forms of intellectual and ethical development in the college years: A scheme. New York: Holt, Rinehart, and Winston.
- Peterson, C.H., Gischlar, K.L., & Peterson, N.A. (2017). Item construction using reflective, formative, or rasch measurement models: Implications for group work. The Journal for Specialists in Group Work, 42(1), 17–32.
- Pintrich, P.R. (2004). A conceptual framework for assessing motivation and self-regulated learning in college students. Educational Psychology Review, (16), 385–407.
- Podsakoff, P.M., MacKenzie, S.B., Lee, J.Y., & Podsakoff, N.P. (2003). Common method biases in behavioral research: A critical review of the literature and recommended remedies. Journal of Applied Psychology, 88(5), 879.
- Pollard, E., Williams, M., Williams, J., Bertram, C., Buzzeo, J., Drever, E., … Coutinho, S. 2013. How should we measure higher education? A fundamental review of the performance indicators. Synthesis Report. London: HEFCE. Retrieved from http://www.hefce.ac.uk/pubs/rereports/year/2013/ukpireview/
- Ponterotto, J.G., & Ruckdeschel, D.E. (2007). An overview of coefficient alpha and a reliability matrix for estimating adequacy of internal consistency coefficients with psychological research measures. Perceptual and Motor Skills, 105(3), 997–1014.
- Porter, S.R., & Umbach, P.D. (2006). Student survey response rates across institutions: Why do they vary? Research in Higher Education, 47(2), 229–247.
- Porter, S.R., & Whitcomb, M.E. (2003). The impact of lottery incentives on student survey response rates. Research in Higher Education, 44(4), 389–407.
- Randles, R., & Cotgrave, A. (2017). Measuring student learning gain: A review of transatlantic measurements of assessments in higher education. Innovations in Practice, 11(1), 50–59.
- Richardson, H.A., Simmering, M.J., & Sturman, M.C. (2009). A tale of three perspectives: Examining post hoc statistical techniques for detection and correction of common method variance. Organizational Research Methods, 12(4), 762–800.
- Rodgers, T. (2005). Measuring value added in higher education: Do any of the recent experiences in secondary education in the United Kingdom suggest a way forward? Quality Assurance in Education, 13(2), 95–106.
- Rodgers, T. (2007). Measuring value added in higher education: A proposed methodology for developing a performance indicator based on the economic value added to graduates. Education Economics, 15(1), 55–74.
- Roohr, K.C., Liu, H., & Liu, O.L. (2017). Investigating student learning gains in college: A longitudinal study. Studies in Higher Education, 42(12), 2284–2300.
- Rosman, T., Mayer, A.K., Kerwer, M., & Krampen, G. (2017, June). The differential development of epistemic beliefs in psychology and computer science students: A four-wave longitudinal study. Learning and Instruction 49, 166–177.
- Satorra, A., & Saris, W.E. (1985). Power of the likelihood ratio test in covariance structure analysis. Psychometrika, 50(1), 83–90.
- Schommer-Aikins, M., Beuchat-Reichardt, M., & Hernández-Pina, F. (2012). Epistemological and learning beliefs of trainee teachers studying education. Anales De Psicología/Annals of Psychology, 28(2), 465–474.
- Schommer-Aikins, M., & Easter, M. (2009). Ways of knowing and willingness to argue. The Journal of Psychology, 143(2), 117–132.
- Schommer-Aikins, M., Mau, W., Brookhart, S., & Hutter, R. (2000). Understanding middle students’ beliefs about knowledge and learning using a multidimensional paradigm. Journal of Educational Research, 94(2), 120–127.
- Schultzberg, M., & Muthén, B. (2017). Number of subjects and time points needed for multilevel time-series analysis: A simulation study of dynamic structural equation modeling. Structural Equation Modeling: A Multidisciplinary Journal, 25(4), 495–515.
- Smith, J., McKnight, A., & Naylor, R. (2000). Graduate employability: Policy and performance in higher education in the UK. The Economic Journal, 110(464), 382–411.
- Smith, J., & Naylor, R. (2001). Determinants of degree performance in UK universities: A statistical analysis of the 1993 student cohort. Oxford Bulletin of Economics and Statistics, 63(1), 29–60.
- Spronken-Smith, R., Bond, C., McLean, A., Frielick, S., Smith, N., Jenkins, M., & Marshall, S. (2015). Evaluating engagement with graduate outcomes across higher education institutions in Aotearoa/New Zealand. Higher Education Research & Development, 34(5), 1014–1030.
- Trizano-Hermosilla, I., & Alvarado, J.M. (2016). Best alternatives to Cronbach’s alpha reliability in realistic conditions: Congeneric and asymmetrical measurements. Frontiers in Psychology, 7(769), 1–8.
- Tynjälä, P. (2001). Writing, learning and the development of expertise in higher education. In P. Tynjälä, L. Mason, & K. Lonka (Eds.), Writing as a learning tool (pp. 37–56). Netherlands: Springer.
- Van der Vleuten, C.P.M., Verwijnen, G.M., & Wijnen, W.H.F.W. (1996). Fifteen years of experience with progress testing in a problem-based learning curriculum. Medical Teacher, 18(2), 103–109.
- Vaske, J.J., Beaman, J., & Sponarski, C.C. (2017). Rethinking internal consistency in Cronbach’s Alpha. Leisure Sciences, 39(2), 163–173.
- Veenman, M.V., Wilhelm, P., & Beishuizen, J.J. (2004). The relation between intellectual and metacognitive skills from a developmental perspective. Learning and Instruction, 14(1), 89–109.
- Verhine, R.E., Dantas, L.M.V., & Soares, J.F. (2006). Do Provão ao ENADE: uma análise comparativa dos exames nacionais utilizados no Ensino Superior Brasileiro. Retrieved from http://www.scielo.br/pdf/ensaio/v14n52/a02v1452.pdf
- Vermetten, Y.J., Lodewijks, H.G., & Vermunt, J.D. (1999). Consistency and variability of learning strategies in different university courses. Higher Education, 37(1), 1–21.
- Vermunt, J.D., Vignoles, A., & Ilie, S. (2016). Defining learning gain in higher education – exploring the student perspective. Paper presented at the Society for Research into Higher Education. In Symposium A cross-institutional perspective on merits and challenges of learning gain for Teaching Excellence Framework. Paper 0230. Retrieved from https://www.srhe.ac.uk/conference2016/downloads/SRHE_ARC_2016_Programme.pdf
- Vermunt, J.D., & Donche, V. (2017). A learning patterns perspective on student learning in higher education: State of the art and moving forward. Educational Psychology Review, 29(2), 269–299.
- Vermunt, J.D., & Vermetten, Y.J. (2004). Patterns in student learning: Relationships between learning strategies, conceptions of learning, and learning orientations. Educational Psychology Review, 16(4), 359–384.
- Wang, J., Hefetz, A., & Liberman, G. (2017). Applying structural equation modelling in educational research/La aplicación del modelo de ecuación estructural en las investigaciones educativas. Cultura Y Educación, 29(3), 563–618.
- Wang, J., & Wang, X. (2012). Structural equation modeling: Applications using Mplus. Chichester: John Wiley & Sons.
- Wang, M.T., Fredricks, J.A., Ye, F., Hofkens, T.L., & Linn, J.S. (2016). The Math and Science engagement scales: Scale development, validation, and psychometric properties. Learning and Instruction, 43:, 16–26.
- Wolf, E.J., Harrington, K.M., Clark, S.L., & Miller, M.W. (2013). Sample size requirements for structural equation models: An evaluation of power, bias, and solution propriety. Educational and Psychological Measurement, 73(6), 913–934.
- Wolters, C.A., & Hussain, M. (2015). Investigating grit and its relations with college students’ self-regulated learning and academic achievement. Metacognition and Learning, 10(3), 293–311.
- Zusho, A. (2017). Toward an integrated model of student learning in the college classroom. Educational Psychology Review, 29(2), 301–324.