
 ?Mathematical formulae have been encoded as MathML and are displayed in this HTML version using MathJax in order to improve their display. Uncheck the box to turn MathJax off. This feature requires Javascript. Click on a formula to zoom.
Abstract
This study investigates shoreline changes to identify the affected communities, quantify the change rate, and explain the underlying factors that drive the changes. The study analyzed shoreline movements utilizing multi-date, high-definition satellite imagery from Google Earth Pro, which was derived from various sources including Landsat, Copernicus, Maxar Technologies, and TerraMetrics for the years 1984, 2010, and 2023. The DSAS plug-ing in ArcGIS 10.7.1, 1,582 transects were generated at 1000-metre intervals. The End Point Rates (EPR) and Net Shoreline Movement (NSM) were calculated for the three periods. The result revealed an NSM of −56.37 m/yr, indicating the dominance of erosion along the coast, with more than 70% of the coastline witnessing erosion. Kusemeta, Epene, and Awoye communities highlight the severity of the shoreline changes with values exceeding −400 m/yr, the cause of which has been linked to the development on the adjacent coast of Lagos and Lekki. The EPR shows a variation from −23.38 m/yr to 13.73 m/yr, further highlighting the erosion process and sediment deposition, respectively, though the latter dominates. The study underscores the severity of the shoreline recession on the Ilaje coast and recommends that future coastal development and erosion controls consider the broader impact on the adjoining coast.
Introduction
The coastal environments have become important worldwide because they account for a substantial proportion of human civilization and wealth. As the connection point between sea and land, they are home to diverse flora and fauna, contributing to the earth’s ecological balance. In addition, coasts have high tourist value and protect coastal infrastructure (Athanasiou et al. Citation2020). However, increased shoreline variability and erosion in this economically virile but ecologically sensitive interface have attracted interest from coastal engineers, researchers, community dwellers, policymakers, and other local and international stakeholders (Pantusa et al. Citation2018; Department of Environment and Science, Citation2018; Athanasiou et al. Citation2020; Gibbs et al. Citation2021; Fashae et al. Citation2022; Osanyintuyi, Wang, and Mokhtar Citation2022). The increased attention to shoreline changes is underscored by the current trend in global warming, causing sea-level rises, resulting in the erosion and flooding of coastal and riverbank communities (Samuel et al. Citation2017; Durowoju, Olusola, and Anibaba Citation2017, Citation2018; Ologunorisa, Durowoju, and Akinbobola Citation2021; Ogunjo et al. Citation2022). Evidence revealed that shorelines worldwide retreat at varying rates (Aiello et al. Citation2013; Masria et al. Citation2015; Ayadi et al. Citation2016; Osanyintuyi, Wang, and Mokhtar Citation2022). While shorelines recession and the attendant destructive impacts are a global phenomenon, the level of exposures and vulnerabilities differs markedly across the globe.
Primarily a product of tidal and sea waves, together with the spatio-temporal scale at which these forces operate (Boak and Turner Citation2005), changes in shorelines are known to be caused by natural factors like changes in climate, tidal movements, rate of sedimentation, beach erodibility, subsidence, and coastal terrain (Athanasiou et al. Citation2020; Osanyintuyi, Wang, and Mokhtar Citation2022; Ikuemonisan et al. Citation2023). These environmental factors are often triggered or exacerbated by anthropogenic factors, including population growth, deforestation, tourism, urban development, coastal sand excavation and other upstream activities, such as the construction of large dams that reduce riverine sediment supply (Jonah Citation2015; Athanasiou et al. Citation2020; Osanyintuyi, Wang, and Mokhtar Citation2022; Durowoju, Ologunorisa, and Akinbobola Citation2022, Citation2023; Ikuemonisan et al. Citation2023). Many studies have predicted a notable increase in sea level over the coming decades, which will exacerbate coastal erosion and cause monumental damage to coastal ecosystems together with the human civilizations that concentrate on this ecological zone (Oloyede, Williams, and Benson Citation2021). Increased population pressure coupled with the sustained quests for economic development has heightened coastal vulnerabilities in numerous regions of the developing world (Osanyintuyi, Wang, and Mokhtar Citation2022; Durowoju, Ologunorisa, and Akinbobola Citation2022).
Literature and Contextual Analysis Evidence from various regions, including Jamaica, highlights how sand theft accelerates beach erosion. For instance, the well-known case in Jamaica severely affected coastal stability and local ecosystems, where significant portions of a public beach were stolen for private use (Carroll Citation2008). In the context of Lagos, Nigeria, anecdotal and observational evidence suggests that unauthorized sand mining by artisanal miners and prominent construction to feed small- and large-scale construction works is widespread, contributing to severe coastal erosion (Ibe and Antia Citation1983; Fashae et al. Citation2022). However, due to the lower level of urban development along the Ilaje coast, the scale and magnitude of sand theft are relatively low compared to that of Lagos. Consequently, while sand mining remains a factor in coastal erosion along the Nigerian coast, the impact along the Ilaje pales in significance. Due to high demand in adjoining urban centers and resort developments, sand is often extracted for construction. This practice disrupts the natural sediment balance, increasing the coastline’s vulnerability to erosive forces.
One of the most common features of shoreline studies relates to quantifying and predicting change, which is vital for planning and mitigating shoreline erosion and associated threats to coastal life and assets. However, despite a quantum of well-researched papers on this subject, the measurement of shoreline changes and its prediction remains as complex and uncertain as the beaches and the entire nearshore environment that adjoin the shoreline (Vitousek et al. Citation2017). Miller and Dean (Citation2004) have attributed these complexities and uncertainties to extraordinarily complex, dynamic systems in perpetual temporal and spatial fluxes. Besides, these complexities and uncertainties are partly due to the scarcity of credible, up-to-date data that can feed into modeling shoreline changes and the vulnerability of coastal areas. Boak and Turner (Citation2005, Citation2022) have noted that shoreline detection techniques have advanced from the previous subjective visual interpretation of the early 2000s to a more objective method that leverages photogrammetry, collection of topographic data and techniques for processing digital images (Ayeni and Samuel Citation2014). Information on the previous and current location of shorelines and the rate of change over time are essential for effective engineering design and overall coastal zone management plan and implementation. Specifically, shoreline information is required to design coastal protection, research and monitor, calibrate and evaluate mathematical models, measure sea-level changes, map hazards, risks, and vulnerability, and formulate policies on coastal management (Hategekimana et al. Citation2020; Matin and Hasan Citation2021).
Digital Shoreline Analysis (DSA) has become a critical tool in monitoring shoreline changes, particularly in the global south, where coastal regions often face heightened vulnerability due to socio-economic factors and limited resources (Himmelstoss et al. Citation2021; Ataol, Kale, and Tekkanat Citation2019; Matin and Hasan Citation2021). DSA leverages high-definition satellite imagery alongside Geographic Information Systems (GIS) technology to quantify shoreline movements over time, providing valuable insights into erosion, accretion, and their underlying drivers. In the global south context, where data scarcity and resource constraints prevail, DSA offers a cost-effective and efficient means of monitoring shoreline dynamics. Traditional field-based methods, such as field surveys and beach profiling, are often impractical due to logistical challenges and the vast expanses of coastline involved, while aerial photography presents challenges of limited coverage and low resolution that drastically reduces measurement precisions. DSA overcomes these limitations by enabling the analysis of large geographic areas remotely, facilitating comprehensive assessments of shoreline changes.
Moreover, DSA’s quantitative approach allows for the precise measurement of parameters such as End Point Rates (EPR) and Net Shoreline Movement (NSM), essential for understanding shoreline changes’ magnitude and spatial patterns. This information is invaluable for coastal management planning and decision-making, particularly in regions where coastal communities rely heavily on marine resources and infrastructure. Additionally, the increased availability of multi-temporal satellite imagery utilized by DSAS facilitates the detection of subtle shoreline changes occurring over shorter time intervals, a capability absent in conventional shoreline analysis methods (Eludoyin, Oduore, and Obafemi Citation2012). By providing accurate and up-to-date data on shoreline dynamics, DSA empowers policymakers, researchers, and local communities to develop proactive measures for coastal adaptation and resilience-building. In the global south, where climate change impacts are often disproportionately felt, DSA plays a crucial role in enhancing coastal resilience and safeguarding livelihoods against the threats of erosion, inundation, and habitat loss. Thus, DSA is vital in advancing sustainable coastal development efforts and promoting the well-being of vulnerable coastal populations worldwide.
While many coastal cities and communities in the developing world have put technical and non-technical measures in place to reduce their exposure and vulnerability to shoreline changes, the situation in poorer regions is dire. The advancing mud coastline of Ondo State, Nigeria, home to over 300,000 people, has witnessed unprecedented exposure to the vagaries of coastal erosion, with many settlements washed away (Punch Newspaper Citation2018). In such poor and data-scarce coastal communities, the exposure, susceptibility and impact of shoreline recession are more pronounced due to various exacerbating socio-spatial, economic and political factors. Added to this is the near-absence of institutions and regulations in these regions, contributing to their vulnerability and reduced resilience (Samuel et al. Citation2014). Even within developing countries, the response and mitigation to shoreline changes vary. For instance, in Nigeria, while shoreline shifts along the Lagos coast have received attention from academics, governments and international stakeholders, the smaller communities along the Mahin coast in Ondo state have not been accorded commensurate attention even though they are more exposed and vulnerable to shoreline shifts.
Over the years, however, partly due to intensive coastline disturbance caused by aggressive urban development along the adjacent Lagos coast (Akinluyi, Adebola, and Adeseko Citation2018; Osanyintuyi, Wang, and Mokhtar Citation2022), there has been a remarkable shift in the orientation and intensity of cross-shore movement of winds, wave and tides together with the current they produce of the coastal areas of Ondo State, giving rise to persistent coastal erosion and submergence. The continued exposure and susceptibility of small and medium settlements to the rampaging erosive forces of sea and tidal waves due to the approaching longshore waves (Osanyintuyi, Wang, and Mokhtar Citation2022) can hinder progress toward achieving sustainable development goals, particularly the safe cities and human settlements (Goal 7) and Climate Action (Goal 13) (Samuel and Atobatele Citation2019a, Citation2019b; UNDP Citation2015; UNGA Citation2020).
While studies on shoreline recessions and coastline erosion accretion are not lacking, systematic studies using advanced methodologies and high-resolution data, particularly in under-resourced coastal communities, are few and far between. The dynamic nature of shoreline changes necessitates progressive studies leveraging current technological advances that improve data availability and analytical techniques. Understanding the geodynamics, geology, unique hydroclimatic conditions, and human activities specific to the coast studied is essential to contextualizing the shoreline changes. This study aims to analyze the changes over time in the shoreline along the predominantly advancing mud coast of Ondo State using DSAS software. Understanding the spatio-temporal pattern of shoreline changes will help plan and implement shoreline recession mitigation programmes and strategies. The study attempts to enhance the evaluation of shoreline changes in the study area.
Survey of literature
Shorelines represent the transitional zones linking the land and sea environments with considerable social, economic and environmental values, and the transition zones are characterized by high concentrations of human settlements (Melet et al. Citation2020; Matin and Hasan Citation2021). Shorelines’ economic, social and environmental importance to any geographical location makes coastline studies globally relevant. Studies conducted across the globe revealed that many coastal wetlands face erosion, severely risking their noteworthy ecological functions (Ford Citation2013; Cellone, Carol, and Tosi Citation2016). Also, the natural protection provided by the shorelines keeps vanishing, and as a result, the hydrogeological risk in the coastal areas is escalating (Cellone, Carol, and Tosi Citation2016; Athanasiou et al. Citation2020; Melet et al. Citation2020). The severity of shoreline erosion can be linked to global and regional changes driven by environmental processes like land subsidence, sea-level conditions, sediment physical attributes, bathymetry, and the coast’s configuration, orientation, and exposure.
However, shoreline erosion’s severity is primarily attributable to anthropogenic activities – coastal urban development and construction of coastal infrastructures and defenses (Ford Citation2013; Bosello and De Cian Citation2014; Toimil et al. Citation2020). It has also been observed that storm wave attacks, oceanic overwash, and longshore sediment transport are leading causes of shoreline erosion (Dean and Galvin Citation1976; Pilkey and Cooper Citation2012). From the current global evaluation of coastline changes, Mentaschi et al. (Citation2018) also affirmed that human activities are the predominant cause of perceived shoreline changes globally in the current context, with the influence of sea level rise (SLR) on coastline changes largely unnoticed in many tropical and temperate regions (Cramer et al. Citation2014; Duvat Citation2019; Melet et al. Citation2020).
Many studies have adopted different methods to study shoreline recession. Remote sensing, aerial photography, historical charts and photographs and beach surveys have been used by other authors in diverse geo-environmental contexts to monitor shoreline changes using Global Navigation Satellite System (GNSS) or video imagery, and ArcGIS 10.0 and satellite images (Boak and Turner Citation2005; Melet et al. Citation2020) and its unique add-on module, the Digitized Shoreline Analysis System (DSAS). Digitized shoreline data was utilized as the main input for calculations and analyses. DSAS enables the evaluation of shoreline change distance and rate using various historical coastline positions. (Thieler et al. Citation2009; Ataol, Kale, and Tekkanat Citation2019; Toimil et al. Citation2020). This system enables researchers to utilize multitemporal satellite images to compute statistics on shoreline change rates over time using shoreline vector data. Several studies have also employed physics-based models integrating forecasts of coastal erosion drivers linked to changes in climate (storm surges and waves, Sea-Level Rise (SLR)). These models enable the simulation of coastline changes caused by different factors and uncertainties (Alexandrakis and Poulos Citation2014; Pantusa et al. Citation2018; Toimil et al. Citation2020). Analysis using multiple criteria and indices that do not explicitly offer erosion estimates based on physics but focus on vulnerability ranking is consequently omitted.
However, some methods mentioned earlier have weaknesses, even though their strengths sometimes override shortcomings. Automated algorithms for detecting shorelines in satellite images are gaining increased attention because of the laborious nature of analyzing analogue data. For instance, studies by Shearman, Bryan, and Walsh (Citation2013) and Song et al. (Citation2019) have shown that these algorithms were able to measure changes in land area, particularly notable in large deltas across Southeast Asia, where the shoreline evolves rapidly (>10 m between two acquisitions). Their studies alluded that most shorelines develop at rates not exceeding 1 m/year. Therefore, attaining such precision is challenging even though the results recently derived from employing automated shoreline detection algorithms on a high-definition image database within the Google environment looked promising (Luijendijk et al. Citation2018; Mentaschi et al. Citation2018; Melet et al. Citation2020). As argued earlier, using Earth observations (EO), particularly satellite remote sensing for monitoring shore conditions, coastal hydro-geomorphological settings, and hazards, has notably developed due to the growing constellation of satellites equipped with radar sensors. Today, Copernicus is recognized as the primary global source providing openly accessible and freely available EO data (sentinels). However, EO data encounter challenges in coastal regions due to various factors. These include land contamination within the sensor footprint, which hinders significant data acquisition near the coast. Additionally, geophysical corrections typically exhibit lower accuracy in coastal regions. For instance, atmospheric components’ emissivity and absorption can alter the electromagnetic wave energy spectrum, thereby influencing its transmission as detected by satellite sensors.
Google Earth Engine API and Artificial intelligence (AI) bring new dimensions for swiftly processing dense Earth Observation (EO) datasets. This combination also offers solutions for addressing intricate environmental challenges in coastal areas within remarkably condensed time frames (Shulz, Hansch, and Sorgel Citation2018), such as tracking salinity and sea surface temperature in high-definition global coastal areas (Medina-Lopez and Ureña-Fuentes Citation2019), mapping the distribution of seagrass in coastal waters (Pérez et al. Citation2018), conducting land use/land cover classification (Aghighi et al. Citation2014), studying morphological changes and sediment transport (Goldstein, Coco, and Plant Citation2019) as well as conducting bathymetry inversion (Danilo and Melgani Citation2019; Benshila et al. Citation2020). Another emerging technique is the application of aerial drones in acquiring high-definition shoreline images and utilizing machine learning for automated processing. This approach aims to complete the first national-scale shoreline litter survey conducted by a single operator (Martin et al. Citation2021; Pucino et al. Citation2021; Escobar-Sánchez et al. Citation2021; Gonçalves et al. Citation2022). Aerial drones demonstrated moderate accuracy and high reproducibility in data collection. They offered reliable data quality and expedited screening of inaccessible locations, floating litter, fragile ecosystems or heavily polluted beaches. However, results from the study by Escobar-Sánchez et al. (Citation2021) posited that drones might not entirely substitute or complement current methods, particularly in monitoring Baltic beaches, but their utility could be more beneficial in managing other polluted beach areas. Presently, these methodologies are employed in spatial time series analysis and are adaptable to various EO satellite sensors for coastal variables. In a more advanced setting, these techniques can be expanded to short-term forecasting, such as creating early warning systems or even predictions for El Niño-Southern Oscillation (ENSO) events. (Ham, Kim, and Luo Citation2019; Melet et al. Citation2020).
Today, several studies have considered the adaptation measures to shoreline erosion. Jonah (Citation2015) and Ankrah, Monteiro, and Madureira (Citation2023) underscored the importance of implementing a proactive and well-coordinated strategy for managing coastlines. They noted the lack of a formalized coastline management plan as the root cause for inadequate coastal erosion management techniques. Studies have confirmed that the most crucial policy recommendation involves enhancing coastal adaptation strategies and community resilience, executing effective coastal zone management plans, and encouraging further research in this area (Ohwo Citation2018; Sierra et al. Citation2017, Citation2023; Phong, Quang, and Sang Citation2022; Sharaan, Iskander, and Udo Citation2022; Ülger and Tanrıvermiş Citation2023; Ankrah, Monteiro, and Madureira Citation2023; Coelho et al. Citation2023). To protect lives and properties, researchers in West African shorelines recommended several policies to bolster robust coastal zone management strategies, improve adaptation measures and enhance the resilience of coastal communities against potential risks (Ankrah, Monteiro, and Madureira Citation2023). Also, Sierra et al. (Citation2017) proposed eco-friendly strategies like employing submerged seagrass, which could effectively reduce the impacts of sea level rise (SLR) on breakwater overtopping. Moreover, implementing these measures could help reduce port agitation caused by changes in the direction of waves due to climate change.
Study area
The study was conducted in Ilaje Local Government Areas, Ondo State, Nigeria, encompassing over 400 communities across 3,000 square kilometers, with over 100 km coastline that extends from Lekki Peninsula (Lagos) to the mouth of Benin River in the east. A 2022 population projection from 2016 showed that over 445,200 people live in the study area, an integral part of roughly 50 million people living along the Nigerian coast (Ikuemonisan et al. Citation2023). It shares borders with Okitipupa Local Government to the north, Delta State to the east, Ogun State to the west and the Atlantic Ocean to the south. The topography varies from undulating lowlands to sedimentary deposits in the southernmost part, including sandy formations extending from Lagos State’s Lekki Peninsula to locations such as Araromi Seaside, Zion Lepe, Agba, Etugbo, Ipare, Mahin, and Ugbonla. Ilaje Local Government boasts the longest coastline in Nigeria, approximately 180 kilometers of Nigeria’s 759 km coastline (Danladi, Kore, and Gül Citation2017), which is conducive to thriving fishing activities ().
Figure 1. The Ilaje coastline.
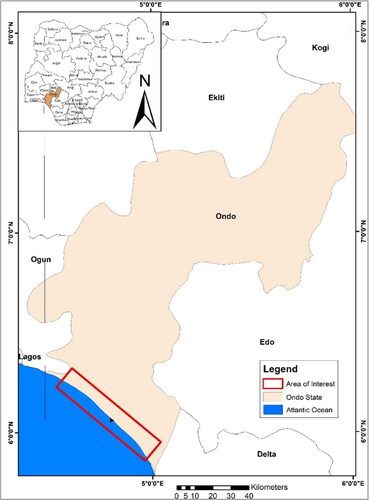
The area is predominantly agricultural, with more than 60% of the population depending on farming as a significant source of livelihood. Its ecological and climatological conditions, encompassing mangrove swamps in the coastal riverine areas to rainforests in the midlands, provide a favorable environment for cultivating diverse crops. The intensity and pervasiveness of coastal erosion have increased in the past decades (Punch Newspaper Citation2018), prompting local, national and international concerns as many settlements have been washed into the Atlantic Ocean. Although sea-level rise induced by climate change is recognized as the primary cause of coastal erosion and submergence, local factors that relate to coastline alteration due to urban development and oil exploration activities have exacerbated the problem.
Methodology
Data collection
High-resolution satellite imagery for the years 1984, 2010, and 2023 was sourced from Google Earth Pro, utilizing images provided by Landsat, Copernicus, Maxar Technologies, and TerraMetrics. These images were chosen for their comprehensive coverage and historical availability, ensuring a consistent temporal scope for analyzing changes in shoreline in the study area. Considering the prevalent sandy and mud beach shoreline, the analysis leveraged the indicator of a waterline or wetted area, a method well-established in previous studies (Sekovski et al. Citation2014; Hagenaars et al. Citation2017; Luijendijk et al. Citation2018; Fashae et al. Citation2022). This approach was adopted uniformly across all three selected years.
Image processing and standardization
Given the varying resolutions and sources of the satellite imagery, a uniform observational altitude of 300 meters was maintained across all images to standardize the viewing scale. This approach helps mitigate the variability in image resolution, as Google Earth Pro automatically adjusts the display resolution to optimize image clarity and detail at this altitude. While this method ensures visual consistency, it is important to note that it does not inherently correct geo-referencing or alignment discrepancies across different image datasets.
To address potential geo-referencing errors and accommodate inherent resolution differences, the Digital Shoreline Analysis System (DSAS) was used with a set positional uncertainty of 10 meters. This parameter was chosen using the root mean square (RMS) accuracy observed in Google Earth imagery, allowing for a buffer in positional accuracy that accounts for possible misalignments and the resolution limitations of the satellite data (Farah and Algarni Citation2014; Fashae et al. Citation2022; Ragheb and Ragab Citation2015). This setting is crucial for ensuring that the analysis reflects realistic estimations of shoreline positions and changes over time.
Shoreline delineation
The shoreline for each chosen year was digitized manually using the “Add Path” tool in Google Earth Pro at the set observational altitude. This process involved tracing the high-water mark visible in the satellite imagery, which defines the interface between land and water. The delineated shorelines were then exported as KML files and later converted for utilization in ArcGIS 10.7.1, where DSAS was utilized to analyze shoreline movement (Fashae et al. Citation2022). Recognizing that historical satellite images lack ground reference data and may exhibit positional inaccuracies (Wernette et al. Citation2017), the DSAS tool’s positional uncertainty was adjusted to 10 m to accommodate the RMS accuracy range observed in satellite images from the Google Earth platform (Farah and Algarni Citation2014; Fashae et al. Citation2022; Ragheb and Ragab Citation2015).
Analytical methodology
Using DSAS, shoreline changes were computed through three main statistical methods: End Point Rate (EPR), Net Shoreline Movement (NSM), and Linear Regression Rate (LRR). These methods provided a comprehensive understanding of both the direction and extent of shoreline changes throughout the study period. The analysis was conducted along transects set at 1000-meter intervals along the coastline, ensuring comprehensive spatial coverage. The NSM, indicating the shoreline change position between the earliest and latest years, served as the primary measure of overall shoreline alteration over the 39 years. End Point Rates (EPR) were computed for 1984, 2010, and 2023, quantifying the change rate. The EPR values were computed by dividing the NSM values by the total number of years using EquationEquation 1(1)
(1) .
(1)
(1)
To interpret the data, NSM values were aggregated to yield the overall change. Negative values representing erosion and positive values indicating accretion were derived by summing the respective negative EPR and positive values. The mean net change was determined by dividing the net change value by the total length of transects. Additionally, a linear regression rate of change statistic (LRR) was computed through regression line fitting across all points along the transects. It facilitated the depiction of a trend line illustrating the direction and extent of shoreline changes, accounting for the squared residuals of data points from the regression line.
Validation and error handling
The validation of the shoreline data was conducted using multiple methods. For the 2010 shoreline data, validation was performed using GPS coordinates and shoreline data from a previous study conducted between 2010 and 2012 (Adagbasa and Ige-Olumide Citation2014). This provided a reliable comparison to ensure the accuracy of the delineated shorelines for that year. For the 2023 shoreline data, a series of ground-truthing exercises were undertaken, comparing the satellite-derived shoreline positions with high-precision GPS measurements collected on-site. These validations ensured that the satellite-derived data accurately reflected the actual shoreline positions.
The formula used for calculating the distances between GPS points and satellite-derived points is given by the geodesic distance formula:
Distance = geodesic (GPS coordinates, Satellite coordinates).meters
The average deviation and RMS error were calculated using the following formulas:
(2)
(2)
(3)
(3)
where di represents the distance between the GPS point and the corresponding satellite-derived point, and nn is the total number of points.The Combined Positional Uncertainty (CPU) was computed using the root sum of squares approach to account for GPS accuracy, human digitizing error, and the RMS error of the satellite data:
(4)
(4)
Results of validation
The validation process yielded the following results:
2010 validation results
Average Deviation: 7.93 meters
RMS Error: 8.94 meters
Combined Positional Uncertainty: 10.29 meters
2023 validation results
Average Deviation: 6.83 meters
RMS Error: 7.74 meters
Combined Positional Uncertainty: 9.27 meters
Explanation of results
Average Deviation: The average deviation quantifies the average distance between the GPS-measured shoreline points and the corresponding satellite-derived points. For 2010, this value is 7.93 meters, and for 2023, it is 6.83 meters. These values reflect the general accuracy of the shoreline data.
RMS Error: The RMS error provides a measure of the average squared difference between the GPS and satellite-derived points. For 2010, the RMS error is 8.94 meters, and for 2023, it is 7.74 meters. This value is useful for understanding the overall consistency of the positional differences.
Combined Positional Uncertainty: The combined positional uncertainty accounts for GPS accuracy (assumed to be 1 m), human digitizing error (assumed to be 5 meters), and the calculated RMS error. For 2010, the combined positional uncertainty is 10.29 meters, and for 2023, it is 9.27 meters. This comprehensive measure provides a robust estimate of the total potential error in the shoreline positions.
Methodological limitations
While the methodology used in this study is robust and comprehensive, several limitations should be noted:
Human Error in Manual Digitization: The process of manually digitizing the shoreline can introduce human error, which may affect the precision of the delineated shorelines.
Resolution Variability: Although a consistent observational altitude of 300 meters was used to mitigate resolution differences, inherent variations in image resolution across different years may still impact the accuracy of shoreline delineations.
Geo-Referencing and Sensor Errors: Potential discrepancies due to geo-referencing errors and sensor-related issues in satellite imagery can affect the positional accuracy. The DSAS tool’s positional uncertainty parameter of 10 meters helps to accommodate these errors, but it cannot completely eliminate them.
Atmospheric and Sensor Anomalies: Variations in atmospheric conditions and sensor performance at the time of image capture can introduce additional inaccuracies, which were not fully controlled for in this study.
Temporal Gaps in Data: The temporal gaps between the selected years (1984, 2010, and 2023) may miss short-term shoreline changes and events that could influence long-term trends.
By addressing these limitations and employing strategies such as setting positional uncertainty in DSAS and validating findings through ground-truthing and cross-verification, the study ensures a reliable assessment of shoreline changes while acknowledging the inherent challenges in the methodology.
Results and discussion
Shoreline dynamics
This section discusses the results of a coastal analysis conducted using the Digital Shoreline Analysis System (DSAS) software. The analysis aimed to assess shoreline dynamics over time along evenly spaced transects perpendicular to the shoreline. Four primary rate calculation methods were employed: End Point Rate (EPR), Net Shoreline Movement (NSM) and Linear Regression Rate (LRR). The following outlines the main findings derived from each rate calculation method:
Net shoreline movement (NSM)
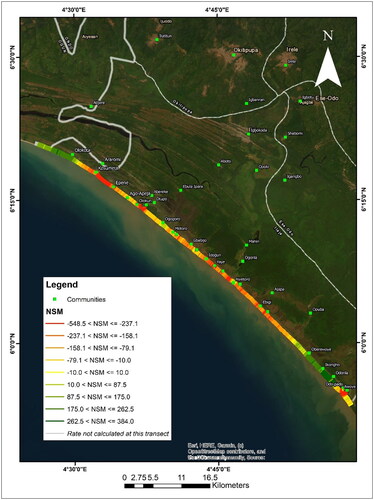
illustrates the NSM analysis, which revealed an overall average annual change in shoreline position of −56.37 meters/year, signifying a prevalent trend of shoreline retreat or erosion. This average is based on data from 1582 transects. Approximately 70.42% of these transects exhibited negative distances, indicative of erosion, while the remaining 29.58% exhibited positive distances, signifying accretion. The maximum recorded annual erosion rate ranged from −400 to −548.43 meters/year between the Kesumeta, Epene, and Awoye communities. In comparison, the highest yearly accretion rate reached 383.98 meters/year between Ikorigho and Odonla communities.
Figure 2. The net change in shoreline position.
End point rate (EPR)
EPR analysis yielded an average annual shoreline change rate of −1.43 meters/year, based on two endpoints at different times. Among the 1582 transects, 70.42% exhibited erosional trends, while 29.58% displayed accretional tendencies. The maximum annual erosion rate observed was −23.38 meters/year around the Omifun-Odo community, and the highest annual accretion rate recorded was 13.73 meters/year at the Odonla community ().
Figure 3. Shoreline change rates from linear regression analysis.
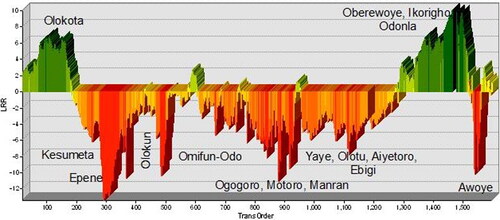
Linear regression rate (LRR)
The LRR method resulted in an average annual change in shoreline position of −1.23 meters/year, derived from linear regression analysis of 1,557 transects. Of these transects, 67.76% showed erosional trends, while 32.24% showed accretional trends. The maximum annual erosion rate recorded was −13.42 meters/year at the Kesumeta, Epene, and Awoye communities (), while the yearly maximum accretion rate reached 10.07 meters/year at the Odonla community.
The findings of this study revealed predominantly negative shoreline movement, indicating coastal erosion in over two-thirds of the Ilaje coastal stretch. Despite this, it is essential to note that small swathes of the coastline exist where accretion was observed. What stands out as the significant finding of this study is the magnitude of the erosion in terms of pervasiveness and intensity when compared to the trends in the adjoining coastlines. The −56.37 meters/year annual Net Shoreline Movement is almost seven times the −8.8 m/yr observed by Fashae et al. (Citation2022) in the adjacent coast of Lagos and nearly two times the 30 m/yr reported by Ibe and Antia (Citation1983) along a section of Lagos coastline. Although, the rates of erosion were uneven across the coastal transect, the maximum value of −548.43 meters/year around Kesumeta, Epene, and Awoye communities points to the severity of the shoreline retreat in Ilaje, which has attracted the attention of the media (Punch Newspaper Citation2018; Premium Times Citation2023). The field observation conducted by the authors revealed that several communities, notably inhabitants of Ayetoro, Ogogoro and Awoye, have had to migrate inland as the original locations of these communities now lie in the ocean. It is instructive to note that while the shoreline retreat has been long in history, the erosion rate has accelerated over the recent years, with the mean annual beach loss rate standing at 1.3 m/yr with the maximum value at −23.38 m/yr.
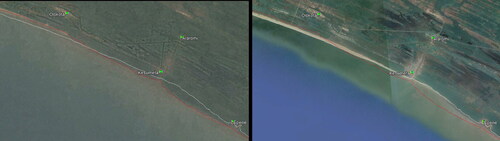
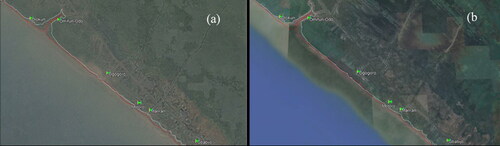
presents a high-resolution satellite depiction of the Olokota, Kesumeta, and Epene communities. The 2023 imagery distinctly illustrates the accretionary process within the Olokota community, evident by the emergence of a beach and consequential sand deposition. Notably, the Kesumeta and Epene communities, exhibiting the highest annual erosion rates, are conspicuously discernible in both the 1984 and 2023 images. The extent of land reduction is explicitly observable in the 2023 imagery.
Figure 4. Shoreline change rates in Olokota, Kesumeta, and Epene communities from 1984 to 2023. (a) 1984, (b) 2023. The white line represents the 2023 and the red line 1984.
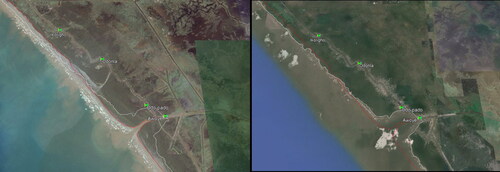
The erosion-induced land loss within the Olokun, Omifun-Odo, Ogogoro, and Motoro communities is perceptible through a comparative analysis of satellite imagery captured in 1984 and 2023. Examination of the Olokun and Omifun-Odo estuary illustrates a discernible reduction in land extent over the intervening years, as depicted in .
Figure 5. Shoreline change rates in Olokun, Omifun-Odo, Ogogoro, and Motoro from 1984 to 2023. (a) 1984, (b) 2023. The white line represents 2023, and the red line is 1984.
Existing literature extensively discusses the environmental determinants of shoreline changes, including geological characteristics, fluvial processes, climatic factors, biotic influences, and tidal and wave dynamics (French et al. Citation2015; Ibe and Antia Citation1983; Osanyintuyi, Wang, and Mokhtar Citation2022). However, these natural processes are significantly aggravated by anthropogenic activities such as urbanization, deforestation, and dredging. Sea level rise emerges as a particularly potent driver of global shoreline dynamics (Ford Citation2013; Samuel et al. Citation2014; Mentaschi et al. Citation2018; Fashae et al. Citation2022), especially in geological formations prone to chemical weathering, such as the transgressive mud formation predominant along the Ilaje coastline. Moreover, the heightened intensity of wave action, propelled primarily by offshore winds generating powerful and frequent wave swells, amplifies both cross-shore and along-shore erosional forces (Ibe and Antia Citation1983).
Additionally, the construction of dams along rivers discharging into the ocean disrupts fluvial sedimentation processes at river mouths. Previous research indicates that dam construction diminishes sediment transport and deposition at river mouths, exacerbating coastal sediment deficits (Masria et al. Citation2015; Osanyintuyi, Wang, and Mokhtar Citation2022), Although fragmented evidence exists, as observed in the context of the Chao Phraya River and Delta in Thailand (Bidorn et al. Citation2021), when sedimentation rates at river mouths fall below rates of beach erosion, the denudative impact becomes pronounced. This phenomenon partially elucidates the notably high rates of beach erosion observed around areas where major rivers and creeks discharge into the Atlantic Ocean, such as Epene, Ogogoro, and Awoye ().
Figure 6. Shoreline change rates in the estuary of Awoye from 1984 to 2023. (a) 1984, (b) 2023. The white line represents the 2023 and the red line 1984.
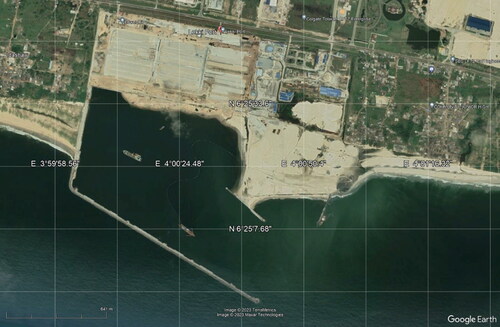
The predominant factor underlying the shifting of the Ilaje shoreline pertains to developments occurring in adjacent coastal areas. While the Ilaje coastline remains relatively untouched by intensive urbanization, neighboring coastlines in Lagos and Lekki are characterized by bustling developmental activities spanning urban expansion, industrial projects, and port infrastructure ( and ). Noteworthy developments include the establishment of expansive estates along the coast, exemplified by projects like Eko Atlantic City, some of which extend into the sea. Additionally, significant installations such as the Dangote Refinery, situated on the sandy beach of Magbon Segun, a few kilometers from Ogogoro, and the Lekki Deep Sea Port with its artificial harbor (), have collectively reshaped tidal dynamics along the entire western axis of Nigeria’s coastlines, with discernible impacts felt most acutely along the Ilaje coast (Danladi, Kore, and Gül Citation2017; Fashae et al. Citation2022; Osanyintuyi, Wang, and Mokhtar Citation2022). These alterations in shoreline infrastructure and land use have substantially modified tidal wave dynamics, exerting pronounced effects on the Ilaje shoreline. Diurnal tides, in particular, play a significant role in driving shoreline changes, as semi-permanent currents generated by these tides run nearly perpendicular to the Ilaje coasts, leading to substantial sediment removal from the beach.
Figure 7. Breakwater structure in adjacent Lagos-Lekki Coast.
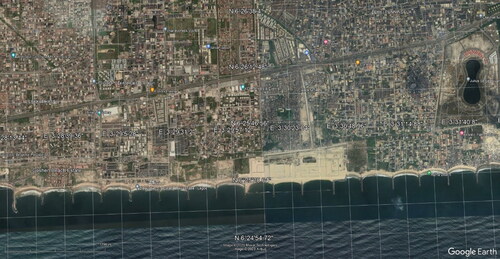
Figure 8. Lekki deep sea port disrupting nearshore and cross shore waves.
Ibe and Antia (Citation1983) posited that many beach replenishment initiatives in Nigeria involve the extraction of sand from the foreshore to replenish eroded beaches, thereby disrupting the dynamic equilibrium between beaches and the continental shelf, consequently exacerbating shoreline recession. This phenomenon parallels the construction of wave barriers, seawalls, groins, and breakwaters along the adjacent coastlines of Lagos and Lekki () aimed at mitigating beach erosion. While these structures have provided some relief to the Lagos-Lekki coast, the Ilaje coast has borne the brunt of the resultant misalignment in tidal and wave orientations along the western axis of Nigeria’s coastline.
Studies indicate that the effectiveness of these structures is short-lived, primarily due to their implementation without due consideration of fundamental shoreline dynamics and processes (French et al. Citation2015; Ibe and Antia Citation1983). Comprehending the diverse forces driving shoreline recession-including their nature, orientation, and intensityis imperative to devise appropriate technical and non-technical interventions for combating beach erosion.
Conclusion
In conclusion, this study has meticulously examined changes along the shoreline of Ilaje in Nigeria, leveraging contemporary remotely sensed data and advanced analytical methods. The investigation has unveiled a pronounced landward shift in the shoreline across significant stretches of the Ilaje coast, resulting in the submergence of numerous communities and varying degrees of exposure to the associated threats. The prevalence of erosion along the Ilaje shoreline, coupled with observed variations in erosion and accretion along transects, underscores the urgency of addressing these challenges.
The insights garnered from this study hold significant implications for coastal zone planning and management, offering a solid foundation for addressing the multifaceted impacts of shoreline changes on human communities and ecological systems alike. While acknowledging that the findings are inconclusive, the study vividly portrays the persistent threats posed by coastal erosion and the alarming rates at which coastal land and ecological habitats succumb to the encroaching ocean. The urgency to mitigate the emerging ecological catastrophe in the region is evident, underscoring the critical importance of implementing proactive measures to safeguard vulnerable coastal areas and promote sustainable coastal development. This study thus serves as a clarion call for concerted action to attenuate the deleterious effects of shoreline changes and preserve the ecological integrity of coastal regions for future generations. Further studies that isolate and quantify the contributions of the different natural and anthropogenic factors will further deepen our understanding of the relevance of these factors. This knowledge can help fashion effective preventive and mitigation measures.
Disclosure statement
No potential conflict of interest was reported by the author(s).
Data availability statement
Data will be provided upon request.
References
- Adagbasa, E. G., and O. O. Ige-Olumide. 2014. Geospatial analysis of coastal flooding effect on soil and vegetation in Ilaje Local Government Area of Ondo State, Nigeria. Journal of Geospatial Science and Technology 1 (1):99–111. doi: 10.54222/afrigist/jgst/v1i1.6.
- Aghighi, H., J. Trinder, S. Lim, and Y. Tarabalka. 2014. ISPRS annals of the photogrammetry, remote sensing and spatial information sciences. Gottingen 2 (8):61–8. doi: 10.5194/isprsannals-II-8-61-2014.
- Aiello, A., F. Canora, G. Pasquariello, and G. Spilotro. 2013. Shoreline variations and coastal dynamics: A space-time data analysis of the Jonian littoral, Italy. Estuarine, Coastal and Shelf Science 129:124–35. doi: 10.1016/j.ecss.2013.06.012.
- Akinluyi, F. O., A. O. Adebola, and A. A. Adeseko. 2018. Assessment of shoreline and associated landuse/land cover changes along part of Lagos Coastline, Nigeria. Contemporary Trends in Geoscience 7 (1):59–70. doi: 10.2478/ctg-2018-0004.
- Alexandrakis, G., and S. E. Poulos. 2014. An holistic approach to beach erosion vulnerability assessment. Scientific Reports 4:6078. doi: 10.1038/srep06078.
- Ankrah, J., A. Monteiro, and H. Madureira. 2023. Shoreline change and coastal erosion in West Africa: A systematic review of research progress and policy recommendation. Geosciences 13 (2):59. doi: 10.3390/geosciences13020059.
- Ataol, M., M. M. Kale, and İ. S. Tekkanat. 2019. Assessment of the changes in shoreline using digital shoreline analysis system: A case study of Kızılırmak Delta in northern Turkey from 1951 to 2017. Environmental Earth Sciences 78 (19):1–9. doi: 10.1007/s12665-019-8591-7.
- Athanasiou, P., A. van Dongeren, A. Giardino, M. I. Vousdoukas, R. Ranasinghe, and J. Kwadijk. 2020. Uncertainties in projections of sandy beach erosion due to sea level rise: An analysis at the European scale. Scientific Reports 10 (1):11895. doi: 10.1038/s41598-020-68576-0.
- Ayadi, K., M. Boutiba, F. Sabatier, and M. S. Guettouche. 2016. Detection and analysis of historical variations in the shoreline, using digital aerial photos, satellite images, and topographic surveys DGPS: Case of the Bejaia bay (East Algeria). Arabian Journal of Geosciences 9 (1):1–12. doi: 10.1007/s12517-015-2043-9.
- Ayeni, B., and K. J. Samuel. 2014. An evaluation of digital elevation modeling in GIS and Cartography. Geo-Spatial Information Science 17 (2):139–44. doi: 10.1080/10095020.2013.772808.
- Benshila, R., G. Thoumyre, M. A. Najar, G. Abessolo, R. Almar, E. Bergsma, G. Hugonnard, L. Labracherie, B. Lavie, T. Ragonneau, et al. 2020. A deep learning approach for estimation of the nearshore bathymetry. Journal of Coastal Research 95 (sp1):1011–5. doi: 10.2112/SI95-197.1.
- Bidorn, B., K. Sok, K. Bidorn, and W. C. Burnett. 2021. An analysis of the factors responsible for the shoreline retreat of the Chao Phraya Delta (Thailand). The Science of the Total Environment 769:145253. doi: 10.1016/j.scitotenv.2021.145253.
- Boak, E. H., and I. L. Turner. 2005. Shoreline definition and detection: A review. Journal of Coastal Research 214 (4):688–703. doi: 10.2112/03-0071.1.
- Boak, E. H., and I. L. Turner. 2022. Shoreline definition and detection: A review shoreline definition and detection: A review. Journal of Coastal Research 214 (214):688–703. doi: 10.2112/03-0071.1.
- Bosello, F., and E. De Cian. 2014. Climate change, sea level rise, and coastal disasters. A review of modeling practices. Energy Economics 46:593–605. doi: 10.1016/j.eneco.2013.09.002.
- Carroll, R. 2008. Jamaican Pirates steal sand from public beach for construction. The Guardian. 20 October, 2008.
- Cellone, F., E. Carol, and L. Tosi. 2016. Coastal erosion and loss of wetlands in the middle Río de la Plata estuary (Argentina). Applied Geography 76:37–48. doi: 10.1016/j.apgeog.2016.09.014.
- Coelho, C., M. Lima, F. M. Alves, P. Roebeling, J. Pais-Barbosa, and M. Marto. 2023. Assessing coastal erosion and climate change adaptation measures : a novel participatory approach. Environments 10 (7):110.
- Molau, S. da M. A. F.. 2014. Detection and attribution of observed impacts. In Climate change 2014: Impacts, Adaptation, and Vulnerability. Part A: Global and Sectoral Aspects. Contribution of Working Group II to the Fifth Assessment report of the intergovernmental panel on climate change, eds. C. Field, V. Barros, D. Dokken, K. Mach, M. Mastrandrea, T. Bilir, M. Chatterjee, K. Ebi, Y. Estrada, R. Genova, B. Girma, E. Kissel, A. Levy, S. MacCracken, P. Mastrandrea, and L. White, 979–1037. Cambridge: Cambridge University Press.
- Danilo, C., and F. Melgani. 2019. High-coverage satellite-based coastal bathymetry through a fusion of physical and learning methods. Remote Sensing 11 (4):376. doi: 10.3390/rs11040376.
- Danladi, I. B., B. M. Kore, and M. Gül. 2017. Vulnerability of the Nigerian coast: An insight into sea level rise owing to climate change and anthropogenic activities. Journal of African Earth Sciences 134:493–503. doi: 10.1016/j.jafrearsci.2017.07.019.
- Dean, R. G., and C. J. Galvin. Jr. 1976. Beach erosion : Causes, processes, and remedial measures. C R C Critical Reviews in Environmental Control 6 (3):259–96. doi: 10.1080/10643387609381643.
- Department of Environment and Science.(2018). Preparing a shoreline erosion management plan: Guideline for coastal development (Version 2.01, EPP/2016/2087). Department of Environment and Science, Queensland Government. Retrieved from https://www.des.qld.gov.au/policies?a=272936/gl-cd-preparing-a-shoreline-erosion-management-plan.pdf
- Durowoju, O. S., A. O. Olusola, and B. W. Anibaba. 2017. Relationship between extreme daily rainfall and maximum daily river discharge within Lagos metropolis. Ethiopian Journal of Environmental Studies and Management 10 (4):492–504. doi: 10.4314/ejesm.v10i4.7.
- Durowoju, O. S., A. O. Olusola, and B. W. Anibaba. 2018. Rainfall-runoff relationship and its implications on Lagos Metropolis. IFE Research Publications in Geography 16 (1):25–33.
- Durowoju, O. S., T. E. Ologunorisa, and A. Akinbobola. 2022. Assessing agricultural and hydrological drought vulnerability in a Savanna ecological zone of Sub-Saharan Africa. Natural Hazards 111 (3):2431–58. doi: 10.1007/s11069-021-05143-4.
- Durowoju, O. S., T. E. Ologunorisa, and A. Akinbobola. 2023. Impact of drought on cereal crop yields in the Savanna region of Nigeria. African Geographical Review 42 (3):273–93. doi: 10.1080/19376812.2021.2024443.
- Duvat, V. K. E. 2019. A global assessment of atoll island planform changes over the past decades. Wiley Interdisciplinary Reviews: Climate Change 10 (1):1–16. doi: 10.1002/wcc.557.
- Eludoyin, O. S., T. Oduore, and A. A. Obafemi. 2012. Spatio-temporal analysis of shoreline changes in Bonny Island, Nigeria. Ethiopian Journal of Environmental Studies and Management 5 (2):123–130. doi: 10.4314/ejesm.v5i2.2.
- Escobar-Sánchez, G., M. Haseler, N. Oppelt, and G. Schernewski. 2021. Efficiency of aerial drones for macrolitter monitoring on Baltic Sea beaches. Frontiers in Environmental Science 8:1–18. doi: 10.3389/fenvs.2020.560237.
- Farah, A., and D. Algarni. 2014. Positional accuracy assessment of GoogleEarth in Riyadh. Artificial Satellites 49 (2):101–6. doi: 10.2478/arsa-2014-0008.
- Fashae, O. A., R. O. Obateru, E. G. Adagbasa, and C. C. Emeh. 2022. Community-based assessment of coastal erosion in Lagos, Nigeria. Natural Hazards 114 (3):3657–82. doi: 10.1007/s11069-022-05536-z.
- Ford, M. 2013. Shoreline changes interpreted from multi-temporal aerial photographs and high resolution satellite images: Wotje Atoll, Marshall Islands. Remote Sensing of Environment 135:130–40. doi: 10.1016/j.rse.2013.03.027.
- French, G. T., L. F. Awosika, C. E. Ibe, F. Lauderdale, and L. F. Awosika. 2015. Sea-level rise and Nigeria: Potential impacts and consequences. Journal of Coastal Research, SPRING 199 (14):224–42.
- Gibbs, A. E., L. H. Erikson, B. M. Jones, B. M. Richmond, and A. C. Engelstad. 2021. Seven decades of coastal change at Barter Island, Alaska: Exploring the importance of waves and temperature on erosion of coastal permafrost bluffs. Remote Sensing 13 (21):4420. doi: 10.3390/rs13214420.
- Goldstein, E. B., G. Coco, and N. G. Plant. 2019. Earth-science reviews. A review of machine learning applications to coastal sediment transport and morphodynamics. Earth-Science Reviews 194:97–108. doi: 10.1016/j.earscirev.2019.04.022.
- Gonçalves, G., U. Andriolo, L. M. S. Gonçalves, P. Sobral, and F. Bessa. 2022. Beach litter survey by drones: Mini-review and discussion of a potential standardization. Environmental Pollution (Barking, Essex: 1987) 315:120370. doi: 10.1016/j.envpol.2022.120370.
- Hagenaars, G., A. Luijendijk, S. de Vries, and W. de Boer. 2017. Long term coastline monitoring derived from satellite imagery. Proceedings of Coastal Dynamics 2017: Helsingør, Denmark, 1551–1562. Article Paper No. 122.
- Ham, Y., J. Kim, and J. Luo. 2019. Deep learning for multi-year ENSO forecasts. Nature 573 (7775):568–72. doi: 10.1038/s41586-019-1559-7.
- Hategekimana, Y., M. Allam, Q. Meng, Y. Nie, and E. Mohamed. 2020. Quantification of soil losses along the coastal protected areas in Kenya. Land 9 (5):137. doi: 10.3390/land9050137.
- Himmelstoss, E. A., R. E. Henderson, M. G. Kratzmann, and A. S. Farris. 2021. Digital shoreline analysis system (DSAS) Version 5.1 User Guide. U.S. Geological Survey Open-File Report 2021–1091:1–104. doi: 10.3133/ofr20211091.
- Ibe, A. C., and E. E. Antia. 1983. Preliminary assessment of the impact of erosion along the Nigerian shoreline. In NIORM Technical Paper No 13. http://hdl.handle.net/1834/1206
- Ikuemonisan, F. E., V. C. Ozebo, P. S. J. Minderhoud, P. Teatini, and M.-N. Woillez. 2023. A scoping review of the vulnerability of Nigeria’s rise coastland to sea-level rice and the contribution of land subsidence (284; AFD). https://www.afd.fr/en/ressources-accueil
- Jonah, F. E. 2015. Managing coastal erosion hotspots along the Elmina, Cape Coast and Moree area of Ghana. Ocean & Coastal Management 109:9–16. doi: 10.1016/j.ocecoaman.2015.02.007.
- Luijendijk, A., G. Hagenaars, R. Ranasinghe, F. Baart, G. Donchyts, and S. Aarninkhof. 2018. The state of the world’s beaches. Scientific reports 8(1):1–11. doi: 10.1038/s41598-018-24630-6.
- Martin, C., Q. Zhang, D. Zhai, X. Zhang, and C. M. Duarte. 2021. Enabling a large-scale assessment of litter along Saudi Arabian red sea shores by combining drones and machine learning. Environmental Pollution (Barking, Essex: 1987) 277:116730. doi: 10.1016/j.envpol.2021.116730.
- Masria, A., K. Nadaoka, A. Negm, and M. Iskander. 2015. Detection of shoreline and land cover changes around Rosetta Promontory, Egypt, based on remote sensing analysis. Land 4 (1):216–30. doi: 10.3390/land4010216.
- Matin, N., and G. M. J. Hasan. 2021. A quantitative analysis of shoreline changes along the coast of Bangladesh using remote sensing and GIS techniques. CATENA 201 (February):105185. doi: 10.1016/j.catena.2021.105185.
- Medina-Lopez, E., and L. Ureña-Fuentes. 2019. High-resolution sea surface temperature and salinity in coastal areas worldwide from raw satellite data. Remote Sensing 11 (19):2191. doi: 10.3390/rs11192191.
- Melet, A., P. Teatini, G. Le Cozannet, C. Jamet, A. Conversi, J. Benveniste, and R. Almar. 2020. Earth observations for monitoring marine coastal hazards and their drivers. Surveys in Geophysics 41 (6):1489–534. doi: 10.1007/s10712-020-09594-5.
- Mentaschi, L., M. I. Vousdoukas, J. F. Pekel, E. Voukouvalas, and L. Feyen. 2018. Global long-term observations of coastal erosion and accretion. Scientific Reports 8 (1):12876. doi: 10.1038/s41598-018-30904-w.
- Miller, J. K., and R. G. Dean. 2004. A simple new shoreline change model. Coastal Engineering 51 (7):531–56. doi: 10.1016/j.coastaleng.2004.05.006.
- Ogunjo, S. T., A. O. Olusola, I. A. Fuwape, and O. S. Durowoju. 2022. Temporal variation in deterministic chaos: The influence of Kainji Dam on downstream stations along lower Niger River. Arabian Journal of Geosciences 15 (3):1–11. doi: 10.1007/s12517-021-09297-0.
- Ohwo, O. 2018. Climate change impacts, adaptation and vulnerability in the Niger delta region of Nigeria. Journal of Environment and Earth Science 8 (6):171–9.
- Ologunorisa, T. E., O. S. Durowoju, and A. Akinbobola. 2021. Hydroclimatology of the Kaduna River Basin. American Journal of Climate Change 10 (3):353–69. doi: 10.4236/ajcc.2021.103017.
- Oloyede, M. O., A. B. Williams, and N. U. Benson. 2021. Simulated sea-level rise under future climate scenarios for the Atlantic Barrier lagoon coast of Nigeria using SimCLIM. IOP Conference Series: Earth and Environmental Science 665 (1):012068. doi: 10.1088/1755-1315/665/1/012068.
- Osanyintuyi, A. J., Y. H. Wang, and N. A. H. Mokhtar. 2022. Nearly five decades of changing shoreline mobility along the densely developed Lagos barrier-lagoon coast of Nigeria: A remote sensing approach. Journal of African Earth Sciences 194:104628. doi: 10.1016/j.jafrearsci.2022.104628.
- Pantusa, D., F. D. Alessandro, L. Riefolo, F. Principato, and G. R. Tomasicchio. 2018. Application of a coastal vulnerability index. A case study along the Apulian Coastline, Italy. Water 10 (9):1218. doi: 10.3390/w10091218.
- Pérez, D., K. Islam, V. Hill, R. Zimmerman, B. Schaeffer, and J. Li. 2018. Deepcoast: quantifying seagrass distribution in coastal water through deep capsule networks. Pattern Recognition and Computer Vision. PRCV 2018. Lecture Notes in Computer Science 11257:404–16. doi: 10.1007/978-3-030-03335-4_35.
- Phong, N. T., N. H. Quang, and T. V. Sang. 2022. Shoreline change and community-based climate change adaptation: Lessons learnt from Brebes Regency, Indonesia. Ocean and Coastal Management 218:106037. doi:https://doi.org/10.1016/j.ocecoaman.2022.106037
- Pilkey, O. H., and J. A. G. Cooper. 2012. “Alternative” shoreline erosion control devices: A review. In Pitfalls of shoreline stabilization, eds. J. Cooper and O. Pilkey. Dordrecht: Coastal Research Library, Springer. doi: 10.1007/978-94-007-4123-2_12.
- Premium Times. 2023. Ocean incursion: Ondo LGA seeks resettlement of riverine community. Premium Times. Retrieved from: https://www.premiumtimesng.com/news/594152-ocean-incursion-ondo-lga-seeks-resettlement-of-riverine-community.html
- Pucino, N., D. M. Kennedy, R. C. Carvalho, B. Allan, and D. Ierodiaconou. 2021. Citizen science for monitoring seasonal-scale beach erosion and behaviour with aerial drones. Scientific Reports 11 (1):3935. doi: 10.1038/s41598-021-83477-6.
- Punch Newspaper. 2018. FG, oil firms should save Aiyetoro from extinction—Ondo. Punch Newspaper:22–4. https://punchng.com/fg-oil-firms-should-save-aiyetoro-from-extinction-ondo-ex-commissioner/.
- Ragheb, A. E., and A. F. Ragab. 2015. Enhancement of Google Earth positional accuracy. International Journal of Engineering Research & Technology i 4 (1):627–30.
- Samuel, K. J., and R. E. Atobatele. 2019a. Change in administrative status, urban growth, and land use/cover in a medium-sized African city. Human Geographies – Journal of Studies and Research in Human Geography 13 (1):5–22. doi: 10.5719/hgeo.2019.131.1.
- Samuel, K. J., and R. E. Atobatele. 2019b. Land use/cover change and urban sustainability in a medium-sized city. International Journal of Sustainable Society 11 (1):13–28. doi: 10.1504/IJSSOC.2019.101961.
- Samuel, K. J., B. Ayeni, O. H. Adebayo, and E. G. Adagbasa. 2014. A geospatial analysis of flood risks and vulnerability in Ogun-Osun River Basin, Nigeria. In Landscape ecology and water management: proceedings of IGU rohtak conference, vol. 2, 307–320. Springer, Japan. doi: 10.1007/978-4-431-54871-3_22.
- Samuel, K. J., S. Yakubu, T. E. Ologunorisa, and A. Kola-Olusanya. 2017. A post-disaster assessment of riverine communities impacted by a severe flooding event. Ghana Journal of Geography 9 (April):17–41.
- Sekovski, I., F. Stecchi, F. Mancini, and L. Del Rio. 2014. Image classification methods applied to shoreline extraction on very high-resolution multispectral imagery. International Journal of Remote Sensing 35 (10):3556–78. doi: 10.1080/01431161.2014.907939.
- Sharaan, M., M. Iskander, and K. Udo. 2022. Coastal adaptation to sea level rise : An overview of Egypt’s efforts. Ocean & Coastal Management 218:106024. doi: 10.1016/j.ocecoaman.2021.106024.
- Shearman, P., J. Bryan, and J. P. Walsh. 2013. Trends in deltaic change over three decades in the Asia-Pacific region. Journal of Coastal Research 29 (5):1169–83. doi: 10.2112/JCOASTRES-D-12-00120.1.
- Shulz, K., R. Hansch, and U. Sorgel. 2018. Learning methods for remote sensing applications: An overview. Earth Resources and Environmental Remote Sensing/GIS Applications IX:1079002.
- Sierra, J. P., V. Gracia, M. García-León, and A. Sánchez-Arcilla. 2017. Green measures for Mediterranean harbours under a changing climate. Proceedings of the Institution of Civil Engineers - Maritime Engineering 170 (2):55–66. doi: 10.1680/jmaen.2016.23.
- Sierra, J. P., V. Gracia, X. Castell, M. Garc, C. Mösso, and J. Lin-Ye. 2023. Potential of transplanted seagrass meadows on wave attenuation in a fetch-limited environment. Journal of Marine Science and Engineering 11(6):1186.
- Song, Y., F. Liu, F. Ling, and L. Yue. 2019. Automatic semi-global artificial shoreline subpixel localization algorithm for Landsat imagery. Remote Sensing 11 (15):1779. doi: 10.3390/rs11151779.
- Thieler, E. R., E. A. Himmelstoss, J. L. Zichichi, and A. Ergul. 2009. The digital shoreline analysis system (DSAS) Version 4.0 - An ArcGIS extension for calculating shoreline change. (No. 2008–1278). US Geological Survey. Retrieved from Reston, VA: https://pubs.usgs.gov/publication/ofr20081278
- Toimil, A., P. Camus, I. J. Losada, G. L. Cozannet, R. J. Nicholls, D. Idier, and A. Maspataud. 2020. Earth-science reviews climate change-driven coastal erosion modelling in temperate sandy beaches : Methods and uncertainty treatment. Earth-Science Reviews 202:103110. doi: 10.1016/j.earscirev.2020.103110.
- Ülger, M., and Y. Tanrıvermiş. 2023. Prevention of the effects of coastal structures on shoreline change using numerical modeling. Ocean & Coastal Management 243:106752. doi: 10.1016/j.ocecoaman.2023.106752.
- UNDP. 2015. Sustainable development goals. In UNDP report. UNDP. doi: 10.1017/CBO9781107415324.004.
- UNGA. 2020. Global indicator framework for the sustainable development goals and targets of the 2030 agenda for sustainable development. Work of the Statistical Commission Pertaining to the 2030 Agenda for Sustainable Development, 1–21. https://unstats.un.org/sdgs/indicators/Global Indicator Framework after 2019 refinement_Eng.pdf%0Ahttps://unstats.un.org/sdgs/indicators/Global Indicator Framework_A.RES.71.313 Annex.pdf
- Vitousek, S., P. L. Barnard, P. Limber, L. Erikson, and B. Cole. 2017. A model integrating longshore and cross-shore processes for predicting long-term. Journal of Geophysical Research: Earth Surface 122 (4):782–806. doi: 10.1002/2016JF004065.
- Wernette, P., A. Shortridge, D. P. Lusch, and A. F. Arbogast. 2017. Accounting for positional uncertainty in historical shoreline change analysis without ground reference information. International Journal of Remote Sensing 38 (13):3906–22. doi: 10.1080/01431161.2017.1303218.