
Abstract
The Napo Basin in Ecuador is an important drainage of the Amazon Basin, the most biodiverse ecosystem for freshwater species. At the same time, this basin has conspicuous information gaps on its biodiversity patterns and human threats. Here, we estimated the diversity distribution patterns of freshwater vertebrates and invertebrates in the Napo Basin, as a tool for present and future management and conservation efforts. Also, we assessed the spatial congruence of the diversity patterns observed between aquatic vertebrates and invertebrates. For this, we compiled occurrence records for 481 freshwater vertebrate species (amphibians, birds, mammals, reptiles, and fish), and 54 invertebrate families obtained across an altitudinal gradient of the basin (200–4500 m). Using these occurrence records and environmental variables, we modeled the distribution of each vertebrate species and invertebrate family. Then, we stacked these distributions to build species richness maps for vertebrates, and a family richness map for invertebrates. We found that the most diverse areas for vertebrate species are the lowlands (<600 m), whereas richness of invertebrate families peaks at higher elevations (lower montane forests). Congruence among species richness patterns of the five vertebrate groups was high (r = 0.66), with fish being the best predictor for vertebrates (r = 0.78). However, congruence decreased at higher elevations (r = 0.14), suggesting that specific species or habitat-based approaches should be used in the highlands. Also, we found a high correlation between species and family richness of freshwater invertebrates (r = 0.66), suggesting that family richness of invertebrates could be used as a surrogate of species richness in this basin. We highlight this correlation because, at the watershed scale, it allows working with family groups where species-level taxonomy is challenging. Our results provide the first comprehensive representation of freshwater biodiversity patterns at high resolution in an Andean-Amazon basin, and calls attention to the need for incorporating different taxonomic groups when assessing diversity patterns. Given these different diversity patterns, conservation programs for this basin should incorporate both vertebrate and invertebrate groups as biodiversity indicators. Finally, our study provides a practical methodological guidance in the estimation of freshwater diversity in regions of scarce information with high conservation priority, such as the Andean-Amazon basins.
La cuenca del Napo es un drenaje importante de la cuenca del Amazonas, el ecosistema más biodiverso en especies de agua dulce. Sin embargo, esta cuenca presenta importantes vacíos de información sobre los patrones de biodiversidad y las amenazas humanas. Este estudio estima los patrones de distribución de la diversidad de vertebrados e invertebrados de agua dulce en la cuenca del Napo de Ecuador, evalúa la congruencia espacial entre dichos patrones de diversidad y discute las implicaciones de estos resultados en los esfuerzos actuales y futuros en el manejo y conservación de la cuenca. Para ello, recopilamos datos de presencia de 481 especies de vertebrados de agua dulce (anfibios, aves, mamíferos, reptiles y peces), y de 54 familias de invertebrados obtenidos en el gradiente altitudinal de la cuenca (200–4500 m). A partir de estos datos de presencia y de variables ambientales, modelamos la distribución de las especies de vertebrados y de las familias de invertebrados. Posteriormente, combinamos las distribuciones espaciales obtenidas para construir mapas de riqueza de especies de vertebrados, y de riqueza de familias de invertebrados. Encontramos que las tierras bajas (<600 m) son las áreas más diversas para vertebrados acuáticos, mientras que la riqueza de las familias de invertebrados tienen picos de riqueza en elevaciones más altas (bosque montano bajo). La congruencia espacial entre los mapas de riqueza de los cinco grupos vertebrados fue alta (r = 0.66), siendo el patrón de los peces el mejor indicador de riqueza (r = 0.78). Sin embargo, esta congruencia entre los vertebrados disminuye a medida que incrementa la elevación (r = 0.14), por lo que para la conservación en tierras altas son preferibles los enfoques basados en manejo de hábitat o en especies específicas. También se encontró una alta correlación entre la riqueza de especies y de familias de invertebrados de agua dulce (r = 0.66), lo que sugiere que la riqueza de la familia podría ser utilizado como sustituto de la de especies en esta cuenca; destacamos esta correlación ya que es difícil trabajar con taxonomía a nivel de especie de invertebrados a escala de cuenca. De esta forma, nuestros resultados proporcionan la primera representación de los patrones de biodiversidad de agua dulce a alta resolución en una cuenca andino-amazónicos y llama la atención sobre la necesidad de incorporar los diferentes grupos taxonómicos en la evaluación de los patrones de diversidad. Teniendo en cuenta estos diferentes patrones de diversidad, los programas de conservación en esta cuenca deben incorporar tanto los grupos de vertebrados e invertebrados como indicadores de biodiversidad. Por último, nuestro estudio proporciona una práctica orientación metodológica en la estimación de la biodiversidad de agua dulce en regiones de escasa información con alta prioridad de conservación, tales como las cuencas andino-amazónicas.
Introduction
Freshwater ecosystems are among the most speciose in the world.[Citation1] Globally, over 126,000 described species inhabit freshwater systems, including fish, mollusks, amphibians, reptiles, insects, plants, and mammals, all of them concentrated in less than 1% of the world’s surface area.[Citation1,2] However, freshwater diversity is highly threatened by human activities, including dams, water withdrawals, pollution, invasive species, and overharvesting.[Citation3] These impacts to freshwater biodiversity may also diminish the provision of freshwater ecosystem services, such as food security and nutrition, which are essential to human populations.[Citation4]
In order to implement conservation and management programs for freshwater groups, a better understanding of species distributions and diversity patterns is essential.[Citation5] For example, the identification of priority areas for freshwater biodiversity conservation requires information on the distribution of species and their levels of protection inside protected area networks.[Citation6] Similarly, the use of surrogates or biodiversity indicators, which facilitate the development of conservation programs, heavily rely on understanding how effectively one taxon predicts the species richness pattern of other taxa.[Citation7–9] Nevertheless, despite the conservation crisis for freshwater diversity, there is a lack of comprehensive, synthesized data about freshwater species distributions. As consequence of these information gaps in the freshwater biological knowledge, in the tropics terrestrial plants and vertebrates are usually used to direct conservation planning, whereas freshwater groups are overlooked.[Citation10] Also, these biodiversity indicators have been more intensely explored for guiding the management of terrestrial ecosystems, and there is still little experience in terms of their application to aquatic environments. Moreover, the longitudinal nature and the connectivity that characterizes river and stream ecosystems suggest that their effective management will require different levels of information (e.g. flow and inundation area) and the adaptation of planning tools that reflect the particularities of lotic ecosystems.
Although recent years have witnessed increased efforts to estimate the richness of freshwater vertebrate species at a global scale,[Citation6,11–13] the validity of these patterns at finer spatial scales is relatively unexplored.[Citation5] Moreover, the usefulness of this information to guide management and conservation interventions that are implemented at smaller geographical scales (i.e. watershed) is limited.[Citation6,13] In this context, a more effective management of river and stream ecosystems will require the development and adaptation of tools for gathering and interpreting information on the patterns of biodiversity of these ecosystems at scales that are relevant for integrative management.
The Napo River Basin, in the northern Ecuadorian Andes, is one of the main tributaries of the Amazon River basin,[Citation14] and offers a striking example of the ecological and socioeconomic complexities that make conservation of lotic ecosystems in the tropical Andes challenging.[Citation15] The Napo Basin is considered part of the most biologically diverse ecoregion in the world for freshwater fish, amphibians, birds, and mammals.[Citation6,11,12,16] In fact, this watershed harbors more than 560 fish species, a number that greatly exceeds the species richness of other large watersheds around the globe.[Citation17,18] This high diversity is possibly explained by the large altitudinal gradient (158–5890 m) that generates a great variety of climatic conditions.[Citation19] Also, there are unique habitats throughout the region such as productive flooded forests, oxbow lakes, black, clear and white water streams, which promote higher fish diversity and endemism.[Citation16,18,20]
Despite its biological importance, the Napo Basin is subject to a wide array of human-induced threats. In recent decades, there has been an important increase in human land use and extractive practices in the basin,[Citation21] which are threatening its long-term viability, the integrity of its biodiversity, and the ecosystem services that multiple human populations derive from this region.[Citation22] Specifically, this basin is exposed to numerous impacts caused by hydroelectric projects, oil extraction, copper and gold mining, timber extraction, extensive agriculture and cattle ranching.[Citation15,19,21,23–25] At the same time, the basin lacks systematic information about its freshwater species distributions and diversity patterns, an information gap that hinders adequate conservation and management initiatives.
A systematic analysis of freshwater diversity in a tropical basin presents substantial challenges. First, high-quality information on the spatial distribution of species is difficult to compile and, typically, this information is incomplete and spatially biased to the most accesible areas.[Citation26,27] Therefore, instead of using spatially biased data, it is advisable to spatially model freshwater species distributions using observed locality data and environmental variables.[Citation28] This technique is known as distribution or habitat modeling, and has been used in numerous studies to address sampling bias, data sparseness, and to characterize species richness and distribution for a great variety of groups.[Citation29,30]
Entire taxonomic groups that are speciose and sensitive to human impacts are regularly ignored in diversity studies.[Citation31] Ideally, an accurate estimation of freshwater diversity patterns should include both vertebrate and invertebrate taxa because they may have different diversity patterns.[Citation1,2,31] However, typically, adequate data on the diversity of most invertebrate groups in tropical freshwaters do not exist.[Citation1] Therefore, the second challenge to study the freshwater diversity in the Napo Basin is the incorporation of freshwater invertebrate taxa, which requires invertebrate inventories across a broad altitudinal gradient. Moreover, considering the high species diversity of invertebrates in the tropics and the large size of the Napo Basin, taxonomic identifications at the species level are costly in terms of money, human effort, expertise, and time.[Citation32] Instead, family-level identification for invertebrates is more efficient, and problems such as under-sampling and erroneous identifications are greatly reduced, increasing the reliability and robustness of the patterns revealed.[Citation33] Nevertheless, for conservation planning in the Napo Basin, the validity of aquatic invertebrate family richness patterns as a proxy for species diversity patterns must be evaluated.[Citation32]
In this context, by using the Napo Basin in northeastern Ecuador as a case study, this research aims to provide a model for characterizing freshwater biodiversity patterns for large Andean-Amazon basins. Specifically, we explore the use of spatial distribution modeling to describe the diversity patterns for both freshwater vertebrate and invertebrate groups. We also assess the congruence of diversity patterns observed among freshwater vertebrate taxa and between two different taxonomic levels of invertebrate fauna (family and species). The ultimate goal of these analyses is to identify taxonomic groups that can‘t act as surrogates for characterizing biodiversity patterns for conservation.[Citation5] Our study provides methodological guidance for the estimation of freshwater diversity in assemblages that exhibit high species richness and heterogeneity in terms of the species dependency on fluvial aquatic ecosystems. Finally, our study discusses implications for conservation planning of fluvial ecosystems, especially along altitudinal gradients in Andean-Amazon watersheds.
Methods
Study area
This study was carried out in the 59,573 km2 Napo Basin in North-eastern Ecuador (Figure (a)). Although the Napo Basin extends beyond the international borders of Ecuador (to Perú and Colombia), for the remainder of this paper we use ‘Napo Basin’ to refer only to the Ecuadorian portion of this watershed. The digital information of the limits and configuration of the Napo Basin was obtained from the Instituto Geográfico Militar del Ecuador.[Citation34]
Figure 1. Study area, the Napo Basin in Ecuador. (A) Altitudinal gradient, main rivers, floodplains systems, and some main rivers and cities in the basin. (B) Location of all vertebrate species records obtained from museum databases and online data-sets, and (C) sampling localities surveyed for freshwater invertebrates and amphibians during this study.
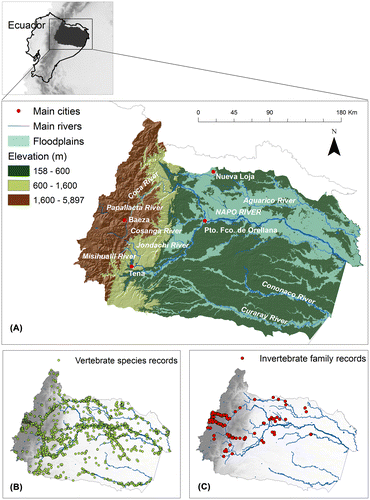
The Napo Basin in Ecuador comprises an altitudinal gradient of more than 5000 m, with thousands of streams and rivers that run through 25 ecosystems.[Citation35] The majority of large rivers in the lower Napo Basin (e.g. Napo, Coca, Tiputini, Yasuní, and Curaray) are ‘white waters rivers’,[Citation36] that drain extensive territories in the Andean mountains and gather large amounts of sediments, which result in the murky and alkaline nature of these rivers.[Citation10] The lower Napo Basin also harbors a smaller number of acidic ‘blackwater’ rivers, which originate in lowland swamps and flooded forests and owe their tea-like appearance to humic acids and other tannic and organic compounds released during decomposition of leaf litter in these forests.[Citation10] In contrast to the lower part of the basin, a vast number of smaller streams and fast rivers of stony substrate, drain the upper reaches and have clear and well-oxygenated water that tumble down the steep slopes of the Andes.
Given the large altitudinal gradient and different ecological formations of our study area, we classified the Napo Basin into three main altitudinal zones to facilitate the discussion and interpretation of results: lowlands (<600 m), lower montane forests (600–1600 m), and upper montane forests ecosystems (1600–5897 m). Although this classification is relatively arbitrary, we used these ranges to reflect the very different topography that characterizes these altitudinal zones and influences their aquatic biota. The upper montane forest (which in this case includes the páramo ecosystems) is characterized by complex topography and steep slopes, with fast running rivers and streams that cut deep canyons through the mountains. The lower montane forests coincide with the area where the slopes of the Andes recede and the rivers become bigger and wider as they approach the Amazonian plain. Finally, the lowland forests are characterized by relatively flat terrain and large, slow-moving rivers that are loaded with sediments eroded from the Andes.
Freshwater biodiversity data
We considered as freshwater fauna the following taxa: (i) species that are fully aquatic during their entire life cycle (e.g. riffle beetles, and fish), (ii) species that depend on streams, rivers, ponds, or lakes at least in one life-history stage (e.g. aquatic larvae of otherwise terrestrial amphibians or invertebrates), and (iii) species with preference for aquatic habitats for feeding, nesting, and breeding (e.g. ducks and egrets).
To assess freshwater vertebrate diversity, we included records from amphibians, birds, mammals, reptiles, and fish. For all these species, we collected presence data from museum databases (MZUTI: Museo de Zoología, Universidad Tecnológica Indoamérica, Ecuador) and online data-sets,[Citation37–39] books, and scientific papers (see Appendix S1 in supplementary data for a list of the references). As result, a total of 20,261 records for 481 freshwater vertebrate species were included in our study (Figure (b)), corresponding to 10 mammals, 19 reptiles, 93 amphibians, 138 birds, and 221 fish (see Appendix S2 for a list of the species included). These data represent 83% of freshwater species of mammals,[Citation40,41] 60% of reptiles,[Citation42] 90% of birds,[Citation42,43] 74% of amphibians,[Citation44–46] and 40% of fish [Citation17,20] reported for the Napo Basin.
In addition to locality data from the literature, we collected new data on amphibians and aquatic invertebrates during field surveys covering an elevational gradient from 218 to 4246 m in the Napo the basin (see EVOTRAC [Citation47] and PEER [Citation48] projects). Amphibians were sampled along streams at 200 m elevation intervals, when possible; two researchers sampled each stream once during three-to-four hours per night and collected individuals were identified to the species level at the MZUTI. For invertebrates, a total of 134 streams were sampled along the elevation gradient in the Napo Basin (Figure (c)). At each stream site, we collected five Surber samples and one D-net sample (500 uM mesh) for 5 min. Samples were sorted and classified in the Aquatic Ecology Laboratory of Universidad San Francisco de Quito (LEA-USFQ). Given our large number of samples, the high diversity, and taxonomic complexity of aquatic invertebrate in the tropics, all specimens were classified to the family level, resulting in 54 families (50 insect families and four non-insect families; see Appendix S2 in supplementary data for a list of the families collected) with more than five unique records in the basin. All specimens are housed at MZUTI (Patente No. 010–2015-FAU-DPAP-MA).
Modeling freshwater biodiversity patterns
The diversity patterns of freshwater fauna in the Napo Basin were analyzed using species richness for vertebrates and family richness for invertebrates.[Citation5] To calculate species richness for vertebrates, we first estimated their geographic distributions, using Species Distribution Models (SDMs).[Citation49] SDM is a technique that generalizes the empirical relationships between species occurrences and underlying habitat conditions, to predict the probability of species occurrence within a given area. To construct SDMs, we used Maxent, a machine-learning algorithm based on the principle of maximum entropy.[Citation50] Maxent is an adequate technique for our goal because it performs adequately when modeling presence-only occurrence data with low sample sizes, and with moderate errors in their georeferencing.[Citation29,51,52]
In the case of invertebrates, for each sampling site, we estimated the number of invertebrate families. However, the relationship between family richness and environmental variables was problematic to model, probably because of the diverse ecological requirements of species within each of the 54 families. Therefore, we modeled the geographic distribution of each family using Maxent, producing an equation that relates the family occurrences and the corresponding environmental variables. This approach has some limitations, such as treating a family as a biological unit, when in reality, species are actually the biological units that interact and evolve a given ecological niche.[Citation49] However, predicting the geographic distributions of a supraspecific monophyletic taxa has been carried out by other studies [Citation53–55] based on the fact that ecological niches are attributes of supraspecific clades, as result of a composite function of the niches of its constituent species. In the case of the Napo Basin, it has been reported that several invertebrate families and even orders show clear diversity patterns related to environmental variables such as altitude and water temperature,[Citation33,56] facilitating the modeling of these supraspecific taxa.
Vertebrate species and invertebrate families with five or more unique data records in the Napo Basin were modeled.[Citation57,58] As environmental predictors, we selected a set of 16 variables related to climate, topography, hydrology, and landscape, at ~0.5 km2 of resolution, hypothesized to influence the distribution of the freshwater species at a regional scale (Table ).
Table 1. Environmental data layers used in the species and family distribution models.
For vertebrates, we had to implement two main modifications in the modeling process according to the different levels of dependence of species to water bodies. The first modification was the use of different sets of environmental variables. The distribution of obligate freshwater species (such as fish and some mammals) is strongly influenced by the characteristics of the basins because they are confined to freshwater environments and are unable to move by land or air.[Citation5,13] Thus, to model these species we included three variables related to microbasin characteristics such as flow accumulation, density of drainage, and drainage size. However, birds, amphibians, and semiaquatic mammals are able to disperse overland, and, therefore, are less dependent on basin conditions.[Citation5] For these species, the modeling protocol excluded the three variables related to microbasins, resulting in biologically relevant SDMs.
The second modification in the construction of the vertebrate SDMs was the generation of different background sets. To represent the range of environmental conditions in the modeled region, background data are constructed, which usually consists of 10,000 random points in the study area.[Citation59] Instead, species occurrence records in the Napo Basin are biased towards main river courses, which are easily navigable and usually near urban centers (Figure ). These sampling differences between the species occurrence and random background leads to inaccurate models for birds and amphibians since the distribution of several of these species are not restricted to the main rivers.[Citation59–61] To solve this problem, SDMs for birds and amphibians were constructed using their presence localities as background data. Thus, these backgrounds reflect the same sample selection bias as the occurrence data, improving the performance of the SDMs.[Citation59–61] In contrast, for fish, mammals, reptiles, and invertebrates that have a naturally high diversity of species in the main watercourses, the use of a background with 10,000 random points across all the Napo Basin was more appropriate. For invertebrates, we excluded the size and water accumulation of microbasins from the modeling because these variables showed low variability among sampling sites, biasing the family distribution models for the invertebrate families.
The distribution models were developed with Maxent 3.3.3e,[Citation62] setting the convergence threshold to 10−5, maximum iterations to 500, and the regularization parameter to ‘auto’. Given the large number of species in this study, we did not remove highly correlated variables, allowing Maxent to choose the most informative variables among all predictors for modeling each species. Also, we were not interested in explaining the importance of the environmental predictors for each species, which is the aspect that could be affected when correlated variables are included.[Citation63,64] For vertebrate species, we reclassified the 0.0–1.0 distribution model maps into binary (presence/absence) maps using the Maximum Training Sensitivity Plus Specificity threshold, which minimizes the false-presence errors.[Citation65] For invertebrates, we reclassified the models with the ‘Minimum Training Presence’ threshold, which ensures that all records collected in the field for each family are included as presences in its binary distribution map. As a control measure of the modeling performance, we employed the AUC statistic (Area under ROC curve), which was calculated using 10-fold cross-validation.[Citation66] Also, we compared the resulting models with the species distributions reported in the literature [Citation40,41,43,67] and with the expert opinion in the case of fish species. Thus, when necessary, we removed areas of overprediction and areas beyond geographic barriers that are likely to preclude species dispersal.[Citation68]
Finally, we generated vertebrate species richness maps, which show the number of species by ~0.5 km2. These maps were produced by summing all individual binary SDMs for all species and for each vertebrate species group. Similarly, for freshwater invertebrates we added all the family distribution models to obtain a family richness map. Also, we used analyses of variance and Tukey HSD to test differences in vertebrate and invertebrate richness among the three elevation levels.
Congruence of freshwater biodiversity patterns
We explored congruence among diversity patterns of the five vertebrate groups using pairwise Spearman correlation coefficients. We calculated the correlation between the numbers of species in each pixel from the species richness maps of the five vertebrate groups. We also analyzed congruence separately for each of the three elevation levels (lowlands, lower montane forests, and upper montane forests) to assess if the importance of a species group as a surrogate may change with elevation. Since these analyses invoked a large number of tests (10 correlations within each altitudinal zone), we used a Bonferroni correction and considered significant only those correlations for which p < 0.05/10 = 0.005. In addition, considering that pixels within a richness map could be spatially autocorrelated, to test for significance of the correlation analyses we used a modified t-test, which calculates an effective number of degrees of freedom due to spatial autocorrelation.[Citation69]
We also examined the validity of using families of invertebrates as surrogates for species diversity patterns. For this, we classified invertebrates to morphospecies for 26 samples located between 1700 and 4250 m. Then, through a Pearson analysis we correlated the number of families and the number of species found in each sample site. In this case, a positive and significant correlation could allow us to analyze the correlation level between the diversity patterns of invertebrate families and vertebrate species.
In order to ensure the reliability of our data for conservation purposes, the correlation level among the vertebrate groups and between the taxonomic levels of the invertebrate should be more than r = 0.5.[Citation5,9]
Results
Diversity pattern for freshwater biodiversity
Distribution models of the 418 vertebrate species and 54 invertebrate families were acceptable in regard to AUC values (all > 0.7).[Citation66] Average AUC values varied among groups: invertebrates (0.95, SD 0.03), fish (0.95, SD 0.07), birds (0.92, SD 0.07), mammals (0.92, SD 0.07), reptiles (0.87, SD 0.07), and amphibians (0.82, SD 0.07) (see Appendix S2 and S3).
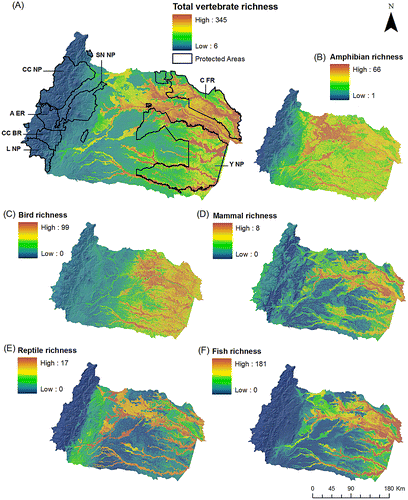
The lowlands of the Napo Basin were inferred to be the most diverse area for vertebrates (F(2, 255367) = 80,309, p < 0.0001; Tukey HSD test p < 0.0001, Figure 2a). Within this altitudinal zone, the highest species richness is found in large microbasins with large drainage area and water accumulation, as well as in flooded forests. In addition, several poorly known rivers such as the Cononaco, Nashiño, and Ashmahuayacu, for which we had no information or few records, appear as potentially diverse areas for vertebrate species.
Similar to the general vertebrate diversity pattern, fish, reptiles, and mammals had diversity peaks in the main rivers, whereas the richest areas for birds and amphibians were less restricted to these water courses (Figure (b–f)). Also, species richness of fish, the most diverse group of the vertebrates in the Napo Basin, was highest in the lowlands with a steep decrease at elevations >600 m. In contrast, the other groups have several species distributed at higher elevations.
Figure 2. Species richness for freshwater vertebrates in the Napo Basin. Species richness maps were obtained from the summation of the species distribution models of (A) all species, (B) amphibians, (C) birds, (D) mammals, (E) reptiles, and (F) fish. Main state protected areas in the Napo Basin are: Yasuní National Park (Y NP), Cuyabeno Faunistic Reserve (C FR), Cayambe Coca National Park (CC NP), Sumaco Napo-Galeras National Park (SN NP), Antisana Ecological Reserve (A ER), Colonso-Chalupas Biological Reserve (CC BR), and Llanganates National Park (L NP).
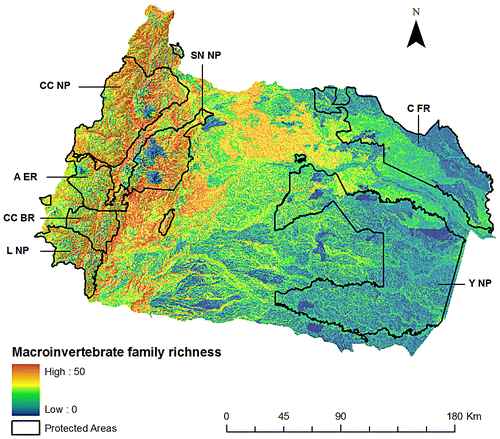
Contrary to the patterns observed for vertebrates, areas between 1100 and 1900 m concentrate pixels that have high richness of invertebrate families (Figure ). Similarly, and according to the altitudinal levels, the lower montane forest were the most rich in families (F(2, 255367) = 43,190; p < 0.0001; Tukey HSD test p < 0.0001). Specifically, the orders of Coleoptera, Diptera, Ephemeroptera, and Trichoptera, had their diversity peaks at higher elevations. Other orders (i.e., Odonata, Megaloptera, and Hemiptera), however, are more diverse in lowland areas.
Figure 3. Family richness for freshwater invertebrates in the Napo Basin. This map was obtained from the summation of 54 invertebrate family distribution models. Main state protected areas in the Napo Basin are: Yasuní National Park (Y NP), Cuyabeno Faunistic Reserve (C FR), Cayambe Coca National Park (CC NP), Sumaco Napo-Galeras National Park (SN NP), Antisana Ecological Reserve (A ER), Colonso-Chalupas Biological Reserve (CC BR), and Llanganates National Park (L NP).
Congruence of the freshwater biodiversity patterns
In the Napo Basin, spatial pattern of species richness of freshwater vertebrates are significantly correlated across the five vertebrate taxa, with mean correlation values generally high (r = 0.66, SD 0.11, Table ). On average, fish have the highest level of correlation with the other vertebrate groups (r = 0.78, SD 0.03), although correlation with birds was not significant (p > 0.005). In contrast, birds and mammals have the lowest average correlation coefficients with other groups of freshwater vertebrates (r = 0.61, SD 0.12; r = 0.61, SD 0.10, respectively).
Table 2. Correlation tests for species richness between pairs of freshwater vertebrate taxa in the entire Napo Basin and by altitudinal zone.
Correlation of richness patterns among vertebrate species groups decreases as the altitude increases (Table ). In the lowlands, species richness patterns had the highest correlation values (r = 0.58, SD 0.18), followed by montane forests, where correlation is moderate (r = 0.39, SD 0.19). In the streams and rivers of the upper montane forests, the average correlation is very week (r = 0.14, SD 0.36), as well as pairwise correlations between groups (r < 0.3).
For the 26 water sampling sites between 1700 and 4250 m, species richness of freshwater invertebrates was highly correlated with family richness (r = 0.66, p < 0.05). Finally, we found an insignificant negative correlation between diversity patterns for invertebrate families and vertebrate species, (r = −0.33, p = 0.32).
Discussion
Studies focused on freshwater diversity patterns are a vital foundation for natural resource management and conservation in tropical basins.[Citation10] In Andean-Amazon basins, these studies have been scarce, probably because the difficulty of addressing its great diversity in species and explore the different environments of the region. Here, based on biological records and spatial modeling techniques, we generated comprehensive information in high resolution on the freshwater biodiversity patterns in the Napo Basin in an effort to facilitate conservation and management of the large basins that constitute the headwaters of the Amazon river.
Freshwater biodiversity patterns
Our study uncovers patterns inferred from an extensive collection of freshwater taxa records (481 vertebrate species and 54 aquatic invertebrate families), representing approximately 60% of the known freshwater species of amphibians, birds, mammals, reptiles, and fish in the Napo Basin. We decided to include species with different levels of freshwater dependence because (i) all freshwater species, whether or not they are confined to aquatic environment, are affected by human pressures to these ecosystems, and (ii) this set of species also reflects the interconnectedness between aquatic ecosystems and the terrestrial environments that they drain. We also made efforts to incorporate information from the entire basin, a challenging task given its notable area and altitudinal gradient, as well as from organisms with different ecological requirements and evolutionary trajectories (vertebrates and invertebrates). Thus, our biological dataset is unique and provides useful insights into the diversity patterns of the region.
Based on distribution models, we found that for all vertebrates (amphibians, birds, mammals, reptiles, and fish), species richness was highest in the lowlands (<600 m), decreasing consistently throughout the mid-range, and high-altitude ecosystems, whereas the richness of invertebrate families has its highest value at middle elevations (lower montane forest). These contrasting patterns of diversity among vertebrate and invertebrate groups are remarkable and have important consequences for the ecology and management and of tropical basins with large altitudinal gradients. Potential explanations are manifold, but we suggest that an important factor explaining these contrasting patterns might be related to different levels of spatial heterogeneity that vertebrate and invertebrate groups experience along the watershed. Given the short lifespan of aquatic invertebrates and their relatively limited dispersal capabilities, the steep environmental gradients that predominate in the Andean slopes, might have favored aquatic invertebrate speciation at mid-range altitudes.[Citation70] Moreover, considering the small size of invertebrates, larger rivers and low topographic variation in the lowlands could represent a relatively homogeneous environment, with limited opportunities for speciation. Also, the low invertebrate diversity in the lowlands could be due to physical and chemical properties of water, such as low pH, high water temperatures, low dissolved oxygen content (because of low turbulence and consumption generated by organic matter decomposition), presence of suspended solids, high clay content in sediments, and high disturbance as a consequence of water flood pulses.[Citation70–72] At much higher elevations (>3600 m), the diversity of invertebrate family decreases, probably because of low temperatures in general, high daily variation in temperature,[Citation56,70] and the diminution in oxygen saturation that could affect the long-term viability of the invertebrate species.[Citation73]
Large vertebrates frequently experience the landscape at a much larger spatial scale than aquatic invertebrates and, given their longer life spans and relatively better dispersal capabilities they exploit a diversity of environments created by the dynamic nature of lowland rivers and their floodplains.[Citation74] Moreover, higher diversity of vertebrates in the lower altitudes might be a direct consequence of the higher productivity of these systems,[Citation5,75,76] especially in the form of allochthonous organic matter from the terrestrial ecosystem.[Citation77,78] Additionally, it has been suggested that, compared to the Andes, the lowlands have experienced longer periods of time of comparatively stable climates, favoring species diversification under competitive pressures.[Citation79] Lowlands usually encompass large geographical areas (large rivers and basins) and exhibit high environmental heterogeneity at larger spatial scales (i.e. Varzea and Igapó forests, rivers and lagoons) and also temporal scales (due to flood-pulse dynamics), favoring allopatric speciation of larger groups.[Citation5,10,80] This fact is especially important for fish species, which are restricted to river channels, whereas other taxa have varying abilities to colonize other river systems by land or air.[Citation5,13] Thus, the high diversity of vertebrates is concentrated in the large rivers at lowlands and flooded zones, whereas in montane forests, where rivers and basins are too small and homogeneous (at a river scale) for most vertebrates, their diversity drastically decreases. There are, of course, exceptions to these patterns; for example, small vertebrates such as glass frogs are adapted to small montane streams and have their richness peak at middle elevations.[Citation81]
Congruence of biodiversity patterns for freshwater taxa
Species diversity patterns in the Napo Basin are relatively similar among freshwater amphibian, birds, mammals, reptiles, and fish. Specifically, fish have the best congruence with other vertebrate groups, which means that, in this basin, this taxon is the best option as a surrogate for freshwater vertebrate conservation efforts that are focused on richness indicators (caution should be taken when using fish as surrogate for freshwater birds since the correlation was high, but not significant). Since fish are restricted to the water bodies, their distributions could represent a common place to find other freshwater taxa with broader distributions. However, this pattern is not captured in larger scale studies. For example, according to Tisseuil et al. [Citation5], at a global scale fish are the group with the lowest species richness congruence. These different results between our work and Tisseuil et al. [Citation5] highlight the importance of studying the diversity patterns at a more detailed scale when conservation planning is carried out at finer spatial resolutions.
We also found that congruence of species richness among vertebrates became weaker with an increase in altitude. For example, within the upper montane forests, all correlations between species groups were significantly lower. Thus, it seems that for specific conservation plans within the upper montane forests it is not adequate to use a single species group as a surrogate and, instead, species-specific or habitat focused approaches are suggested as an alternative.[Citation9]
Since species are the basic unit for biodiversity conservation, it is important to assess if invertebrate family richness pattern could be used as a surrogate for species diversity in the Napo Basin. Although several studies have generally concluded that the number of higher taxa is often strongly correlated with species richness,[Citation32,82–84] in Ecuador this relation for invertebrates has not been well studied.[Citation33] Our results suggest that, across a large altitudinal gradient in the high montane elevational zone in the Napo Basin, freshwater invertebrate family richness is highly correlated with species richness. Thus, family level data could be used as surrogate of species in biodiversity assessments in the higher elevation portion of the Napo Basin, when the objective is to examine biodiversity patterns and to rank sites according to their conservation value.[Citation9] Also, this high correlation allowed us to directly compare the distribution patterns found between vertebrates and invertebrates. We conclude that middle altitudes in the Napo Basin are the richest areas for the invertebrate species, while vertebrate species diversity is low. Given the differences in diversity patterns of vertebrates and invertebrates it is clear that both groups should be incorporated as biodiversity indicators when assessing patterns and defining conservation priorities.[Citation7]
Methodological considerations
There are some important methodological aspects of our study worth highlighting. First, there are several studies focused on understanding freshwater diversity patterns at regional scales using modeling techniques, but usually these studies focus on one species group (usually fish). In contrast, we made an effort to incorporate taxa representing different levels of water dependence, and modeled their distributions through the use of different sets of the environmental variables and background data. Second, our work offers a good example of how to estimate diversity patterns in a region with scant information about aquatic systems. Since the Napo Basin has a large drainage density, important physical and chemical parameters for rivers (and thus for freshwater organisms) such as pH, dissolved oxygen, temperature, and sediment, were not available. However, we included surrogate information like the geomorphology and ecosystem types, which accurately describe the location of aquatic environments such, as varzea (whitewater) and igapó (blackwater) forests. These types of environments have different values for the parameters mentioned above and, therefore, influence the diversity of aquatic species in the Amazonian region.[Citation79] Similarly, the river flow or river discharge flow is a major determinant of physical habitat in streams, which in turn influences biotic composition.[Citation85] However, measures of river flow across the entire Napo Basin are scarce. Instead, variables used in our study such as slope, flow accumulation, topographic curvatures, and precipitation can be used as surrogates or indicators of different levels of stream and river flow at the basin scale.[Citation86,87] Third, despite of the difficulty of including invertebrate species in a freshwater diversity pattern analysis, the family information offers an alternative for studying this important and taxonomically complex group. Therefore, we opted for generating family distribution maps employing the principles of the species distribution models. Despite the limitations of this approach, we obtained a detailed family richness map that closely matched with observed patterns in the field, allowing us to visualize and compare with confidence the differences between the diversity patterns of freshwater invertebrates and vertebrates.
The spatial modeling of distributions has some limitations that are important to mention. We identified several sites of high richness for vertebrate species and invertebrate fauna in the Napo Basin, but this is a pattern based entirely on environmental variables; thus, it is possible that some diverse areas no longer have habitat to protect as a consequence of human activities (see more below). For example, areas nearby large lowland cities (Coca, Nueva Loja) are heavily deforested, with a strong presence of the oil industry and human settlements. Thus, for conservation programs it is important to take into account the current condition of ecosystems.
On the other hand, many remote areas of the Napo Basin remain poorly explored in terms of biological inventories and, therefore, the set of environmental conditions of these areas could be under-represented in the species occurrence data used in our study. Although the spatial modeling may help reduce the impact of sampling bias, in some cases, this bias may result in species distribution models that are too restricted, with false species absences in under-represented areas that could affect the accuracy of species and family richness maps. Thus, it is possible that some remote areas of the Napo Basin identified as poor vertebrate and invertebrate diversity (such as those areas with zero species or families in Figures and ) may actually have higher richness. However, other types of data available for highly diverse areas such as observed points or geographic ranges, usually produce greater errors (both false species absences and presences).[Citation26,88] Despite these limitations, the spatial distribution modeling is recommended over other approaches for understanding the diversity pattern in tropical regions with poor accessibility.[Citation89]
Implications for conservation planning
Our study emphasizes the need of including different faunal groups for conservation planning. In fact, the low congruence between groups is interesting because it suggests that there are different hotspots of freshwater diversity along the basin. Invertebrates, for example, had higher diversity at mid elevations; therefore, conservation plans should include fluvial corridors along altitudinal gradients to increase the probabilities of sustaining this biological diversity in the long term. Interestingly, these mid-elevation rivers and streams in the Andean-Amazon regions are probably one of the most threatened aquatic ecosystems in this region, specially due to the construction of hydropower dams [Citation25] that are still erroneously considered by local governments, as environmentally friendly energy projects.[Citation90]
Other groups like fish, were not necessarily diverse at mid altitudinal ranges, but might have high levels of endemism.[Citation91] Moreover, fluvial corridors in the Tropical Andean regions have proven to be critical for annual long-term migration for hundreds of fish species (e.g. Prochilodus nigricans, Pseudoplatystoma spp., Brachyplatystoma spp.) that spawn in higher altitudes in the foothills of the Andes.[Citation15] Similarly, certain groups of amphibians have been proven to have higher diversity at mid-elevation ranges,[Citation81] highlighting the importance of altitudinal corridors in these watersheds. In the Napo, specifically, there are several protected areas (Figures (a) and (a)) that comprise large altitudinal gradients and should be managed specifically for the conservation of these species. The Cayambe-Coca National Park, Antisana Ecological Reserve, Sumaco Napo Galeras National Park, Llanganates National Park, and the new Colonso-Chapulas Biological Reserve [Citation92] are some of these areas. Although there are still questions about the efficiency of the management of these protected areas, their conservation value is extremely important. Moreover, even though these areas were not necessarily chosen for the protection of freshwater ecosystems and diversity, their protection could improve the conservation of unique and different freshwater habitats along these Andean-Amazon basins.
For all the other freshwater groups (fish, amphibian, reptiles, birds, and mammals) the lower Napo Basin had the highest diversity; of special relevance are the main stems of the Napo, the Aguarico, the Cononaco, and the Curaray (Figures and (a)). The Napo, Tiputini, Aguarico, and Shushufindi rivers in the northern corner of the Napo Basin, have the highest values of freshwater mammals, amphibians, and fish. These areas, although admirably iconic for their diversity,[Citation93] are subject to great pollution threats.[Citation94] Oil extraction since the 1970s have had large impacts, especially in the form of oil spills in hundreds of hectares of lowland Amazonian soils and water courses.[Citation95–98] The direct impact that oil spills have had on the biodiversity of the Napo Basin has not been properly quantified. Additionally, these lowland areas are experiencing a high rate of agricultural and urban expansion; and this by itself is intensifying the pressure on natural resources (i.e. organic and chemical pollution). Wildlife hunting and artisanal fishing is not well regulated,[Citation99] and, consequently, some of the most charismatic fauna are already very uncommon and the most abundant groups are becoming decimated by these practices.[Citation100] Although anthropogenic threats go beyond the scope of this paper, it is important to take into account that some areas might have already lost some of that incredible diversity predicted for these areas in this study. Nevertheless, the lowland forests in the Napo have large extensions within two protected areas (Cuyabeno Faunistic Reserve and the Yasuní National Park; Figure (a)), which hopefully will provide the core for the protection and restoration of the rich biodiversity of the lower portion of this watershed.
Finally, these freshwater diversity distribution maps provide a first step necessary for conservation planning of freshwater ecosystems in an Andean-Amazon watershed. For instance, with the information presented in our study, it is now possible to perform a formal conservation gap analysis for freshwater faunal diversity, which is essential to the creation of new conservation areas that increase the representation of biodiversity in the reserve systems of Ecuador.[Citation101] In this context of conservation planning, future studies should complement the presented richness maps with detailed information about beta diversity or endemism patterns of freshwater taxa, which could reveal unnoticed priority sites for protection of the Napo Basin. Also, it is critical to develop spatial data about anthropogenic threats to model different scenarios for conservation, mitigation, and even restoration of these diverse but also endangered regions.
Author’s contributions
Research design and grant writing: Andrea C. Encalada, Juan M. Guayasamin, LeRoy Poff, Alexander S. Flecker, W. Chris Funk, Cameron K. Ghalambor, Boris C. Kondratieff, Steven A. Thomas, and Kelly R. Zamudio. Field work and data gathering: José Schreckinger, Kayce L. Caser, Eduardo Toral-Contreras, Iván Jácome-Negrete, Andrea C. Encalada, and Juan M. Guayasamin. Data collection and analyses: Janeth Lessmann. Manuscript writing: Janeth Lessmann, Andrea C. Encalada, and Juan M. Guayasamin. All authors reviewed and made substantial contributions to the article.
Associate Editor: Miguel Pinto.
Disclosure statement
No potential conflict of interest was reported by the author.
Funding
This work was supported by Partnerships for Enhanced Engagement in Research Science [grant number P1-108], Dimensions of Biodiversity grant from the National Science Foundation [grant number DEB-1046408], Universidad Tecnológica Indoamérica [grant number Q2012-10], and Collaboration grant USFQ (“Recursos de agua dulce y biodiversidad en la Cuenca del Napo” to ACE). JL was also supported by Instituto de Ecología y Biodiversidad, Chile [grant number ICM- MINECON, P05-002 IEB].
Supplemental data
Supplemental data for this article can be accessed at http://dx.doi.10.1080/23766808.2016.1222189.
TNEO_A_1222189_Supplementary_material.zip
Download Zip (59 KB)Acknowledgments
We thank all the following institutions for granting access to their specimen databases (Appendix S1). Jaime Culebras and Rommel Arboleda provided invaluable helped in the field. Maja Celinscak, Nathy Quiroz, Luis Granizo, and Edgar Guerrón help sorting and identifying insects in the laboratory. Esteban Suárez, Javier Fajardo, Elisa Bonaccorso, and Wolly Womack provided helpful comments and information about species distributions.
Related Research Data
References
- Dudgeon D, Arthington AH, Gessner MO, et al. Freshwater biodiversity: importance, threats, status and conservation challenges. Biol. Rev. 2006;81:163–182.
- Balian EV, Segers H, Leveque C, et al. The freshwater animal diversity assessment: an overview of the results. Hydrobiologia. 2008;595:627–637.
- Abell R, Thieme M, Dinerstein E, Olson D. A sourcebook for conducting biological assessments and developing biodiversity visions for ecoregion conservation. Vol. II, Freshwater ecoregions. Washington, DC: World Wildlife Fund; 2002.
- Vörösmarty CJ, McIntyre PB, Gessner MO, et al. Global threats to human water security and river biodiversity. Nature. 2010;467:555–561.
- Tisseuil C, Cornu J, Beauchard O, et al. Global diversity patterns and cross-taxa convergence in freshwater systems. J. Anim. Ecol. 2013;82:365–376.
- Jenkins C, Pimm SL, Joppa LN. Global patterns of terrestrial vertebrate diversity and conservation. PNAS. 2013;110:E2602–E2610.
- Ricketts TH, Dinerstein E, Olson D, et al. Who’s where in North America? Patterns of species richness and the utility of indicator taxa for conservation. BioScience. 1999;49:369–381.10.2307/1313630
- Sauberer N, Zulka KP, Abensperg-Traun M, et al. Surrogate taxa for biodiversity in agricultural landscapes of eastern Austria. Biol. Conserv. 2004;117:181–190.10.1016/S0006-3207(03)00291-X
- Heino J, Paavola R, Virtanen R, et al. Searching for biodiversity indicators in running waters: do bryophytes, macroinvertebrates, and fish show congruent diversity patterns? Biodivers. Conserv. 2005;14:415–428.10.1007/s10531-004-6064-z
- Galacatos K, Stewart D, Ibarra M. Fish community patterns of lagoons and associated tributaries in the Ecuadorian Amazon. Copeia. 1996;1996:875–894.10.2307/1447650
- Hoekstra JM, Molnar JL, Jennings M, Revenga C, Spalding MD, Boucher TM, Robertson JC, Heibel TJ, Ellison K. The atlas of global conservation: changes, challenges, and opportunities to make a difference. Berkeley: University of California Press; 2010. Available from: http://maps.tnc.org/globalmaps.html.
- WWF/TNC. Freshwater ecoregions of the world. 2013 [cited 2014 Apr 10]. Available from: http://www.feow.org/.
- Abell R, Thieme M, Revenga C, et al. Freshwater ecoregions of the world a new map of biogeographic units for freshwater biodiversity conservation. BioScience. 2008;58:403–414.10.1641/B580507
- WWF. Napo moist forests. 2014 [cited 2014 Apr 29]. Available from: http://wwf.panda.org/about_our_earth/ecoregions/napo_moist_forests.cfm.
- Anderson EP, Maldonado-Ocampo JA. A regional perspective on the diversity and conservation of Tropical Andean fishes. Conserv. Biol. 2011;25:30–39.10.1111/j.1523-1739.2010.01568.x
- Olson D, Dinerstein E, Canevari P, Davidson R, Castro G, Morisset V, Abell R, Toledo E. Freshwater biodiversity of Latin America and the Caribbean. A conservation assessment. Washington, DC: Biodiversity Support Program; 1998.
- Stewart D, Barriga R, Ibarra M. Ictiofauna de la Cuenca del Río Napo. Ecuador Oriental: Lista Anotada de Especies Politécnica. 1987;12:9–63.
- Galacatos K, Barriga-Salazar R, Stewart D. Seasonal and habitat influences on fish communities within the lower Yasuni River Basin of the Ecuadorian Amazon. Environ. Biol. Fishes. 2004;71:33–51.10.1023/B:EBFI.0000043156.69324.94
- Mena CF, Bilsborrow RE, McClain ME. Socioeconomic drivers of deforestation in the Northern Ecuadorian Amazon. Environ. Manage. 2006;37:802–815.10.1007/s00267-003-0230-z
- Barriga R. Lista de Peces de Agua dulce e Intermareales del Ecuador. Politécnica. 2012;30:83–119.
- Fund W. Napo moist forests. 2014 [cited 2014 May 21]. Available from: http://www.eoearth.org/view/article/154765.
- Encalada A. Funciones ecosistémicas y diversidad de los ríos: Reflexiones sobre el concepto de caudal ecológico y su aplicación en el Ecuador. Polemika. 2010;5:40–47.
- Potes V. Análisis de la aplicación del Derecho Ambiental en la Amazonía Ecuatoriana y el rol de las Fiscalías Ambientales. Quito: CEDA; 2010.
- Finer M, Jenkins CN, Pimm SL, et al. Oil and gas projects in the Western Amazon: threats to wilderness, biodiversity, and indigenous peoples. PLoS ONE. 2008;3:e2932.10.1371/journal.pone.0002932
- Finer M, Jenkins CN. Proliferation of hydroelectric dams in the Andean Amazon and implications for Andes-Amazon connectivity. PLoS ONE. 2012;7:e35126.10.1371/journal.pone.0035126
- Carvalho SB, Brito JC, Pressey RL, et al. Simulating the effects of using different types of species distribution data in reserve selection. Biol. Conserv. 2010;143:426–438.10.1016/j.biocon.2009.11.010
- Gaston KJ, Rodrigues ASL. Reserve selection in regions with poor biological data. Conserv. Biol. 2003;17:188–195.10.1046/j.1523-1739.2003.01268.x
- Elith J, Leathwick JR. Species distribution models: ecological explanation and prediction across space and time. Annu. Rev. Ecol. Evol. Syst. 2009;40:677–697.10.1146/annurev.ecolsys.110308.120159
- Mateo RG. Modelos predictivos de riqueza de diversidad vegetal. Comparación y optimización de métodos de modelado ecológico. Madrid: Universidad Complutense de Madrid; 2008.
- Elith J, Leathwick J. Conservation prioritisation using species distribution modelling. In: Moilanen A, Wilson KA, Possingham HP, editors. Spatial conservation prioritization quantitative methods and computational tools. New York (NY): Oxford University Press; 2009. p. 27–93.
- Jenkins C, Guénard B, Diamond SE, et al. Conservation implications of divergent global patterns of ant and vertebrate diversity. Biodivers. Res. 2013;19:1084–1092.
- Heino J, Soininen J. Are higher taxa adequate surrogates for species-level assemblage patterns and species richness in stream organisms? Biol. Conserv. 2007;137:78–89.10.1016/j.biocon.2007.01.017
- Jacobsen D. Contrasting patterns in local and zonal family richness of stream invertebrates along an Andean altitudinal gradient. Freshwater Biol. 2004;49:1293–1305.10.1111/fwb.2004.49.issue-10
- Instituto Geográfico Militar del Ecuador. Cartografía Temática [cited 2015 Feb 2]. Available from: http://www.igm.gob.ec.
- Ministerio del Ambiente del Ecuador. Sistema de clasificación de los ecosistemas del Ecuador continental. Quito: Subsecretaría de Patrimonio Natural; 2012.
- Barriga R. Peces del Parque Naciona Yasuní. Politécnica. 1994;19:9–41.
- Fishnet2. 2014 [cited 2014 Jan 10]. Available from: http://www.fishnet2.net/.
- GBIF. 2014 [cited 2014 Jan 10]. Available from: www.gbif.net.
- Vertnet. 2014 [cited 2014 Jan 10]. Available from: http://vertnet.org/.
- Tirira D. Guía de Campo de los mamíferos del Ecuador. Quito: Ediciones Murciélago Blanco, Publicación especial sobre los mamíferos del Ecuador 6; 2007.
- IUCN. IUCN red list of threatened species. Version 2014.3. 2014. Available from: www.iucnredlist.org.
- Torres-Carvajal O, Salazar-Valenzuela D, Merino-Viteri A, Nicolalde DA. ReptiliaWebEcuador. Versión 2015.0. Quito: Museo de Zoología QCAZ, Pontificia Universidad Católica del Ecuador; 2015 [cited 2014 Feb 1]. Available from: http://zoologia.puce.edu.ec/Vertebrados/reptiles/reptilesEcuador.
- Ridgely R, Greenfield PJ. Aves del Ecuador. Vol. II, Guía de Campo. Quito: Fundación Jocotoco; 2007.
- Frost DR. Amphibian species of the world: an online reference. Version 5.5. New York: American Museum of Natural History; 2011. Available from: http://research.amnh.org/vz/herpetology/amphibia/.
- Centro Jambatu. Anfibios del Ecuador. Quito: Fundación Otonga; 2014 [cited 2014 Feb 1]. Available from: http://www.anfibioswebecuador.ec.
- Guayasamín JM, Castroviejo-Fisher S, Trueb L, et al. Phylogenetic systematics of Glassfrogs (Amphibia: Centrolenidae) and their sister taxon Allophryne ruthveni. Zootaxa. 2009;2100:1–97.
- Poff NL, Funk WC, Ghalambor CK, Kondratieff BC, Thomas S, Flecker AS, Bernardo J, Zamudio KR. An integrative traits-based approach to predicting variation in vulnerability of tropical and temperate stream biodiversity to climate change (EVOTRAC). NSF Collaborative Research; 2010.
- Guayasamin JM, Encalada A. Long-term sustainability of water resources and biodiversity under scenarios of climate change in the Napo watershed. NSF Partnerships for enhanced engagement in research (PEER) science; 2011.
- Guisan A, Zimmermann NE. Predictive habitat distribution models in ecology. Ecol. Modell. 2000;135:147–186.10.1016/S0304-3800(00)00354-9
- Phillips SJ, Anderson RP, Schapire RE. Maximum entropy modeling of species geographic distributions. Ecol. Modell. 2006;190:231–259.10.1016/j.ecolmodel.2005.03.026
- Graham CH, Elith J, Hijmans RJ, et al. The influence of spatial errors in species occurrence data used in distribution models. J. Appl. Ecol. 2008;45:239–247.
- Elith J, Graham CH, Anderson RP, et al. Novel methods improve prediction of species’ distributions from occurrence data. Ecography. 2006;29:129–151.
- Baselga A, Recuero E, Parra-Olea G, et al. Phylogenetic patterns in zopherine beetles are related to ecological niche width and dispersal limitation. Mol. Ecol. 2011;20:5060–5073.
- Schaefer SA, Arroyave J. Rivers as islands: determinants of the distribution of Andean astroblepid catfishes. J. Fish Biol. 2010;77:2373–2390.
- Schmidt-Lebuhn AN, Knerr NJ, Miller JT, et al. Phylogenetic diversity and endemism of Australian daisies (Asteraceae). J. Biogeogr. 2015;42:1114–1122.10.1111/jbi.12488
- Jacobsen D, Schultz R, Encalada A. Structure and diversity of stream invertebrate assemblages: the influence of temperature with altitude and latitude. Freshwater Biol. 1997;38:247–261.
- Pearson RG, Raxworthy CJ, Nakamura M, et al. Predicting species distributions from small numbers of occurrence records: a test case using cryptic geckos in Madagascar. J. Biogeogr. 2007;34:102–117.
- Wisz MS, Hijmans RJ, Li J, et al. Effects of sample size on the performance of species distribution models. Divers. Distrib. 2008;14:763–773.10.1111/ddi.2008.14.issue-5
- Phillips SJ, Dudík M, Elith J, et al. Sample selection bias and presence-only distribution models: implications for background and pseudo-absence data. Ecol. Appl. 2009;19:181–197.10.1890/07-2153.1
- Bystriakova N, Peregrym M, Erkens RHJ, et al. Sampling bias in geographic and environmental space and its effect on the predictive power of species distribution models. Syst. Biodivers. 2012;10:305–315.10.1080/14772000.2012.705357
- Kramer-Schadt S, Niedballa J, Pilgrim JD, et al. The importance of correcting for sampling bias in MaxEnt species distribution models. Divers. Distrib. 2013;19:1366–1379.10.1111/ddi.12096
- Phillips SJ, Dudík M. Modeling of species distributions with Maxent: new extensions and a comprehensive evaluation. Ecography. 2008;31:161–175.10.1111/j.0906-7590.2008.5203.x
- Velásquez-Tibatá J, Salaman P, Graham CH. Effects of climate change on species distribution, community structure, and conservation of birds in protected areas in Colombia. Reg. Environ. Change. 2012;13:235–248.
- Elith J, Phillips S, Hastie T, et al. A statistical explanation of MaxEnt for ecologists. Divers. Distrib. 2011;17:43–57.10.1111/ddi.2010.17.issue-1
- Jiménez-Valverde A, Lobo JM. Threshold criteria for conversion of probability of species presence to either-or presence-absence. Acta Oecol. 2007;31:361–369.10.1016/j.actao.2007.02.001
- Elith J, Leathwick J. Predicting species distributions from museum and herbarium records using multiresponse models fitted with multivariate adaptive regression splines. Divers. Distribut. 2007;13:265–275.10.1111/ddi.2007.13.issue-3
- AmphibiaWeb. Information on amphibian biology and conservation. Berkeley, CA; 2012. Available from: http://amphibiaweb.org/.
- Soberón J, Peterson TA. Interpretation of models of fundamental ecological niches and specie’s distributional areas. Biodivers. Inf. 2005;2:1–10.
- Dutilleul P, Clifford P, Richardson S, et al. Modifying the t Test for assessing the correlation between two spatial processes. Biometrics. 1993;49:305–314.10.2307/2532625
- Lounaci A, Brosse S, Thomas A, et al. Abundance, diversity and community structure of macroinvertebrates in an Algerian stream: the Sébaou wadi. Ann. Limnol. 2000;36:123–133.10.1051/limn/2000008
- Carvajal V. Macroinvertebrados acuáticos. In: Albuja L, editor. Fauna de Guiyero, Parque Nacional Yasuní. Quito: Escuela Politécnica Nacional – EcoFondo; 2011. p. 169–183.
- Ferreira V, Encalada AC, Graça M. Effects of litter diversity on decomposition and biological colonization of submerged litter in temperate and tropical streams. Freshwater Sci. 2012;31:945–962.10.1899/11-062.1
- Jacobsen D. Low oxygen pressure as a driving factor for the altitudinal decline in taxon richness of stream macroinvertebrates. Oecologia. 2008;154:795–807.10.1007/s00442-007-0877-x
- Utreras BV, Suárez RE, Zapato-Ríos G, et al. Dry and rainy season estimations of giant otter, Pteronura brasiliensis, home range in the Yasun′ı National Park, Ecuador. LAJAM. 2005;4:1–4.
- Wright DH. Species-energy theory: an extension of species-area theory. Oikos. 1983;41:496–506.
- Heino J. Concordance of species richness patterns among multiple freshwater taxa: a regional perspective. Biodivers. Conserv. 2002;11:137–147.10.1023/A:1014075901605
- McCLain ME, Richey JE. Regional-scale linkages of terrestrial and lotic ecosystems in the Amazon basin: a conceptual model for organic matter. Large Rivers. 1996;10:1–4.
- Mortillaro J-M, Rigal F, Rybarczyk H, et al. Particulate organic matter distribution along the lower Amazon river: addressing aquatic ecology concepts using fatty acids. PLoS ONE. 2012;7:e46141.10.1371/journal.pone.0046141
- Albuja L. Fauna de Guiyero, Parque Nacional Yasuní. Quito: Escuela Politécnica Nacional – EcoFondo; 2011.
- Cooke GM, Chao NL, Beheregaray LB. Natural selection in the water: freshwater invasion and adaptation by water colour in the Amazonian pufferfish. J. Evol. Biol. 2012;25:1305–1320.10.1111/j.1420-9101.2012.02514.x
- Hutter CR, Guayasamin JM, Wiens JJ. Explaining Andean megadiversity: the evolutionary and ecological causes of glassfrog elevational richness patterns. Ecol. Lett. 2013;16:1135–1144.10.1111/ele.2013.16.issue-9
- Grelle CEV. Is higher-taxon analysis an useful surrogate of species richness in studies of Neotropical mammal diversity? Biol Conserv. 2002;108:101–106.10.1016/S0006-3207(02)00094-0
- Balmford A, Lyon AJE, Lang RM. Testing the higher-taxon approach to conservation planning in a megadiverse group: the macrofungi. Biol. Conserv. 2000;93:209–217.10.1016/S0006-3207(99)00140-8
- Williams PH, Gaston K. Measuring more of biodiversity: can higher-taxon richness predict wholesale species richness? Biol. Conserv. 1994;211–217.
- Bunn SE, Arthington AH. Basic principles and ecological consequences of altered flow regimes for aquatic biodiversity. Environ. Manage. 2002;67:30:492–507.10.1007/s00267-002-2737-0
- Joy MK, Death R. Predictive modelling and spatial mapping of freshwater fish and decapod assemblages using GIS and neural networks. Freshwater Biol. 2004;49:1036–1052.10.1111/fwb.2004.49.issue-8
- Jenness J. DEM surface tools. Flagstaff: Jenness Enterprises; 2013.
- Rondinini C, Wilson KA, Boitani L, et al. Tradeoffs of different types of species occurrence data for use in systematic conservation planning. Ecol. Lett. 2006;9:1136–1145.10.1111/j.1461-0248.2006.00970.x
- Bombi P, Luiselli L, D’Amen M. When the method for mapping species matters: defining priority areas for conservation of African freshwater turtles. Divers. Distrib. 2011;17:581–592.10.1111/ddi.2011.17.issue-4
- Ministerio de Electricidad y Energia Renovable. Ecuador, un ejemplo para el mundo en energía limpia y desarrollo Quito. 2014 [cited 2015 Nov 2]. Available from: http://www.energia.gob.ec/ecuador-un-ejemplo-para-el-mundo-en-energia-limpia-y-desarrollo/.
- Jaramillo-Villa U, Maldonado-Ocampo JA, Escobar F. Altitudinal variation in fish assemblage diversity in streams of the central Andes of Colombia. J. Fish Biol. 2010;76:2401–2417.10.1111/jfb.2010.76.issue-10
- Ministerio del Ambiente. Áreas Protegidas del Ecuador. 2015 [cited 2015 Nov 2]. Available from: http://www.ambiente.gob.ec/areas-protegidas-3/.
- Bass MS, Finer M, Jenkins CN, et al. Global conservation significance of Ecuador’s Yasunı′ National Park. PLoS ONE. 2010;5:e8767.10.1371/journal.pone.0008767
- Arellano P, Tansey K, Balzter H, et al. Detecting the effects of hydrocarbon pollution in the Amazon forest using hyperspectral satellite images. Environ. Pollut. 2015;205:225–239.10.1016/j.envpol.2015.05.041
- Rosenfeld AB, Gordon DL, Guerin-McManus M. Reinventing the well. Approaches to minimizing the environmental and social impact of oil development in the Tropics. Washington, DC: Conservation International; 1997.
- Fontaine G. Petróleo y desarrollo sostenible en Ecuador: Reglas de juego. Quito: FLACSO & GPA Petroecuador; 2003.
- Kimerling J. Disregarding environmental law: petroleum development in protected natural areas and indigenous homelands in the Ecuadorian Amazon. Hastings Int. Compar. Law Rev. 1991;14:849–903.
- Larrea C, Larrea AI, Bravo AL, Belmont P, Baroja C, Mendoza C, Ibáñez W, Luna I. Petróleo, sustentabilidad y desarrollo en la Amazonía Centro-Sur. Quito: Fundación Pachamama, Unidad de Información Socio Ambiental de la Universidad Andina Simón Bolívar, Ecuador; 2010.
- Suárez E, Morales M, Cueva R, et al. Oil industry, wild meat trade and roads: indirect effects of oil extraction activities in a protected area in north-eastern Ecuador. Anim. Conserv. 2009;12:364–373.10.1111/acv.2009.12.issue-4
- Zapata Ríos G, Suárez E, Utreras V, Cueva R. Uso y conservación de fauna silvestre en el Ecuador. In: Krainer A, Mora MF, editors. Retos y Amenazas en Yasuní. Quito: FLACSO; 2011. p. 97–116.
- Dudley N, Parish J. Closing the gap. Creating ecologically representative protected area systems: a guide to conducting the gap assessment of protected area system for the convention on biological diversity. Montreal: Secretariat of the Convention on Biological Diversity; 2006. ( Technical Series; no. 24).
- Buisson L, Blanc L, Grenouillet G. Modelling stream fish species distribution in a river network: the relative effects of temperature versus physical factors. Ecol. Freshwater Fish. 2007;17:244–257.
- Filipe AF, Cowx IG, Collares-Pereira MJ. Spatial modelling of freshwater fish in semi-arid rivers systems: a tool for conservation. River Res. Appl. 2002;18:123–136.10.1002/(ISSN)1535-1467
- Maloney KO, Weller DE, Michaelson DE, et al. Species distribution models of freshwater stream fishes in Maryland and their implications for management. Environ. Model. Assess. 2013;18:1–12.10.1007/s10666-012-9325-3
- Sierra R. Propuesta preliminar de un sistema de clasificación de vegetación para el Ecuador continental. Quito: Proyecto INEFAN/GEF-BIRF y Ecociencia; 1999.