
 ?Mathematical formulae have been encoded as MathML and are displayed in this HTML version using MathJax in order to improve their display. Uncheck the box to turn MathJax off. This feature requires Javascript. Click on a formula to zoom.
ABSTRACT
After many years of illegal hunting and commercialization, the populations of the Black caiman (Melanosuchus niger) have been recovering during the last four decades due to the enforcement of a legislation that inhibits their international commercialization. Protecting nesting sites, in which vulnerable life forms (as reproductive females, eggs, and neonates) spend considerable time, is one of the most appropriate conservation actions aimed at preserving caiman populations. Thus, identifying priority areas for this activity should be the primary concern of conservationists. As caiman nesting sites are often found across the areas with difficult access, collecting nest information requires extensive and costly fieldwork efforts. In this context, species distribution modeling can be a valuable tool for predicting the locations of caiman nests in the Amazon basin. In this work, the maximum entropy method (MaxEnt) was applied to model the M. niger nest occurrence in the Mamirauá Sustainable Development Reserve (MSDR) using remotely sensed data. By taking into account the M. niger nesting habitat, the following predictor variables were considered: conditional distance to open water, distance to bare soil, expanded contributing area from drainage, flood duration, and vegetation type. The threshold-independent prediction performance and binary prediction based on the threshold value of 0.9 were evaluated by the area under the curve (AUC) and performing a binomial test, respectively. The obtained results (AUC = 0.967 0.006 and a highly significant binomial test
) indicated excellent performance of the proposed model in predicting the M. niger nesting occurrence in the MSDR. The variables related to hydrological regimes (conditional distance to open water, expanded contributing area from drainage, and flood duration) most strongly affected the model performance. MaxEnt can be used for developing community-based sustainable management programs to provide socio-economic benefits to local communities and promote species conservation in a much larger area within the Amazon basin.
1. Introduction
After more than 40 years since the ban of harvesting and commercialization of the fauna in Brazil (Federal Law 5197/67), Melanosuchus niger populations have considerably increased [Citation1]. Since 2000, the species has been categorized in the IUCN Red List as “lower risk-conservation-dependent” ones [Citation2]. In 2007, the Brazilian population of M. niger was transferred from the species list in Appendix I to that in Appendix II of CITES [Citation3], allowing their closely controlled trade [Citation4]. The current demographic status of this species relies on the intensive management of wild individuals and educational plans aimed at their sustainable use and conservation [Citation5]. However, due to a number of challenges, such as the difficulty of defining suitable conservation areas, lack of funding, and poor law enforcement, all conservation initiatives have been restricted to few areas within the Amazon basin.
Protecting caiman nesting sites where the most vulnerable life forms (as reproductive females, eggs, and neonates) remain for prolonged periods is of high importance for conservation actions [Citation6]. Because nesting sites are often located in the areas with difficult access, species distribution models (SDMs) can be a valuable tool for predicting caiman nesting occurrence. These statistical models allow using species occurrence data to determine ecological requirements and predict their potential distributions [Citation7–Citation9]. In ecology a nd conservation, the maximum entropy method (MaxEnt) has been successfully applied to species distribution modeling using presence-only data. MaxEnt requires a set of the occurrence coordinates of known species and layers of predictor variables. The main advantages of using MaxEnt are as follows: (i) the input can consist of presence-only data; (ii) continuous and categorical data can be incorporated into the model as input variables; (iii) importance of the individual variables can be evaluated; (iv) interactions between different variables can be assessed; and (v) accurate predictions can be obtained even at small sample sizes [Citation10–Citation13].
Considering nests as the organisms whose spatial distributions are determined by environmental variables, MaxEnt can be applied to model caiman nest occurrence at a local scale. In addition, presence-only data are convenient for modeling the caiman nest occurrence while dealing with pseudo-absence across the areas with difficult access where nests may be located. However, the use of the MaxEnt method to predict crocodilian nest occurrence worldwide has not been considered. To the best of our knowledge, only a pioneering work was conducted in the Brazilian Amazon basin to model the M. niger nest occurrence using topographic and land-cover variables [Citation14]. The application of remotely sensed data (aerial photography, satellites, and unmanned aerial vehicles or “drones”) in locating M. niger nesting sites is also gaining popularity. By using optical imagery, an open-water stability index was proposed to show a positive correlation between the M. niger nest abundance and the hydrologically stable water bodies in the Brazilian Amazon basin [Citation14,Citation15].
In this study, we applied the MaxEnt technique to model the probability of crocodilian nest occurrence in the Mamirauá Sustainable Development Reserve (MSDR) using a set of environmental variables reflecting the following three grouping factors: habitat availability, limiting habitat, and disturbance. Its objective was to determine whether MaxEnt could be used to predict the locations of M. niger nesting sites, which might provide information on the conservation and sustainable use programs in the MSDR. Our specific goals were (1) to predict areas suitable for M. niger nesting in the MSDR; (2) to suggest a threshold for prioritizing a low false positive (or commission) error; and (3) to determine the most effective environmental variables for predicting M. niger nesting site distributions.
2. Materials and methods
2.1. Study area
The MSDR represents the world largest protected area developed for wetland environmental conservation. It is situated in the Central Amazon basin at the confluence of the Solimões (Amazon) and Japurá rivers. It is located near the Tefé municipality and 570 km apart from Manaus (the capital city of the Amazonas State, Brazil), covering approximately 11,240 km2 (central coordinates: 2º16S and 65º41
W) ().
Figure 1. Study area. On the top: MSDR location (red area) in Central Amazon, Brazil. In the background, bottom part: MSDR limits are drawn on the SRTM image (red line).
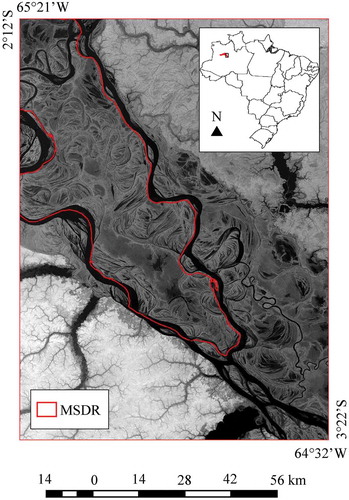
The study area is located in a floodplain subjected to the streams of nutrient-rich silt-laden water caused by the large monomodal flood pulse of Solimões-Amazon river with a mean amplitude of the water level equivalent to approximately 10 m [Citation16–Citation18]. The high-water (HW) season spans from May to middle-July; and the receding water phase starts in July and lasts up to September. The low-water (LW) season lasts from September and November; and the rising water phase begins in December and ends in May [Citation19].
In the MSDR, M. niger nesting peaks between September and November; the incubation stage (lasting approximately 85 to 90 d) occurs between September and January; and hatching is observed between November and January [Citation15,Citation20]. M. niger females selectively build their nests either near the edges of floodplain lakes that remain stable during the incubation period or on the floating meadows formed by the intertwined grasses within the water bodies [Citation15,Citation20,Citation21].
2.2. Nest presence records
In the MSDR, ground nest surveys were conducted at distances from the water edge below 20 m during the LW seasons of 2007 and 2008. M. niger nests were searched by walking along the shores of 66 water bodies; 12 of these water bodies were surveyed in the nesting periods of both years [Citation14].
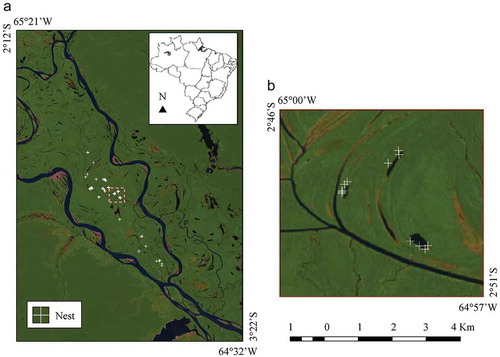
A total of 231 M. niger nests were found close to the shores of 44 surveyed water bodies during the 2007 () and 2008 (
) nesting periods and then georeferenced using the Global Positioning System (GPS) with a 5-m positional accuracy. The nests were built very close to the water edge (Mean = 2.0
3.3 m) [Citation14]. Out of 231 nests, only 80 ones were used to avoid spatial correlations between different points. The field-based spatial distribution of the M. niger nest occurrence is shown in .
Figure 2. Spatial distribution of the M. niger nest occurrence during the 2007 and 2008 nesting seasons in the MSDR. (a) Localities of the M. niger nests (white crosses) on the Landsat-5/TM (R:5, G:4, B:3) image during the LW season (2007–09–10). (b) Detailed view of the M. niger nest occurrence (white crosses) close to the edges of the small water bodies. Adapted from: http://earthexplorer.usgs.gov.
2.3. Data acquisition and image classification
Optical imagery was acquired in the red (R: 0.63–0.69 µm), green (G: 0.76–0.90 µm), and blue (B: 1.55–1.75 µm) bands using the Thematic Mapper (TM) sensor onboard the Landsat-5/TM satellite. TM images for the MSDR region (path 1, row 062) were freely available at the U.S. Geological Survey (USGS) database http://earthexplorer.usgs.gov accessed on 8 January 2018). TM images with a 30-m spatial resolution were acquired on 2007–07–24 (HW season) and 2007–09–10 (LW season) for classification purposes. The criteria for image selection were minimum cloud coverage, water season, and water level. Water levels were recorded at the Mamirauá Lake gauging station (03º06S and 64º47
W) in 2007 [Citation18,Citation22]. The images acquired on 2007–07–24 and 2007–09–10 correspond to the water levels of 34.05 and 25.73 m, respectively.
A digital elevation model (DEM) with a spatial resolution of 3 arc-s (or about 90 m at the Equator) derived from the Shuttle Radar Topographic Mission (SRTM) data was used for producing a local drainage direction (LDD) grid. The SRTM DEM was freely available for the MSDR region at the USGS database (accessed on 25 January 2018). Google EarthTM high-resolution images were applied to the visual interpretation of classification results. Other sources of imagery, such as an ALOS/Palsar L-band radar, were used by [Citation23] for determining the vegetation structure and inundation patterns in the MSDR. We used data georeferenced to the Universal Transverse Mercator geographic coordinate system and World Geodetic System WGS84.
A K-means clustering algorithm [Citation24] was utilized to perform unsupervised image classification. We defined the parameters clusters and iterations
based on the trial and error approach. The selected parameters allowed better distinguishing between different spectral patterns in the visual interpretation of classification results. Optical images obtained in the red, green, and blue bands (RGB) from the TM were separately classified for the LW and HW seasons using the K-means algorithm implemented in the Spring 5.3 software [Citation25].
After classification, 30 clusters were visually regrouped in separate classes for each TM image using Google EarthTM and Landsat-5/TM. Three land-cover classes were defined for each TM image: (1) open water comprising water surfaces free from floating and emerging vegetation; (2) bare soil comprising areas of bare soil, sparse grass, and exposed lake substrates; and (3) vegetation comprising trees as well as arboreal and herbaceous plants that were either subjected or not to flooding.
2.4. Predictor variables
We used five predictor variables derived from remotely sensed data () considering the literature key aspects for the M. niger nesting occurrence in the Brazilian Amazon region [Citation26]. The relationship between the predictor variables and the M. niger nesting habitat is provided in . We classified these predictor variables in accordance with three grouping factors: (1) habitat availability, which includes a conditional distance to open water (CDOW) and vegetation type (VT); (2) limiting habitat, which includes a distance to bare soil (DBS) and expanded contributing area from drainage (ECAD); and (3) disturbance, which includes flood duration (FD) (for more information on each predictor variable, see the subsections below). The maps exemplifying the predictor variables used in this study are provided in .
Figure 3. Maps of the predictor variables used for modeling M. niger nest occurrence in the MSDR. Detailed views of the same area are provided for: (a) CDOW, (b) DBS, (c) ECAD, (d) VT, and (e) FD.
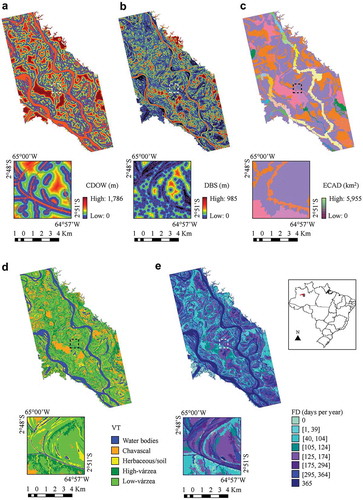
Table 1. Specifications of the remotely sensed data used for modeling the distribution of suitable M. niger nesting sites in the MSDR.
Table 2. Descriptions of the environmental variables and their relation to the M. niger nesting ecology and habitat.
2.4.1. Habitat availability factor
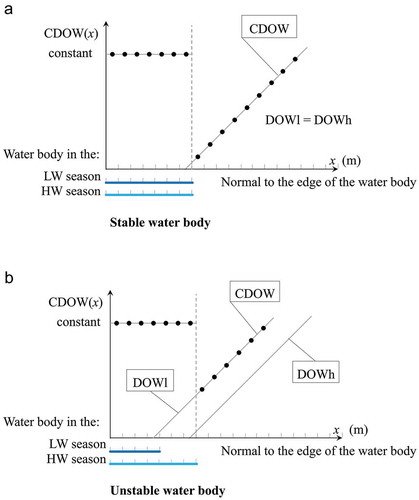
CDOW is used as a proxy for the open water stability and is a non-linear function of two auxiliary variables: the distances to the open water in the low (DOWl) and high (DOWh) water seasons. Both variables are continuous, whose values at a point of the scene are the Euclidian distances from this point to the nearest open water class on the LW and HW season TM classified images, respectively. CDOW was computed using the Spring 5.3 software [Citation25].
The following conditional rule was used to define the CDOW. For any point of the scene:
If the point is immersed in water during the HW season, a constant value of 1000 is assigned; otherwise, DOWl(x) is used. This approach penalizes the unstable water bodies whose DOWl values are greater than the DOWh ones (). CDOW allows distinguishing between the parts of the open water edge affected by the change in the water level and the stable non-affected parts.
Figure 4. CDOW plotted along the normal to the edges of the (a) stable and (b) unstable water bodies.
VT is a categorical variable obtained by [Citation23] for the MSDR. Five land-cover classes were defined: three for vegetation types (“Chavascal”, “Low Várzea”, and “High Várzea”), one for permanent water surfaces (“Water Bodies”), and one for transient areas (“Herbaceous/Soil”). For more details on the definition of each class and the procedure utilized for obtaining this variable, see [Citation23].
2.4.2. Limiting habitat factor
Bare soil represents the water-land interface of unstable water bodies that becomes exposed at the peak of the LW season. DBS is a continuous variable, whose value at a point of the scene is the Euclidian distance from this point to the nearest bare soil class on the LW season TM classified image.
ECAD is used as a proxy for the total water volume and represents one of the key factors for determining the water flow velocity. ECAD is a continuous variable, whose value at a point of the scene is the area of the smallest hydrological basin that contains this point.
ECAD requires an LDD grid, a contributing area attribute, and a drainage network. In this work, the SRTM DEM was pre-processed to remove all sinks (local minimum) and produce a hydrologically consistent LDD. Using a multi-criteria methodology to automatically extract the drainage network [Citation27], morphometric (from DEM) and hydrological (from DEM and LDD) attributes were determined. In the next step, the classification based on a decision tree was used, as defined by [Citation27]. The drainage network and contributing area were combined to produce an ECAD (supplementary Figure S1). ECAD was computed using the TerraHidro 4.2 [Citation28] and Envi/IDL 5.0 (Exelis Visual Information Solutions, Boulder, Colorado) software packages.
2.4.3. Disturbance factor
The flooding of large rivers causes natural perturbations while affecting environmental systems. FD is a categorical variable obtained by [Citation23] for the MSDR. The following eight classes were defined: 0, [1, 39], [40, 104], [105, 124], [125, 174], [175, 294], [295, 364], and 365. For more details on using this variable, see [Citation23].
2.5. Modeling procedure
Modeling was performed by applying the MaxEnt software for species distribution version 3.4.1 (https://biodiversityinformatics.amnh.org/open_source/maxent/, accessed on 15 June 2018) [Citation13,Citation29]. A model prioritizing the 2007 nesting period was utilized because the number of M. niger nesting females in the study area was higher in 2007 than in 2008, while the egg mortality rate due to flooding was lower in 2007 than in 2008 [Citation14]. By using the M. niger nesting presence records and a set of predictor variables, MaxEnt could approximate the unknown probability distribution or suitability of the M. niger nest occurrence over the scene [Citation30].
Among all probability distributions over the scene that satisfy a set of statistical properties or “constrains”, MaxEnt selects the one (so-called MaxEnt probability distribution) with the maximum entropy. For species distribution modeling, MaxEnt uses “features” that are mathematical transformations (linear, quadratic, product, threshold, or hinge) of the predictor variables. The constrains impose that the mean of each feature should be close to its empirical average at the nest presence localities [Citation13]. Here, we used the linear, quadratic, and hinge transformations because the current training sample size was between 15 and 79 (for the information on the training sample size, see below).
Supplementary Figure S2 illustrates the operation of MaxEnt using two presence records and one hypothetical predictor variable. It starts with a uniform distribution while omitting the predictor variable information. During training, the program increases the probability distribution value at presence. After convergence, the sites or cells without presence, but with an equal environmental value (the light grey ones) are assigned a probability distribution value identical to that of the sites with the nest presence. The other cells (the dark grey ones) are assigned a non-zero probability distribution value because of the regularization technique used by MaxEnt. According to the maximum entropy principle, the MaxEnt probability distribution of supplementary Figure S2 results in only two values due to the predictor variable range size of two. In the perspective display, we see that the MaxEnt probability distribution has two smooth plateaus in agreement with this principle.
In addition to the MaxEnt probability or raw distribution, MaxEnt also returns the so-called cumulative and logistic distributions. The former specifies the omission rate, and the latter determines the probability of the nest occurrence [Citation29].
A special threshold was used to convert the continuous MaxEnt prediction into binary ones, delimiting the suitable versus unsuitable areas for nesting. For a given threshold, the binary prediction sensitivity is the fraction of all correctly predicted positive instances (or presence), while the binary prediction specificity is the fraction of all correctly predicted negative instances (or absence). The sensitivity also corresponds to the true positive rate. The quantity 1 – sensitivity, also called the false negative rate, is the omission error, while the quantity 1 – specificity, also called the false positive rate, is the commission error. Once a threshold value is selected, the fraction of the predicted scene sites is called the predicted area for that particular threshold [Citation13,Citation31].
To illustrate how the training omission and predicted area vary with the threshold value, their corresponding curves are plotted in the same two-dimensional space. When the threshold values on the x-axis are used to obtain binary predictions from the cumulative distribution, the predicted omission curve represents the first diagonal, and we can predict a similar omission for the training samples [Citation32].
By utilizing a set of threshold values, a receiver operating characteristic (ROC) curve may be plotted and used to evaluate the MaxEnt prediction performance. In this curve, the sensitivity is plotted on the y-axis and 1 – specificity on the x-axis for all possible thresholds. When the available data are presence-only, a set of random background sites is used instead of the absence localities to compute the specificity. The AUC is considered a threshold-independent measure of the model performance [Citation13].
The AUC ranges from 0 to 1; the closer is its magnitude to 1, the better is the model at predicting the species localities, whereas the values close to 0.5 indicate that the model is not informative and that its predictive ability is not better than that of the random prediction [Citation31,Citation33]. Poor model performance is observed at AUC values between 0.5 and 0.7; reasonable/moderate model performance is observed values between 0.7 and 0.9; and excellent model performance is obtained at AUC values greater than 0.9 [Citation33].
We used the bootstrap resampling technique with 100 runs for model training and testing because our sample size was smaller than this number. This technique allows testing the model while taking advantage of all available data. These multiple runs result in training omission and predicted area curve with error bars. In the same way, they produce the AUC mean and standard deviation across the models. The bootstrap technique draws a random sample by uniform selection while replacing elements from the original sample until a random sample of the same size is obtained [Citation34]. After removing the duplicate records having the same geographic coordinates, only 63 M. niger nest presence localities were used during the run. We set aside 25% (15) of the nest presence localities as the test sites and the remaining localities (48) as the training sites. To reduce the processing time without deteriorating the modeling performance, the default option for the maximum number of background points (10,000) was set.
A statistical summary of the MaxEnt nesting probability of occurrence was prepared in accordance with the following five arbitrarily defined probability classes: very low (), low (]0.1, 0.4]Footnote1), medium (]0.4, 0.6]), high (]0.6, 0.9]) and very high (
). A predictive map was generated by choosing a threshold value of 0.9 to classify the nesting sites with high probabilities of occurrence. A corresponding one-tailed binomial test was performed to determine whether MaxEnt predicted the testing sites significantly better than the random prediction. The 1-sided p-value corresponding to the observed sensitivity was computed for the null hypothesis stating that the testing sites were not predicted better than by the random prediction with a probability specified by the observed fractional predicted area for that threshold [Citation13]. The Jackknife test was performed to determine the relative importance of the individual predictor variables in terms of AUC values [Citation11].
3. Results
The predicted logistic distribution of the M. niger nest occurrence in the MSDR is shown in . The visual interpretation of the image suggests that the model successfully detected M. niger nests in the studied region. The areas with high probabilities of the M. niger nest occurrence are mostly located near the edges of the small water bodies, which are preferred by M. niger females for building their nests. The mean omission curve of the training data matched very well the predicted one (supplementary Figure S3). In the ROC curve, the mean training AUC value was 0.967, and the standard deviation was 0.006, indicating highly satisfactory model performance.
Figure 5. Predictive map of the M. niger nest occurrence in the MSDR. (a) Predicted logistic distribution for M. niger nests. (b) Detailed view of the water bodies where M. niger nests were built.
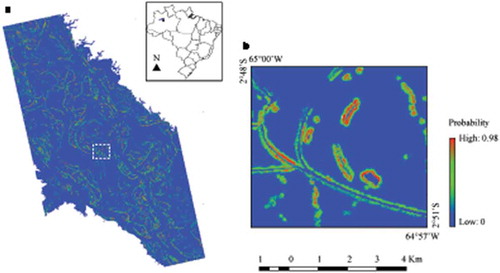
By using the five arbitrarily defined probability classes, 84.0% of the study area had very low () potential for M. niger nest occurrence; and 9.2% low (
), 2.7% medium (
), 2.9% high (
), and 1.2% very high (
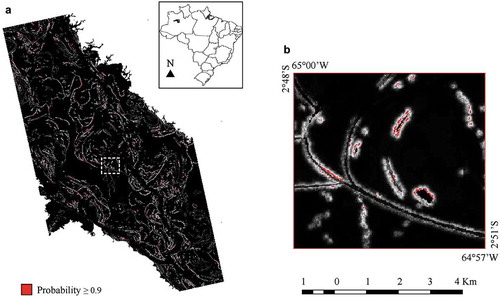
) potentials. The predictive map for the M. niger nest occurrence obtained at a threshold value of 0.9 is displayed in . This map indicates that the stable edge of the slow-moving water bodies possesses a high probability of the M. niger nest occurrence. In the threshold-dependent evaluation of the model performance, the binomial test was highly significant (
) at a threshold value of 0.9, indicating that our model predicted the testing sites significantly better than the random prediction.
Figure 6. Threshold-dependent evaluation of the model performance. (a) Probability of the M. niger nest occurrence in the MSDR equal or greater than 0.9 (red areas) plotted over the predicted logistic distribution map (gray scale). (b) Detailed view of the water bodies where M. niger nests are built.
The most effective variable for predicting the testing sites of M. niger nests was CDOW considering its high AUC (supplementary Figure S4) and percentage contribution () provided by the MaxEnt program. ECAD, FD, and VT were considered relevant for predicting the testing sites, leading to moderate values of AUC (supplementary Figure S4) and percentage contributions (). The remaining DBS variable was considered less useful for the predictive model.
Table 3. Environmental variables used during modeling; their units and percentage contributions.
4. Discussion
The MaxEnt program has become increasingly popular among researchers, owing to its much better performance as compared with that of other SDM approaches [Citation11]. It is freely available on the web, and its application can be developed at little to no cost. In addition, MaxEnt not only performs the model calibration, but also provides easy-to-handle output data for model evaluation or testing, such as the model performance (AUC), predicted area, and relative importance of individual variables (Jackknife test).
The application of M. niger nest modeling in the conservation and monitoring areas requires high model stability, accuracy, and reliability. The results of model evaluation demonstrated that MaxEnt could be efficiently used for predicting the M. niger nest occurrence in the MSDR and thus applied in the fields of species conservation and sustainable use. The results obtained with this model can simulate the probability of nest occurrence throughout the years by substituting the environmental variables for year 2007 with the corresponding variables for the studied year.
During monitoring the environmental conditions across vast areas such as the Amazon basin, remotely sensed data can provide an effective alternative for costly fieldwork efforts. Hence, we utilized the Landsat-5/TM imagery to assess the open water stability in the MSDR, which is a good predictor of the M. niger nest occurrence. TM images can efficiently describe the interface between the open water and the surrounding terrestrial features, such as soil and vegetation. While in a previous study, a segment-based classification method was used to characterize the water body stability [Citation15], in this work, a pixel-based method was utilized to characterize the edge stability.
High spatial resolution images can be obtained using very high-resolution sensors ( 1 m), such as IKONOS and Quickbird ones [Citation35], but they are relatively expensive. As was suggested in a previous study [Citation15], multitemporal radar imagery was used in this work to obtain data on VT along with FD in the MSDR [Citation23]. By operating under the adverse weather and illumination conditions as well as dense vegetation cover, radar sensors have been widely applied to map the flooding areas beneath the forest canopy and macrophyte cover [Citation36,Citation37] in the wetlands. Although optical imagery can be used to map floating macrophytes and flooded forests in the wetlands [Citation38], only radar sensors can resolve the cloud cover [Citation37].
While the previous study relied mainly on the open water stability to model M. niger nest occurrence [Citation14], the obtained Jackknife test results indicated the importance of other hydrological variables (ECAD and FD) and vegetation for nest distribution modeling in addition to the open water stability. CDOW was specially designed to characterize the open water edge stability, representing the permanent water bodies where M. niger females place their nests and remain to protect them from predators. It is a non-linear function of DOWl and DOWh and has no counterparts in the current MaxEnt modeling implementation. Hence, using DOWl and DOWh instead of CDOW as MaxEnt inputs would produce a less accurate output.
In addition to predation, flooding is considered a major factor contributing to crocodilian egg mortality. Caiman nests should be built at a safe distance from the water bodies to protect the eggs from predation (which occurs at larger distance from water bodies) and flooding (which occurs at proximity to water bodies) [Citation39,Citation40]. Although caiman eggs appear to be highly resistant to occasional flooding [Citation[20], the M. niger female strategy is to build their nests in the areas that remain hydrologically isolated for a long period of time during annual water rising. Thus, these areas are subjected to shorter flood events throughout the incubation period [Citation15].
Vegetation is considered a potentially suitable nesting habitat as M. niger females place their nests near the permanent water bodies surrounded by forest [Citation15,Citation20,Citation41]. Vegetation can serve as a source of protection for eggs from excessive solar radiation and the material utilized by caiman females for building their nests. Owing to the high importance of flooding regimes and vegetation to the caiman nesting habitats, we hypothesize that the combination of deforestation and climate change will produce a negative impact on the M. niger nest occurrence in the Amazon basin.
M. niger females are known to avoid building their nests close to the bare soil areas [Citation15]. Although our Jackknife test results did not indicate high importance of DBS to model predictions, this variable can delineate the areas with less preference for M. niger to place their nests. The results predicted with our model showed that the unstable water bodies surrounded by bare soil were accurately estimated at a low probability of the M. niger nest occurrence. Its limitation is that the visual interpretation of bare soil should be performed during the driest period of the year or before the herbaceous growth. Some herbaceous types, such as grass (Paspalum and Eichinochloa), can be also used to delimit unsuitable environments for M. niger nests. In contrast, floating meadows (“matupás”) were previously referred as appropriate nesting areas for M. niger species [Citation15]. However, it remains difficult to differentiate grass from “matupás” using remotely sensed data.
Climatic variables previously used for the characterization of the M. niger nesting habitats included temperature [Citation20,Citation21] and precipitation [Citation41,Citation42]. Whereas temperature affects the duration of the caiman reproductive season and building of nests, precipitation affects the availability of food, caiman egg predation and mortality rates, and caiman skewed sex ratios. Global climate data are freely available on the web for ecological modeling purposes (http://www.worldclim.org/bioclim). Remotely sensed data can be also applied to determine temperature (AVHRR and MODIS) [Citation43] and precipitation (TRMM, GPM and MODIS) values [Citation44]. Here, we did not include climatic variables because the available data were not suitable for the mapping scale in the present study.
In this work, some false negative or omission errors may be generated due to the classification bias related to the open water class during the LW season. A misinterpretation of the open water class can result in a wrong assignment of the open water instability to a given area and thus in a low probability of the M. niger nest occurrence. In local studies, drones can be used to provide high spatial and temporal resolutions at low charge, although at the cost of reduced spatial coverage [Citation45].
On the other hand, some false positive or commission errors may be due to the poor differentiation between the lakes and channels in the study area. We incorporated EACD into the model to represent the total water volume and indirectly the water flow velocity. M. niger nesting females appear to prefer heavily vegetated and slow-moving water bodies where they can remain for prolonged periods [Citation[20,Citation46,Citation47]. Using ECAD for distinguishing them from the fast-moving water bodies was found to be a valid alternative. The results obtained using our model showed that most edges of the large rivers had a low probability of the M. niger nest occurrence. For future studies, we suggest including (in addition to EACD) the connectivity between the lakes and the main water flow to avoid some commission errors.
In this work, we decided to select a threshold value of 0.9 to reduce the model sensitivity, predicted area, and commission errors. The binomial test of omission conducted at this threshold rejected the null hypothesis. In the context of conservation initiatives, we assumed that the false positive errors would prioritize unnecessary areas with costly actions. Potential areas for the M. niger nest occurrence may be monitored throughout the years until the estimated probability crosses the threshold.
Human-induced disturbance is known as a relevant factor affecting environmental systems [Citation48]. Caiman nesting habitats outside the protected areas can be disturbed by various human activities, such as commercial hunting, mining extraction, agriculture (crops and livestock production), hydropower production, and tourism infrastructure. In such situations, crocodilian nesting tends to be restricted to the areas with relatively little disturbance [Citation49]. In the extreme circumstances, the enormous pressure exerted on the crocodilian nesting sites by human activities may limit the recovery of the wild population [Citation49]. Here, we have not included anthropogenic disturbance into the model because the study area represents a sustainable development reserve (SDR), which is based on the sustainable use of natural resources. In SDRs, it is feasible to combine sustainable harvesting programs with conservation initiatives [Citation5].
In the MSDR, whereas M. niger females stay in the heavily vegetated and difficult to access nesting lakes while moving into the forest at short distances during the HW season [Citation20,Citation50], adult and sub-adult males are often found in the relatively accessible parts of the reserve [Citation50]. The results of previous studies suggested that harvesting sub-adult and adult males had little impact on the reproductive potential of the population due to the polygynous mating system [Citation50–Citation52]. In future studies, predictions can be combined with the information on the characteristics of reproductive population (especially M. niger nesting females) in other areas within the Amazon basin where the development (or maintenance) of proper zones for species conservation and sustainable use is accompanied by creating socio-economic benefits to humans. This information can be obtained from the local communities engaged in caiman hunting [Citation5] or providing basic training and support to local residents [Citation15].
5. Conclusion
Conserving viable populations of M. niger in the Amazon basin on a wide scale remains a challenging task. It requires the identification of priority areas, in which research efforts should be performed. However, to be successful, M. niger conservation initiatives must involve community-based sustainable management programs to provide socio-economic benefits to the local communities. The results of modeling performed in this work revealed that MaxEnt could accurately predict M. niger nest occurrence in the MSDR and efficiently demonstrate the influence of environmental variables on the M. niger nest distribution. The proposed MaxEnt method can be also applied to other areas within the Amazon basin where M. niger populations develop (or maintain) proper zones for species conservation and sustainable use. Predictions can be combined with the information on the distribution of the M. niger reproductive population obtained from the local communities.
Author contributions
FV collected data on M. niger nesting sites. GPRB, GJFB, and FV conceived and designed the study. GPRB, GJFB, CDR, and LCB processed the geographic data. GJFB, CDR, LCB, and EMLMN analyzed the data. GPRB, GJFB, and EMLMN wrote the first draft of the manuscript. GMM, EMA, FV, and BM reviewed and improved the manuscript.
Supplemental Material
Download PDF (10.1 MB)Acknowledgments
The authors are grateful to the Instituto Nacional de Pesquisas Espaciais for the provided logistic support. We would also like to express our gratitude for the classified images provided by J. Ferreira-Ferreira.
Disclosure statement
No potential conflict of interest was reported by the authors.
Supplementary material
Supplemental data for this article can be accessed here.
Additional information
Funding
Notes
1. The interval denoted comprises all the rational numbers that are
and
.
References
- Da Silveira R. Conservação e manejo do jacaré-açu (Melanosuchus niger) na Amazônia brasileira. In: Larriera A, Verdade LM, editors. Conservación y el manejo de caimanes e cocodrilos de América Latina. Piracicaba: C. N. Editoria; 2002. p. 61–78.
- Ross JP. Melanosuchus niger. The IUCN red list of threatened species. 2000. DOI:10.2305/IUCN.UK.2000.RLTS.T13053A3407604.en
- Brazil. Transfer of the Black caiman Melanosuchus niger population of Brazil from Appendix I to Appendix II. CoP 14 Prop. 13. 2007 [cited 2018 May 20]. Available from: https://www.cites.org/sites/default/files/eng/cop/14/prop/E14-P13.pdf
- CITES. The CITES Appendices. 2018 [cited 2018 May 20]. Available from: https://www.cites.org/eng/app/index.php
- Marioni B, Botero-Arias R, Fonseca-Junior SF. Local community involvement as a basis for sustainable crocodilian management in Protected Areas of Central Amazonia: problem or solution? Trop Conserv Sci. 2013;6(4):484–492.
- Somaweera R, Webb JK, Shine R. Determinants of habitat selection by hatchling Australian freshwater crocodiles. PLoS One. 2011;6(12):e28533.
- Franklin J, Miller JA. Species distribution modelling. In: Franklin J, Miller JA, editors. Mapping species distributions. Cambridge: Cambridge University Press; 2009. p. 3–20.
- Hirzel AH, Hausser J, Chessel D, et al. Ecological-niche factor analysis: how to compute habitat-suitability maps without absence data? Ecology. 2002;83(7):2027–2036.
- Pearman PB, Pearman PB, Guisan A, et al. Niche dynamics in space and time. Trends Ecol Evol (Amst). 2007;23(3):149–158.
- Braunisch V, Coppes J, Arlettaz R, et al. Selecting from correlated climate variables: a major source of uncertainty for predicting species distributions under climate change. Ecography. 2013;36(9):971–983.
- Elith J, Phillips SJ, Hastie T, et al. A statistical explanation of MaxEnt for ecologists. Divers Distrib. 2011;17(1):43–57.
- Pearson RG, Raxworthy CJ, Nakamura M, et al. Predicting species distribution from small numbers of occurrence records: a test case using cryptic geckos in Madagascar. J Biogeogr. 2007;34(1):102–117.
- Phillips SJ, Anderson RP, Schapire RE. Maximum entropy modeling of species geographic distributions. Ecol Modell. 2006;190(3–4):231–259.
- Villamarín-Jurado FJ. Ecologia e modelagem da distribuição dos sítios de nidificação do jacaré-açu (Melanosuchus niger) em uma área de várzea da Amazônia Central, Brasil [dissertation]. Manaus, AM: Universidade Federal do Amazonas; 2009.
- Villamarín F, Marioni B, Thorbjarnarson JB, et al. Conservation and management implications of nest-site selection of the sympatric crocodilians Melanosuchus niger and Caiman crocodilus in Central Amazonia, Brazil. Biol Conserv. 2011;144(2):913–919.
- Junk WJ. General aspects of floodplain ecology with special reference to Amazonian floodplains. In: Junk WJ, editor. The Central Amazon floodplain: ecology of a pulsing system. Vol. 126. Berlim: Springer; 1997. p. 3–20.
- Queiroz HL. A RDSM: um modelo de área protegida de uso sustentável. Est Av Dossiê Amazônia, São Paulo. 2005;54:183–204.
- Ramalho EE, Macedo J, Vieira TM, et al. Ciclo hidrológico nos ambientes de várzea da Reserva de Desenvolvimento Sustentável Mamirauá - Médio Solimões, período de 1990 a 2008. Uakari. 2009;5:61–87.
- Ayres JM. As matas de várzea do Mamirauá. In: Mamirauá SC, editor. Estudos de Mamirauá. Brasília: MCT/CNPq; 1993. p. 1–123.
- Thorbjarnarson JB, Da Silveira R. Secrets of the flooded forest. Nat Hist. 2000;109(2):70–79.
- Da Silveira R, Ramalho EE, Thorbjarnarson JB, et al. Depredation by jaguars on caimans and importance of reptiles in the diet of jaguar. J Herpetol. 2010;44(3):418–424.
- IDSM. Banco de dados fluviométrico da Reserva de Desenvolvimento Sustentável Mamirauá. 2018 [cited 2018 Feb 23]. Available from: https://www.mamiraua.org.br/fluviometrico
- Ferreira-Ferreira J, Silva TSF, Streher AS, et al. Combining ALOS/PALSAR derived vegetation structure and inundation patterns to characterize major vegetation types in the Mamirauá Sustainable Development Reserve, Central Amazon Floodplain, Brazil. Wetl Ecol Manag. 2015;23(1):41–59.
- MacKay DJC. An example inference task: clustering. In: MacKay DJC, editor. Information Theory, Inference and Learning Algorithms. New York: Cambridge University Press; 2003. p. 284–292.
- Câmara G, Souza RCM, Freitas UM, et al. SPRING: integrating remote sensing and GIS by object-oriented data modelling. Comp Graph. 1996;20(3):395–403.
- Banon GPR, Arraut EM, Villamarín F, et al. A review on crocodilian nesting habitats and their characterisation via remote sensing. Amphibia-Reptilia. 2019 [cited 2019 Jun 09]; [21]. DOI:10.1163/15685381-20191159
- Banon LC. Árvores de decisão aplicadas à extração automática de redes de drenagem [master’s thesis]. São José dos Campos: Instituto Nacional de Pesquisas Espaciais (INPE); 2013. Available from: http://urlib.net/sid.inpe.br/mtc-m19/2013/12.04.03.56
- Rosim S, Monteiro AMV, Rennó CD, et al. TerraHidro - uma plataforma computacional para o desenvolvimento de aplicativos para a análise integrada de recursos hídricos. In: Epiphanio JCN, Fonseca LMG, editors. Anais …; Simpósio Brasileiro de Sensoriamento Remoto, 11. (SBSR). São José dos Campos: INPE; 2003. p. 2589–2596. Available from: http://urlib.net/ltid.inpe.br/sbsr/2002/11.17.20.15
- Phillips SJ, Dudík M, Schapire RE. A maximum entropy approach to species distribution modeling. In: Proceedingsof the International Conference on Machine Learning, 21; Banff, AB; 2004. p. 655–662.
- Jaynes ET. Information theory and statistical mechanics. Phys Rev. 1957;106(4):620–630.
- Fielding AH, Bell JF. A review of methods for the assessment of prediction errors in conservation presence/absence models. Environ Conserv. 1997;24(1):38–49.
- Phillips SJ. A brief tutorial on MaxEnt. 2018 [cited 2018 Nov 15]. Available from: http://biodiversityinformatics.amnh.org/opensource/maxent/
- Peterson AT, Soberón J, Pearson RG, et al. Evaluating model performance and significance. In: Levin SA, Horn HS, editors. Ecological niches and geographic distributions. Princeton, New Jersey, USA: Princeton University Press; 2011. p. 150–181.
- Efron B. Bootstrap methods: another look at the Jackknife. Ann Stat. 1979;7(1):1–26.
- Turner W, Spector S, Gardiner N, et al. Remote sensing for biodiversity science and conservation. Trends Ecol Evol. 2003;18(6):306–314.
- Hess LL, Melack JM, Affonso AG, et al. Wetlands of the lowland Amazon basin: extent, vegetative cover, and dual-season inundated area as mapped with JERS-1 synthetic aperture radar. Wetlands. 2015;35(4):745–756.
- Silva TSF, Melack J, Streher AS, et al. Capturing the dynamics of Amazonian wetlands using synthetic aperture radar: lessons learned and future directions. In: Tiner RW, Lang MW, Klemas VV, editors. Remote sensing of wetlands. Boca Raton, Florida: CRC Press; 2015. p. 455–472.
- Arraut EM, Marmontel M, Mantovani JE, et al. The lesser of two evils: seasonal migrations of Amazonian manatees in the Western Amazon. J Zool. 2010;280(3):247–256.
- Campos Z. Effect of habitat on survival of eggs and sex ratio of hatchlings of Caiman crocodilus yacare in the Pantanal, Brazil. J Herpetol. 1993;27(2):127–132.
- Cintra R. Nesting ecology of the Paraguayan caiman (Caiman yacare) in the Brazilian Pantanal. J Herpetol. 1988;22(2):219–222.
- Villamarín-Jurado F, Suárez E. Nesting of the Black caiman (Melanosuchus niger) in Northeastern Ecuador. J Herpetol. 2007;41(1):164–167.
- Herron JC, Emmons LH, Cadle JE. Observations on reproduction in the Black caiman, Melanosuchus niger. J Herpetol. 1990;24(3):314–316.
- Weng Q, Lub D, Schubring J. Estimation of land surface temperature-vegetation abundance relationship for urban heat island studies. Remote Sens Environ. 2004;89(4):467–483.
- He KS, Bradley BA, Cord AF, et al. Will remote sensing shape the next generation of species distribution models? Remote Sens Ecol Conserv. 2015;1(1):4–18.
- Geller GN, Halpin PN, Helmuth B, et al. Remote sensing for biodiversity. In: Walters M, Scholes RJ, editors. The GEO handbook on biodiversity observation networks. Cham, Switzerland: Springer Open; 2017. p. 187–200.
- Herron CJ. Population status, spatial relations, growth, and injuries in Black and Spectacled caimans in Cocha Cashu [master’s thesis]. New Jersey, USA: Princeton University; 1985. Submitted in partial fulfillment of the requeriments for the and degree of Bachelor of arts, Departament of Biology and Princeton University.
- Plotkin MJ, Medem F, Mittermeier RA, et al. Distribution and conservation of the Black caiman (Melanosuchus niger). In: Rhodin AGJ, Miyata K, editors. Advances in herpetology and evolutionary biology. Cambridge: Museum of Comparative Zoology; 1983. p. 695–705.
- Guisan A, Thuiller W. Predicting species distribution: offering more than simple habitat models. Ecol Lett. 2005;8(9):993–1009.
- Thorbjarnarson J, Wang X, He L. Reproductive ecology of the Chinese alligator (Alligator sinensis) and implications for conservation. J Herpetol. 2001;35(4):553–558.
- Da Silveira R, Thorbjarnarson JB. Conservation implications of commercial hunting of Black and Spectacled caiman in the Mamirauá Sustainable Development Reserve, Brazil. Biol Conserv. 1999;88(1):103–109.
- Lang JW. Crocodilian behaviour: implications for management. In: Webb GJW, Manolis C, Whitehead PJ, editors. Wildlife management: crocodiles and alligators. Canberra: Surrey Beatty and Sons Pty Limited; 1987. p. 273–294.
- Thorbjarnarson JB. An analysis of the Spectacled caiman (Caiman crocodilus) harvest program in Venezuela. In: Robinson J, Redford K, editors. Neotropical wildlife use and conservation. Chicago: University of Chicago Press; 1991. p. 217–235.