
ABSTRACT
Little is known about distribution patterns of micrometazoan organisms at different spatial scales and the mechanisms driving these patterns across different environments. Here we explore the fine-scale structure of tardigrades in a high-elevation Polylepis forest in northern Ecuador. To investigate spatial patterns of tardigrade abundance, we collected samples from different bryophyte taxa (hosts) on the woodland floor. We identified some tardigrades to species, but most taxa were considered at the level of morphological operational taxonomic units. Tardigrade assemblages differed in composition between host taxa, with some tardigrade taxa associated more with certain hosts, which might relate to host architecture or chemistry. Tardigrade occupancy, richness and abundance varied considerably between samples, and we estimate that more than 50 samples are required to estimate tardigrade taxon richness in this forest habitat. Physical distance between samples was not related to similarity of composition, and it seems that fine-scale differences in environmental conditions (including the distribution of host bryophytes) is much more important in determining tardigrade composition. We conclude that standardised, comprehensive sampling of terrestrial tardigrades at fine scales is necessary before making broader comparisons at coarser geographical scales. Such sampling should account for the diversity of potential hosts, with sufficient replication to capture tardigrade diversity.
KEYWORDS:
Introduction
One of the challenges facing contemporary ecology is understanding biodiversity patterns in microscopic animals [Citation1]. Little is known about the distribution of these organisms over different spatial scales, or the mechanisms driving spatial patterns of abundance in different environments [Citation2–4]. Whilst there are a number of apparently general, scale-related patterns in ecology, such as species-area and species-energy relationships [Citation5–14], it is unclear how much such patterns apply to meiofauna – animals smaller than 2 mm [Citation15]. Since community composition of macroorganisms is easier to describe than that of microscopic organisms, the majority of studies have focused on studying species diversity of such macroorganisms [Citation16–18].
Despite being poorly known in many cases, it is clear that meiofauna can comprise a significant fraction of the biodiversity in many ecosystems and play important roles in ecosystem function, as part of trophic webs, and in energy and nutrient transfer [Citation19–21]. However, despite their abundance and ubiquity, the roles of these organisms are often poorly defined. In fact, even the basic taxonomy of meiofauna and their spatial patterns of abundance remain incompletely known [Citation15]. One of those overlooked groups is the phylum Tardigrada: hydrophilous micrometazoans, normally 50–1200 µm in length, and closely related to arthropods and onychophorans.
Tardigrades represent a convenient meiofaunal group for study. They are relatively abundant in terrestrial, freshwater and marine systems, and might be the most widely distributed invertebrates on Earth [Citation22]. They are potentially interesting ecologically as they share a common evolutionary history with other multicellular animals but have similar environmental needs and biological characteristics to many unicellular organisms [Citation23,Citation24], and can be important in trophic networks (as predators, herbivores and detritivores [Citation25]), and as components of overall biomass [Citation26]. Their frequent ability to enter a dormancy stage provides them with the ability to survive desiccation, significant temperature variations and other extreme conditions [Citation27–31]. In addition, although tardigrade studies are limited practically by processing time (associated with sorting and mounting any microscopic organisms), their taxonomy is relatively well documented and updated checklists taxa and associated keys are regularly published [Citation32,Citation33].
Information about tardigrade distribution patterns comes mostly from information found in taxonomic descriptions, but also from sampling studies at various geographical scales [e.g. Citation34–38]. Some species are apparently observed in many different parts of the world [Citation39], whilst others have only been reported from a single locality [Citation40–42]. It is not clear whether this reflects genuine differences in distribution or merely results from insufficient material, although, in many cases, the latter appears likely. Very few studies have attempted to examine finer-scale tardigrade distribution patterns quantitatively within habitats [Citation20,Citation28,Citation43–45], and how representative these are is unclear. One feature of tardigrades is that they are apparently very variable in abundance at fine spatial scales, which can result in patchy datasets with many samples containing few or no organisms [Citation37]. Meyer [Citation46] and Glime [Citation47], emphasised the importance of pilot studies to determine appropriate sampling strategies in such cases, but few studies have done this, or systematically explored the pattern or its practical consequences in nature [Citation46].
In general, it has been suggested that the distribution of animals of microscopic size is highly influenced by the interaction between macroenvironmental characteristics (climate, soil, etc.,) and micro environmental factors (vegetation, bryophytes and leaf litter). It has been widely proposed that tardigrade distribution is highly influenced by microhabitat conditions [Citation20,Citation43,Citation48]. However, ecological studies at small scales are very limited [Citation20,Citation38] with most focusing on the impact of meso- and macro-scale factors [e.g. Citation34,Citation49]. Although little is known about tardigrade habitat associations [Citation20,Citation43,Citation44], it is commonly assumed that species-specific habitat patterns do exist in these animals [Citation20,Citation40–42,Citation50]. However, many existing studies have concentrated their elevational variations over relatively large spatial scales [Citation50–52] and very few have conducted quantitative sampling or statistical analyses to determine relationships between tardigrade species diversity, abundance and environmental factors [Citation48]. In addition, despite the fact that most studies of tardigrade diversity have focussed on the fauna on mosses and lichens [Citation47], few of these studies have explored the extent to which tardigrade taxa are host specific [Citation43,Citation46,Citation53]. It is not known with certainty whether there is a specific epifaunal association with a particular kind of host, or if most taxa are relative generalists in this regard. Rarer tardigrades may, for example, be associated with specific hosts, but the extent to which this is the case remains unclear.
This study explores fine scale variation in tardigrade assemblages in an Andean Polylepis woodland. We explore whether different bryophyte hosts differ consistently in the species of tardigrade they support, whether there is spatial structure to tardigrade assemblages within a microhabitat type and attempt to estimate the number of samples required to obtain a complete picture of tardigrade diversity at the woodland scale. This is the first such detailed exploration of Andean tardigrades, and indeed one of the first to investigate such factors in these organisms anywhere in the world.
Methods
The study was carried out in a forest consisting almost entirely of trees of Polylepis incana Kunth, located at 3,575 m in the buffer zone of El Ángel Ecological Reserve, Carchi Province in northern Ecuador (). Polylepis is the dominant tree genus in such habitats, where it plays a keystone role close to the Andean treeline [Citation54]. These woodlands occur higher than any others, most commonly on mountain slopes, in deep canyons and ravines, and often in boulder fields or on steep rocky terrain [Citation55,Citation56]. The trees give shelter to several species of epiphytic vascular plants, mosses and lichens, as well as animals, including mammals and birds [Citation55]. The study site experiences very little seasonality as it is close to the Equator, with humid conditions all year round. At the site, average soil surface temperatures ranged between 12–14 ᵒC, but night-time temperatures fell to around 5 ᵒC (Balbina Ramsay, personal observations, 2011). The site was relatively flat with organic soil, decaying wood and leaf litter; the forest floor was grazed by livestock and occasionally visited by tourists from a nearby hotel. Samples were collected in shaded areas, typical of this forest type.
Figure 1. Location of the collection site from Reserva Ecológica El Ángel, Carchi Province in northern Ecuador at 3575 m elevation
On 13 August 2011, we sampled tardigrades living in bryophytes on the ground only. Additional bryophytes were present on the contorted trunks of the trees and on the branches and twigs of the canopy. However, the effective quantification of the complex three-dimensional structure of Polylepis forests and other pertinent environmental variables (e.g. substrate, temperature, pH) was not practical in this study. Without such work, the addition of trunk and canopy sampling would add much unexplainable noise to the composition data, so we restricted the study to the forest floor.
Within an area of 400 m2 in the woodland core, we collected five replicate samples of approximately 4 cm3 uncompressed volume from pure monospecific patches of five bryophyte species (“pure hosts”): Leptodontium longicaule Mitt., Pleurozium schreberi (Brid.) Mitt., Thuidium delicatulum (Hedw.) Schimp., Zygodon nivalis Hampe, and Chiloscyphus latifolius (Nees) J.J. Engel & R.M. Schust. The first four species are mosses and the final species is a liverwort. The growth form and structure of each of these bryophytes is shown in (). We also collected 25 samples from an area of intimately mixed Thuidium delicatulum and Pleurozium schreberi (“mixed host”) at 0.5 m intervals on a grid. In total, 50 samples were collected. No other species of bryophytes were growing on the ground in the sampled area. Samples were air-dried in individual paper envelopes, and stored at 10–25 ᵒC until tardigrades were extracted.
Figure 2. The habit and detailed morphology of the five bryophytes collected in this study: Leptodontium longicaule, Pleurozium schreberi, Thuidium delicatulum, Zygodon nivalis and Chiloscyphus latifolius.
In the laboratory, dried samples were rehydrated in tap water for 16–24 h. Rehydrated samples were shaken and passed through a 38 µm mesh sieve. Material retained by the sieve was searched for tardigrades using a Kyowa SDZ-PL stereoscopic microscope with 30–40x objectives (Kyowa, Japan). Tardigrades were mounted individually on microscope slides under cover slips in Hoyer’s mounting medium. The identification of individual tardigrades was done to Operational Taxonomic Units (OTUs) according to its morphological characters with a Leica DMLB microscope with 40x and 100x objectives (the latter with immersion oil), using Guidetti and Bertolani [Citation32], Marley et al. [Citation57], and Degma [Citation58]. All individuals were first identified to genus using observations of claw type, buccal apparatus and the number of placoids. For genera with several taxa present, individuals were classified into OTUs according to their morphological characteristics. For some genera, a three digit code was used representing, respectively, the number of macroplacoids, the number of microplacoids, and the presence of a septulum (e.g. Adropion sp. 311). Tardigrade taxa were also classified into four feeding groups according to Hallas and Yeates [Citation59], and personal observations of tardigrades by Balbina Ramsay and Nigel Marley (). Individuals of the genus Milnesium were considered strict carnivores. The genera Adropion, Diphascon, Echiniscus, Platicrista, Paramacrobiotus, Pilatobius, Mesocrista and Murrayon were considered to be microbivores. Tardigrades with short, wide buccal tubes with strong stylets and large pharynxes were assumed to be omnivores, while the remaining tardigrades, with furca and apophyses, were considered herbivores.
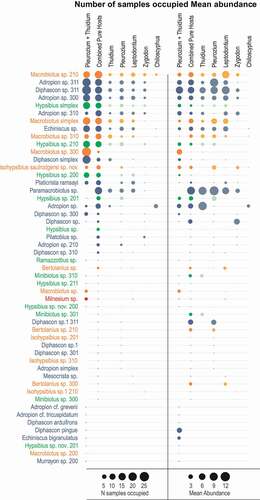
Figure 3. Tardigrade OTUs in 50 samples of bryophytes from a Polylepis woodland at 3575 m in Carchi Province, Ecuador. The area of the circles represents the number of samples occupied (left panel) or the mean abundance within the relevant samples (right panel), with a legend at the foot of each panel. Coloured circles represent a different tardigrade feeding habits, yellow for omnivore, blue for microbivore, green for herbivore and red for carnivore. OTUs named “cf.” and “sp.” followed by a number refer to recognizable morphospecies, some of which are new to science, and are to be described in the future. The “combined pure hosts” columns represents the tardigrades from all the pure host samples added together
Potential differences between host categories in overall tardigrade numbers, OTU richness and Shannon diversity were analysed using one-way General Linear Model (GLM ANOVA) or Kruskall-Wallis Tests, dependent on the outcome of a Shapiro-Wilks Test for normality – the non-parametric test was used for datasets that did not meet ANOVA’s assumptions of normality. These statistical tests were carried out with R version 3.3.3 [Citation60].
Species accumulation curves for tardigrade OTUs richness (S) for pure host and mixed host samples estimated the number of samples needed to fully characterize tardigrade communities. We used Estimate S (Version 9, R.K. Colwell, http://purl.oclc.org/estimates) to plot the cumulative number of OTUs found as a function of sampling effort (species accumulation or rarefaction curves). For sample-based data, the estimator of asymptotic richness was Chao 2 [Citation61,Citation62]. The species accumulation curve was extrapolated to 50 samples (double the number of samples taken in each case, and the maximum extrapolation advised in the software user manual).
The OTU composition of samples was compared using non-metric Multidimensional Scaling (MDS) in performed with Primer 6 (Primer-e, Plymouth, UK), on square-root transformed OTU count data. The graphical output of this approach positions samples with similar composition close together and samples with more different composition further apart. Statistical differences in composition between host categories were determined by permutational ANOVA (PERMANOVA) using the PERMANOVA+ add-on to Primer 6. PERMANOVA is sensitive to differences in the dispersion of data [Citation63] and so an additional test, when significant differences were identified by PERMANOVA, was carried out to identify any significant differences in dispersion between groups, using Primer 6’s PERMDISP.
To determine whether OTU composition (measured as percentage similarity in tardigrade OTU composition of pairs of samples) could be predicted by physical distance between the samples, reduced major axis (RMA or Model II) regression was conducted in R using the package “lmodel2” on the mixed host samples, using a one tailed test [Citation64].
Results
Across all fifty samples (mixed and pure hosts combined), we identified 51 tardigrade OTUs (). Some tardigrades found in this study represent new taxa (e.g. Adropion cf. greveni, A. cf. tricuspidatum, Hypsibius sp. nov. 200, Hypsibius. sp. nov. 201, Isohypsibius saulrodgersi sp. nov. and Isophypsibius sp. 1 210). Macrobiotus 210 is the only taxon present in all bryophyte species examined (pure and mixed). Some rare OTUs observed in this study occurred as single individuals, such as Adropion cf. greveni and A. cf. tricuspidatum.
Forty-three tardigrade OTUs, comprising 692 specimens, were found across the pure host samples (). Individual samples contained 1–74 individuals and up to 16 OTUs. Eutardigrades outnumbered heterotardigrades in abundance (659 vs. 32 individuals) and taxon richness (31 vs. 1 taxa), with just one individual from the apotardigrades. Thirty-three OTUs were found across 648 specimens in the mixed host samples. Individual samples here contained 5–62 individuals and up to 17 OTUs. Eutardigrades again outnumbered heterotardigrades in abundance (620 vs. 25 individuals) and taxon richness (29 vs. 2 taxa), with three individuals from a single apotardigrade taxon. Across all the samples, there were 25 microbivore taxa, 13 omnivore taxa, 12 herbivore taxa and one strict carnivore taxon.
The abundant species were found consistently in most of the hosts (). However, many species – even abundant ones – were not found in the Chiloscyphus host samples. Some species were also missing from the Zygodon host samples. The majority of taxa (61%) were relatively sparse in the samples, occurring in low numbers in a one or few samples.
Tardigrade abundance was higher in pure host samples than in mixed host samples (). Mixed host samples had the highest OTU richnesses. Pure host samples of Pleurozium schreberi had the highest abundances and diversity indices whilst Chiloscyphus had the lowest in all three cases (respectively: Shapiro Wilks p ≤ 0.001, Kruskal Wallis df = 5, X2 = 28.315, p < 0.001; Shapiro Wilks p = 0.011, Kruskal Wallis df = 5 X2 = 25.428, p < 0.001; Shapiro Wilks p = 0.848, ANOVA F₅,₄₄ = 15.743, p < 0.001; ). The other hosts had intermediate levels of these descriptors.
Table 1. Descriptors of tardigrade communities in host samples: N = total number of tardigrades, Overall S = total number of OTUs in all samples, S = mean ± sd number of OTUs, and H’ = mean ± sd Shannon Index based on OTUs. Means sharing a letter within a column were not significantly different
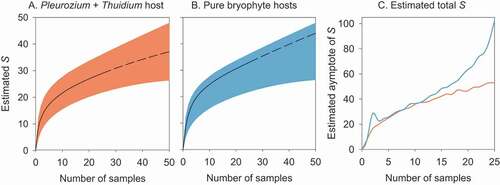
The sample-based rarefaction curves for 25 mixed host and 25 pure host samples did not reach asymptotes of OTU accumulation, not even when extrapolated to 50 samples in each case (). The complete overlap of 95% confidence intervals for the rarefaction curves indicate that no significant differences in OTU accumulation exist between the mixed host and pure host samples.
Figure 4. Species accumulation curves for tardigrades species richness (S) on the floor of a Polylepis woodland in the north of Ecuador: (A) a mixed substrate of Pleurozium and Thuidium (n = 25); and (B) five samples each from pure substrates of five different bryophyte species (total n = 25). The continuous line represents the sample-based rarefaction curve for the data set (25 samples), while the dashed line represents the predicted rarefaction curve for up to 50 samples. The shaded areas are bounded by the upper and lower 95% confidence limits for the estimates. (C) Estimates of the species richness asymptote for mixed Pleurozium and Thuidium samples (orange) and pure bryophyte hosts (blue), using the Chao2 estimator
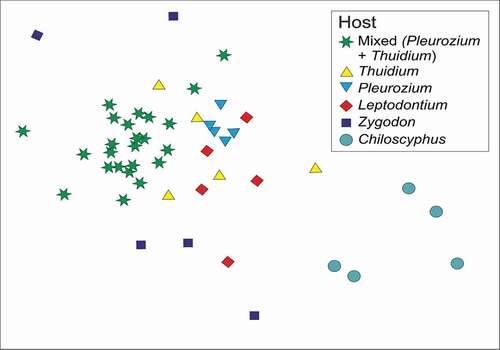
All host pairings had significantly different tardigrade compositions (PERMANOVA, p = 0.001 to 0.049), except between Leptodontium and Zygodon (p = 0.123; and ). The dispersion of Zygodon samples in the analysis was much greater than that of the other samples (PERMDISP p = 0.011); and the other samples were not significantly different. For interest, the similarity in distributions of OTUs across samples is depicted in Supplementary Material (Figure SM1).
Table 2. Similarity in tardigrade OTU composition within and between sample types. Diagonals in bold text represent percentage similarity within host samples. The values below the diagonal represent percentage similarity between pairs of host samples. The p-values, above the diagonal, show the significance of pairwise Permutational MANOVA tests
Figure 5. MDS ordination of host samples, based on tardigrade OTU composition, for mixed (Pleurozium + Thuidium) and pure hosts. Samples located close together in the figure had similar compositions of tardigrades, whereas those further apart were more different in composition
There was no significant relationship between physical distance and tardigrade composition in the mixed host samples (RMA regression R2 = 0.006; p = 0.098; ).
Figure 6. Relationship between physical distance between pairs of mixed host (Pleurozium + Thuidium) samples and their similarity of tardigrade composition
Discussion
Tardigrade abundance and species richness varied considerably between the samples, a pattern that has been shown in the relatively few other studies that have sampled tardigrades quantitatively [Citation20,Citation45,Citation46,Citation65]. In general, bryophyte samples of tardigrades are known to vary in the number of individuals and species richness [Citation49,Citation66]. However, it is difficult to compare tardigrade diversity across different studies where sampling has not been standardised, or even properly described. It would be useful for studies collecting quantitative data on tardigrade composition to describe their methods in detail. Furthermore, despite the practical difficulties in standardising samples of complex, three-dimensional host organisms, we propose that sampling should aim to collect consistent volumes of uncompressed host material. In our study, a standardised sample for bryophytes (mosses, hepatics and liverworts) and lichens of the equivalent of a sphere approximately 4 cm diameter, which represents approximately 4 cm3 in volume, provided sufficient sampling effort to identify differences between sample groups, but without overwhelming processing effort in the laboratory. Young et al. [Citation43] used a similar sample size to compare successfully the composition and diversity of tardigrade, rotifer and nematode communities in Douglas-fir tree canopies in California.
In our samples, eutardigrades were high in OTU richness while heterotardigrades presented low richness. This matches patterns found in quantitative studies of tardigrades in central Spain [Citation20,Citation28]. Eutardigrade diversity is often highest in humid environments, while heterotardigrades are most diverse in drier conditions [Citation20,Citation41,Citation67,Citation68]. In some previous quantitative studies of tardigrades, heterotardigrades have been found to be more abundant than eutardigrades e.g. [Citation20,Citation28,Citation48],, though the relative abundances of these Classes vary considerably [Citation33,Citation47,Citation49,Citation66]. In contrast, our samples from Polylepis forest had more individuals belonging to the Eutardigrada than the Heterotardigrada. Polylepis forests in Ecuador are very humid environments [Citation69], where a higher overall abundance of individuals of Eutardigrada might be favoured, given the higher taxon richness of this class in humid habitats more generally.
Macrobiotus species were abundant in most samples, and this genus is one of the most common residents of bryophytes worldwide [Citation39,Citation47,Citation70]. Other tardigrades with a global distribution were also common in our samples, such as Diphascon, Hypsibius and Paramacrobiotus [Citation71]. Interestingly, several OTUs of Bertolanius were present in the samples. This genus has been considered a Holarctic genus [Citation72], but this study extends the presence of the genus into the equatorial mountains of South America. Apart from the biogeographical patterns of genera, it is difficult to compare the tardigrade composition of Polylepis forest in more detail because there are so few studies of tardigrade assemblages.
Some tardigrade taxa in our forest samples were sparse, in that they occurred in very low numbers (e.g. Adropion cf. greveni, Adropion cf. tricuspidatum, Diphascon arduifrons, Echiniscus bigranulatus). Many other reports of tardigrade sampling have found sparse taxa [Citation73]. In general, there are several different forms of sparsity [Citation74], and therefore several different potential explanations for the low abundance and occupancy of taxa in our samples. The potential explanations include fluctuating resources limiting tardigrade numbers, poor resources offered by the host, and the rarity of specific microenvironmental conditions and habitats [Citation74]. Tardigrade numbers can also be reduced by disease, parasitism, predation (sometimes by other tardigrades [Citation75]), and interactions with other meiofauna, including tardigrades [Citation76]. Furthermore, although cryptobiosis helps tardigrades to survive adverse conditions, it is energetically costly and is known to limit reproduction [Citation77,Citation78].
Some taxa were clearly associated more with some hosts than others. The physical structure and chemical composition of particular hosts might determine the abundance of tardigrades. Tardigrades were more abundant and diverse in mosses from the Polylepis woodland floor than in the liverwort. Mosses are more structurally complex than liverworts, growing vertically or horizontally, and forming mats or cushions [Citation79]. Thus, the more complex three-dimensional structures of the mosses in our study might provide conditions for a wider number, and potentially a greater diversity, of tardigrades than the simpler structures of the liverwort, Chiloscyphus – in a similar way to that suggested for terrestrial and freshwater invertebrates. Suzuki [Citation78] also found that some tardigrades were favoured by the intricate structure of mosses.
However, the relationship between structural complexity of the host and the abundance and diversity of tardigrades is not a simple one. In our study, Pleurozium had the highest abundance and diversity, and whilst the structurally simple Chiloscyphus had the lowest, other hosts were intermediate (including the combined samples of Pleurozium and Thuidium). Zygodon had the lowest tardigrade abundance and diversity of the mosses in this study, but the samples varied in the tardigrade taxa that were present (though drawn from a similar pool to that of Pleurozium and Thuidium). Host structural complexity occurs at different scales, with distinct structural elements, and the interaction of these structural characteristics is likely be more important than any one feature alone.
Although pure Thuidium samples had similar numbers and diversity of tardigrades compared with the mixed Pleurozium and Thuidium samples, pure Pleurozium samples had significantly higher tardigrade numbers and diversity. This is contrary to the expectation that more abundant and diverse communities should be found within more diverse habitats [e.g. Citation80]. If a strong relationship exists between the amount of Pleurozium in a sample and the abundance of tardigrades, then the presence of Thuidium in the standardized mixed host samples might dilute Pleurozium’s influence on the abundance and diversity of tardigrades. Even at better-studied scales, where habitat diversity can complement species diversity and influence multifunctionality in ecosystems, the relationship is complex and further consideration of habitat and species diversity together is needed [Citation81]. This seems true for tardigrade-host relationships too.
The hosts provide different structural and micro-environmental habitats for tardigrades (see ). Although Pleurozium and Thuidium have a similar pleurocarpus form, Thuidium has much smaller leaves arranged tightly around the stem. Zygodon and Leptodontium appear structurally similar at a coarse scale, but Zygodon has dense fine hairs (rhizoids) covering the stem. In a study of a Swedish spruce forest floor, Jönsson [Citation36] found Pleurozium schreberi had only intermediate levels of tardigrade abundance and species richness, with two other pleurocarpous bryophytes having the highest levels; the lowest levels were associated with cushions of Polytrichum formosum (with an acrocarpous habitat similar to Zygodon in our study). It is not clear to what extent the structural characteristics of hosts affect the abundance and diversity of tardigrades within them, but further exploration of this aspect would be worthwhile.
Chiloscyphus, along with other liverworts, has oil bodies within the leaves that might represent a form of chemical defence against herbivory [Citation82,Citation83]. Chiloscyphus had the lowest tardigrade abundance and diversity in our study. Certain bryophytes also deter herbivores with phenolic compounds [Citation84]. Among the mosses sampled in this study, Pleurozium schreberi has a reportedly higher content of phenolic compounds than Thuidium delicatulum [Citation83], but we found Pleurozium had the highest tardigrade abundance and diversity, across a wide range of taxa. This suggests that phenolic content is not the only factor influencing tardigrade occupancy.
Only a few studies have looked for an association between tardigrades and their hosts but the results have been mixed. Bertolani’s [Citation85] study found that hosts were not important, whilst other studies have reported that particular tardigrades were linked to specific hosts [Citation86–88]. Drawing conclusions from these studies is difficult because of the great variability in occupancy from sample to sample: often it is not clear from low sampling effort whether these animals show real preferences between hosts or just stochastic differences in sampled occupancy.
We found more microbivore OTUs than any other feeding group, with omnivore and herbivores being found in almost equal numbers. Only one strictly carnivorous tardigrade taxon was present in our samples, but did not impact on the number of herbivores. However, the presence of only one strict carnivore but thirteen omnivores suggests that the ability to utilise a varied diet, including plants, might be favoured in the Polylepis forest. Guil and Sanchez-Moreno [Citation28] is the only other study to date to consider trophic groups in natural tardigrade assemblages, but was limited by a relatively small number of samples from leaf litter in central Spain and categorised tardigrades into three feeding groups. In most of these samples, carnivores (+ omnivores) were the most species rich trophic group, followed by herbivores, whilst microbivores were the least species rich. Given that the coarse- and fine-scale habitats were quite different, it is not surprising that our results contrast markedly with their study. More attention to tardigrade feeding groups would be useful to build an understanding of the biotic and abiotic factors that drive their relative abundances.
An important finding of this study was the very high sample effort that was required to estimate tardigrade OTU richness: more than 50 samples would apparently be needed to do this with confidence. Comparing sites and studies only makes sense if an appropriate threshold for effective sampling is met. It is not clear whether the requirement of more than 50 samples suggested by our study is typical of that needed to sample tardigrades in other habitats. This is such a fundamental issue that similar studies in other habitats are urgently required, as part of a wider effort to find effective ways to estimate tardigrade diversity at different scales that is accurate, practical and feasible [Citation46]. Furthermore, for taxonomic studies, greater sampling effort would be more likely to provide the number of individuals needed for the description of new species. Based on a detailed study of several tardigrade species, Stec et al. [Citation89] found that 6–40 individuals of each species were required to adequately estimate mean morphological measurements of characteristic anatomical structures. Several species in our study did not reach these numbers, even with 50 samples.
In recent years, much effort has been dedicated to analysing patterns of biodiversity for microscopic organisms through the analysis of distance-decay relationships, taxon-area relationships, and local: global taxon richness ratios. Despite this attention, patterns of micro-organism diversity at continental and global scales are still unclear [Citation2]. Studies at finer scales can complement those broader studies [Citation16]. In our samples from widely distributed bryophytes, OTU assemblages were not driven by physical distance over small scales, and did not show spatially predictable patterns at this scale. Thus, it seems that fine-scale differences in environmental conditions (including the distribution of host bryophytes) is much more important in determining tardigrade composition than distance. In other words, the composition of tardigrades in a forest can vary as much between neighbouring bryophytes as between more distant ones.
Conclusions
This work adds to a small number of comparable quantitative studies of tardigrade assemblages at fine scales [Citation20,Citation45,Citation46,Citation65]. The sparsity of some taxa and the variability in numbers from sample to sample, suggest that caution is required in interpreting results from studies which rely on a handful of samples from a locality. Using samples standardised to approximately 4 cm3, our study clearly showed that more than 50 samples are required to estimate tardigrade diversity effectively in Polylepis forest. We therefore propose that future quantitative studies should standardize their sample sizes and use appropriate levels of replication to capture local tardigrade biodiversity (and report in detail the precise sampling strategy used). More studies are required to show whether our requirement of more than 50 samples is typical of other habitats. Some tardigrades were restricted to certain hosts, and so collecting from a range of different hosts is also recommended in order to obtain a representative picture of tardigrade diversity.
Disclosure of potential conflicts of interest
No potential conflict of interest was reported by the author(s).
Supplemental Material
Download MS Word (1.1 MB)Acknowledgments
We are grateful to the QCA Herbarium, the QZNE Museum at the Pontificia Universidad Católica del Ecuador, and the Ecuadorian Ministry of the Environment for the permits to collect the sample material used in this study: Scientific Investigation Authorisation Patent No. 10-2010-FLO-DPAP-MA and Patent No. 009-2015-FAU-DPAP-MA. David Suarez Duque and Segundo Chimbolema provided logistical help in the field.
Supplementary material
Supplemental data for this article can be accessed here.
Additional information
Funding
Related Research Data
References
- Prosser JI, Bohannan BJM, Curtis TP, et al. The role of ecological theory in microbial ecology. Nature Rev Microbiol. 2007;5(5):384–392.
- Green JL, Holmes AJ, Westoby M, et al. Spatial scaling of microbial eukaryote diversity. Nature. 2004;432(7018):747–750.
- Fierer N, Jackson RB. The diversity and biogeography of soil bacterial communities. Proc Natl Acad Sci U S A. 2006;103(3):626–631.
- Fontaneto D. Long-distance passive dispersal in microscopic aquatic animals. Mov Ecol. 2019;7(1):10.
- Lawton JH. Are there general laws in ecology? Oikos. 1999;84(2):177–192.
- Rosenzweig ML. Species diversity in space and time. Cambridge: Cambridge University Press; 1995.
- Andrew NR, Rodgerson L, Dunlop M. Variation in invertebrate-bryophyte community structure at different spatial scales along altitudinal gradients. J Biogeograph. 2003;30(5):731–746.
- Brehm G, Sussenbach D, Fiedler K. Unique elevational diversity patterns of geometrid moths in an Andean montane rainforest. Ecography. 2003;26(4):456–466.
- McAbendroth L, Ramsay PM, Foggo A, et al. Does macrophyte fractal complexity drive invertebrate diversity, biomass and body size distributions? Oikos. 2005;111(2):279–290.
- Bonn A, Storch D, Gaston KJ. Structure of the species-energy relationship. Proc R Soc B. 2004;271(1549):1685–1691.
- Davies TJ, Savolainen V, Chase MW, et al. Environmental energy and evolutionary rates in flowering plants. Proc R Soc B. 2004;271(1553):2195–2200.
- Dimitrakopoulos PG, Schmid B. Biodiversity effects increase linearly with biotope space. Ecol Lett. 2004;7(7):574–583.
- Rahbek C. The role of spatial scale and the perception of large-scale species-richness patterns. Ecol Lett. 2005;8(2):224–239.
- Gaston KJ, Davies RG, Gascoigne CE, et al. The structure of global species–range size distributions: raptors & owls. Global Ecol Biogeogr. 2005;14(1):67–76.
- Fontaneto D, Ficetola GF, Ambrosini R, et al. Patterns of diversity in microscopic animals: are they comparable to those in protists or in larger animals? Global Ecol Biogeogr. 2006;15(2):153–162.
- Green J, Bohannan BJM. Spatial scaling of microbial biodiversity. Trends Ecol Evol. 2006;21(9):501–507.
- Nemergut DR, Costello EK, Hamady M, et al. Global patterns in the biogeography of bacterial taxa. Environ Microbiol. 2011;13(1):135–144.
- Feinstein LM, Blackwood CB. Taxa-area relationship and neutral dynamics influence the diversity of fungal communities on senesced tree leaves. Environ Microbiol. 2012;14(6):1488–1499.
- Sohlenius B, Bostrom S, Jonsson KI. Occurrence of nematodes, tardigrades and rotifers on ice-free areas in East Antarctica. Pedobiologia. 2004;48(4):395–408.
- Guil N, Sanchez-Moreno S, Machordom A. Local biodiversity patterns in micrometazoans: are tardigrades everywhere? Syst Biodivers. 2009;7(3):259–268.
- Schill RO. Water bears: the biology of tardigrades. Cham: Springer; 2018.
- Guidetti R, Altiero T, Marchioro T, et al. Form and function of the feeding apparatus in Eutardigrada (Tardigrada). Zoomorphology. 2012;131(2):127–148.
- Guil N, Giribet G. A comprehensive molecular phylogeny of tardigrades—adding genes and taxa to a poorly resolved phylum-level phylogeny. Cladistics. 2012;28(1):21–49.
- Goldstein B. The emergence of the tardigrade hypsibius exemplaris as a model system. Cold Spring Harb Protoc. 2018;2018(11): pdb.emo102301.
- Nelson DR, Bartels PJ, Guil N. Tardigrade ecology. In: Schill RO, editor. Water bears: the biology of tardigrades. Cham: Springer; 2018. p. 163–210.
- Jennings PG. Tardigrada from the antarctic peninsula and scotia ridge region. Br Antarct Surv Bull. 1976;44:77–96.
- Rebecchi L, Altiero T, Guidetti R, et al. Tardigrade resistance to space effects: first results of experiments on the LIFE-TARSE mission on FOTON-M3 (September 2007). Astrobiology. 2009;9(6):581–591.
- Guil N, Sanchez-Moreno S. Fine-scale patterns in micrometazoans: tardigrade diversity, community composition and trophic dynamics in leaf litter. Syst Biodivers. 2013;11(2):181–193.
- Jönsson KI, Harms-Ringdahl M, Torudd J. Radiation tolerance in the eutardigrade Richtersius coronifer. Int J Radiat Biol. 2005;81(9):649–656.
- Horikawa DD, Sakashita T, Katagiri C, et al. Radiation tolerance in the tardigrade Milnesium tardigradum. Int J Radiat Biol. 2006;82(12):843–848.
- Horikawa DD, Kunieda T, Abe W, et al. Establishment of a rearing system of the extremotolerant tardigrade Ramazzottius varieornatus: a new model animal for astrobiology. Astrobiology. 2008;8(3):549–556.
- Guidetti R, Bertolani R. Tardigrade taxonomy: an updated check list of the taxa and a list of characters for their identification. Zootaxa. 2005;845(1):1–46.
- Degma P, Bertolani R, Guidetti R. Actual checklist of Tardigrada species (2009-2019, 35th Edition: 31-07-2019)2019. 2020 May 15. Accessed: 8 January 2021. Available from: http://www.tardigrada.modena.unimo.it/miscellanea/Actual%20checklist%20of%20Tardigrada.pdf
- Dastych H. The Tardigrada of Poland. Monografie fauny Polski. 1988;16:1–225.
- Nelson DR Ecological distribution of Tardigrada on Roan Mountain, Tennessee-North Carolina. Memorie dell’Istituto Italiano di Idrobiologia. 32;225–276.
- Jönsson KI. Population density and species composition of moss‐living tardigrades in a boreo‐nemoral forest. Ecography. 2003;26(3):356–364.
- Zawierucha K, Smykla J, Michalczyk Ł, et al. Distribution and diversity of Tardigrada along altitudinal gradients in the Hornsund, Spitsbergen (Arctic). Polar Res. 2015;34(1):24168.
- Zawierucha K, Węgrzyn M, Ostrowska M, et al. Tardigrada in Svalbard lichens: diversity, densities and habitat heterogeneity. Polar Biol. 2017;40(7):1385–1392.
- McInnes SJ, Chown SL, Dartnall HJG, et al. Milnesium cfr. tardigradum (Milnesiidae, Apochela, Tardigrada): a monitor of high altitude meiofauna on sub-Antarctic Marion Island. Zoologischer Anzeiger. 2001;240(3–4):461–465.
- Bertolani R, Rebecchi L. The tardigrades of Emilia (Italy) .2. Monte Rondinaio. A multihabitat study on a high altitude valley of the northern Apennines. Zool J Linn Soc. 1996;116(1–2):3–12.
- Ito M. Ecological distribution, abundance and habitat preference of terrestrial tardigrades in various forests on the northern slope of Mt. Fuji, Central Japan. Zool Anz. 1999;238(3–4):225–234.
- Guidetti R, Bertolani R. The tardigrades of Emilia (Italy). III. Piane di Mocogno (Northern Apennines). Zoologischer Anzeiger. 2001;240(3–4):377–383.
- Young AR, Miller JED, Villella J, et al. Epiphyte type and sampling height impact mesofauna communities in Douglas-fir trees. PeerJ. 2018;6:e5699.
- Hallas TE. Habitat preference in terrestrial tardigrades. Ann Zool Fenn. 1978;15(1):66–68.
- Zawierucha K, Buda J, Fontaneto D, et al. Fine-scale spatial heterogeneity of invertebrates within cryoconite holes. Aquat Ecol. 2019;53(2):179–190.
- Meyer HA. Small-scale spatial distribution variability in terrestrial tardigrade populations. Hydrobiologia. 2006;558(1):133–139.
- Glime JM. Tardigrade densities and richness. In: Glime JM editor, Bryophyte Ecology. Volume 2. Bryological Interaction. Vol. 2. Houghton, Michigan: Michigan Technological University and the International Association of Bryologists; 2017. p. 5.5.1–5.5.20. http://digitalcommons.mtu.edu/bryophyte-ecology
- Guil N, Hortal J, Sanchez-Moreno S, et al. Effects of macro and micro-environmental factors on the species richness of terrestrial tardigrade assemblages in an Iberian mountain environment. Landscape Ecol. 2009;24(3):375–390.
- Kathman RD, Cross SF. Ecological distribution of moss-dwelling tardigrades on Vancouver Island, British-Columbia Canada. Can J Zool. 1991;69(1):122–129.
- Guidetti R, Bertolani R, Nelson DR. Ecological and faunistic studies on tardigrades in leaf litter of beach forests. Zoologischer Anzeiger. 1999;238(3–4):215–223.
- Collins M, Bateman L. The ecological distribution of tardigrades in Newfoundland. Zoologischer Anzeiger. 2001;240(3–4):291–297.
- Bartǒs E. Die Tardigraden der Tschechoslawa kischen Republik. Zoologischer Anzeiger. 1939;125:138–142.
- Jonsson KI. Population density and species composition of moss-living tardigrades in a boreo-nemoral forest. Ecography. 2003;26(3):356–364.
- Fjeldså J. Polylepis forests—vestiges of a vanishing ecosystem in the Andes. Ecotropica. 2002;8(2):111–123.
- Kessler M. The Polylepis problem: where do we stand? Ecotropica. 2002;8:97–110.
- Kessler M, Toivonen JM, Sylvester SP, et al. Elevational patterns of Polylepis tree height (Rosaceae) in the high Andes of Peru: role of human impact and climatic conditions. Front Plant Sci. 2014;5:194.
- Marley NJ, McInnes SJ, Sands CJ. Phylum Tardigrada: a re-evaluation of the Parachela. Zootaxa. 2011;2819(1):51–64.
- Degma P. Notes to the species composition of the genus Paramacrobiotus (Tardigrada, Eutardigrada, Macrobiotidae). Zootaxa. 2013;3681(1):96–98.
- Hallas TE, Yeates GW. Tardigrada of the soil and litter of Danish beech forest. Pedobiologia. 1972;12:287–304.
- R Core Team. R: a language and environment for statistical computing; 2020 Vienna: R Foundation for Statistical Computing. https://www.R-project.org. [Accessed: 8 January 2021]
- Chao A. Nonparametric estimation of the number of classes in a population. Scand J Stat. 1984;11(4):265–270.
- Chao A. Estimating the population size for capture-recapture data with unequal catchability. Biometrics. 1987;43(4):783–791.
- Anderson MJ, Gorley RN, Clarke KR. PERMANOVA+ for primer: guide to software and statistical methods. Plymouth: PRIMER-E; 2008.
- Legendre P lmodel2: model II regression; R package version 1.7-3. 2018 [Accessed: 8 January 2021] https://CRAN.R-project.org/package=lmodel2
- Kaczmarek Ł, GoŁdyn B, WeŁnicz W, et al. Ecological factors determining Tardigrada distribution in Costa Rica. J Zool Syst Evol Res. 2011;49(s1):78–83.
- Maucci W. Analisi preliminari di alcuni dati statistici sulla ecologia dei tardigradi muscicoli. Boll Mus Civico Naturale Verona. 1980;7:1–47.
- Bertolani R, Manicardi G, Gibertoni D. Tardigradi della Riserva naturale di Torricchio e dei Monti Sibillini (Marche, Italia). La riserva naturale del Torricchio. 1987;7:15–34.
- Ito M. Taxonomic study on the class Heterotardigrada (Tardigrada) from the northern slope of Mt. Fuji, Central Japan. Edaphologia. 1993;50:1–13.
- Richardson BA, Richardson MJ, Soto‐Adames FN. Separating the effects of forest type and elevation on the diversity of litter invertebrate communities in a humid tropical forest in Puerto Rico. J Anim Ecol. 2005;74(5):926–936.
- Schuster R, Greven H. A long-term study of population dynamics of tardigrades in the moss Rhytidiadelphus squarrosus (Hedw.) Warnst. J Limnol. 2007;66(1s):141–151.
- Pilato G, Sperlinga G. Tardigradi muscicoli di Sardegna. Animalia. 1975;2:79–90.
- Hansen JG, Kristensen RM, Bertolani R, et al. Comparative analyses of Bertolanius species (Eohypsibiidae; Eutardigrada) with the description of Bertolanius birnae sp. nov. from northern polar region. Polar Biol. 2017;40(1):123–140.
- Ramazzotti G, Maucci W. II phylum Tardigrada. III edizione riveduta e aggiornata. Memorie dell’Istituto Italiano di Idrobiologia Dott. Marco De Marchi. 1983;41:1–1012.
- Rabinowitz D. Seven forms of rarity. In: Synge H, editor. The biological aspects of rare plant conservation. Surrey, England: John Wiley & Sons Ltd; 1981. p. 205–217.
- Kinchin IM. The biology of tardigrades. London: Portland Press; 1994.
- Sohlenius B, Bostrom S. Patch-dynamics and population structure of nematodes and tardigrades on Antarctic nunataks. Eur J Soil Biol. 2006;42: S321–S325.
- McInnes S. Zoogeographic distribution of terrestrial/freshwater tardigrades from current literature. J Nat Hist. 1994;28(2):257–352.
- Suzuki AC. Life history of Milnesium tardigradum Doyere (Tardigrada) under a rearing environment. Zoolog Sci. 2003;20(1):49–57.
- Gradstein SR, Churchill SP, Salazar-Allen N. Guide to the bryophytes of tropical America. Vol. 86. New York: (Memories of the New York Botanical Garden); 2001.
- Larjavaara M. A review on benefits and disadvantages of tree diversity. Open for Sci J. 2008;1:24–26.
- Alsterberg C, Roger F, Sundbäck K, et al. Habitat diversity and ecosystem multifunctionality—The importance of direct and indirect effects. Sci Adv. 2017;3(2):e1601475.
- Asakawa Y. Phytochemistry of bryophytes. In: Romeo JT, editor. Phytochemicals in human health protection, nutrition, and plant defense. New York: Springer; 1999. p. 319–342.
- Glime J. Bryophytes and herbivory. Cryptogam Bryol. 2006;27(1):191–203.
- Swain T, Hillis WE. The phenolic constituents of Prunus domestica. I.—The quantitative analysis of phenolic constituents. J Sci Food Agric. 1959;10(1):63–68.
- Bertolani R. Tardigradi muscicoli delle dune costiere Italiane, con descrizione di una nuova specie. Atti Soc Toscana Sci Nat. 1983;90:139–148.
- Degma P, Pecalkova M. First records of Tardigrada in Slovakia from Stuzica National Nature Reserve (Bukovske vrchy Mts, NE Slovakia). Biologia. 2003;58(2): 274-274.
- Degma P. First records of six Hypsibiidae species (Tardigrada, Eutardigrada) in Slovakia. Biologia. 2003;58(5):1003–1005.
- Degma P. First records of two Heterotardigrada (Tardigrada) species in Slovakia. Biologia. 2006;61(5):501–502.
- Stec D, Gąsiorek P, Morek W, et al. Estimating optimal sample size for tardigrade morphometry. Zool J Linn Soc. 2016;178(4):776–784.