
ABSTRACT
Primary productivity (PP) is a vital oceanographic process generated by photoautotrophic organisms that transform inorganic carbon into organic macronutrients and micronutrients via photosynthesis. While in situ studies have shed light onto the spatial and seasonal variations of chlorophyll a (Chl a) concentration, and thus PP, in specific study sites, there are no comprehensive monitoring programs to assess its long-term variation nor its seasonal patterns in broader areas of coastal Ecuador. The main objective of the present study is to evaluate changes in Chl a concentration along the coast of Ecuador and examine how these changes correspond to changes in Sea Surface Temperature (SST). Eighteen offshore and nearshore sampling sites along the Ecuadorian coast were studied over 15 years, using satellite measurements of MODIS-Aqua and MUR. Results show mean Chl a concentration in coastal Ecuador is rather low (1.5 mg m−3) in comparison with other oceanic regions. Puerto Bolivar, Gulf of Guayaquil and Esmeraldas were characterized by the highest mean Chl a concentration; while Galera San Francisco Marine Reserve, Cojimies and Cabuyal were characterized by the lowest. A positive trend in Chl a concentration was detected at the southernmost (Puerto Bolivar and Gulf of Guayaquil) and northernmost (Esmeraldas) study sites, with a seasonal trend following the observed seasonal SST trend. Chl a is high in areas under the influence of both the Humboldt upwelling system and river discharge. The positive correlation between Chl a and SST is likely a response to increased precipitation during warmer months. These results highlight the importance of improving our understanding of the effects of climate change on coastal PP, and the potential for these effects to influence the health of commercial and threatened marine species. Further research should assess the implications of changes in PP and SST for species of commercial and conservation importance along the coast of Ecuador.
Introduction
Primary productivity (PP) is a vital oceanographic process generated by photoautotrophic organisms that transform inorganic carbon into organic macronutrients and micronutrients via photosynthesis [Citation1,Citation2]. PP is commonly measured as the concentration of chlorophyll a (Chl a, mg m−3), as it is the main photosynthetic pigment present in primary producers (microalgae, macroalgae and macrophytes) [Citation3,Citation4]. Oceanic PP constitutes around 50% of the net carbon production per year of the biosphere [Citation5]. Worldwide, diatoms contribute approximately 50% of total primary production, followed by coccolithophorids and chlorophytes with a contribution of 20% each, and cyanobacteria with a contribution of 10% [Citation6]. Phytoplankton plays a fundamental role in the structuring of marine food webs, by synthesizing and incorporating matter and energy to consumers of higher trophic levels [Citation7]. In addition, phytoplankton strongly influences the biogeochemical cycles of carbon, nitrogen, phosphorus and silicon [Citation8]. For example, marine cyanobacteria are the organisms responsible for the fixation of 45% of atmospheric nitrogen (9.5×10¹² mol N year−1) to dissolved organic nitrogen [Citation9].
The spatial and seasonal dynamic of PP is influenced by physical processes, such as oceanic circulation, upwelling, ocean fronts, sea surface temperature (SST), solar incidence, stratification of the water column and concentration of nutrients [Citation10], and by biological processes, such as grazing and absorption capacity of light by photoautotrophic organisms [Citation11]. For example, in polar zones the annual phytoplankton biomass is higher in spring, due to the increase in solar radiation. In tropical zones, the annual concentration of Chl a is higher during the winter (October–January), when the mixture of winds and thermal convection replenishes the euphotic zone with nutrients [Citation12]. In the same way, PP is also conditioned by continental fluvial output and runoff [Citation13], due to the amount of nutrients and organic matter that is introduced into coastal waters [Citation14]. The trophic role of phytoplankton causes it to be sensitive to climatic variations such as El Niño Southern Oscillation (ENSO) effects, such as eutrophication and acidification of the oceans [Citation15,Citation16], and global warming [Citation17]. Since the early 1980s, annual primary production in the oceans has decreased by 6.3% and has been most evident at high latitudes [Citation18]. This decrease is linked to the increase in ocean SST and the reduced supply of nutrients, specifically iron [Citation19]. The alteration of the structure of oceanic phytoplankton biomass has important negative effects in the maintenance and conservation of marine biodiversity and sustainable management of the fishing industry [Citation20].
The Ecuadorian coastal current system is influenced by geomorphological features (beaches, bays, gulfs, estuaries, rocky coasts, cliffs and mangroves) [Citation21] and unique oceanographic conditions (winds, marine currents, coastal outcrops and the equatorial front) [Citation22]. From December to May, the Panama Current brings warm and oligotrophic waters from Central America down to Ecuador and off to the equatorial region; while from June to November, Humboldt Current carries cold high-nutrient waters originated in the coast of Peru [Citation23,Citation24]. These two currents remain separated by a complex transition system called the Equatorial Front (EF) [Citation25]. No significant upwelling events occur in Ecuadorian waters when comparing to the neighboring Humboldt upwelling system found in coastal Peru, although the later can influence the southern region of Ecuador during strong upwelling events [Citation26]. The coast of Ecuador is also characterized by the appearance of ENSO [Citation27]. During the “El Niño” (EN) the equatorial front is pushed southward, and hot air masses increased producing high levels of precipitation along Ecuador’s coastline [Citation28]. An inverse scenario occurs during “La Niña” (LN), when abnormal temperature drops reduce the air masses’ temperatures and also the levels of precipitation along Ecuador’s coast.
This dynamic oceanographic setting causes the composition, abundance and distribution of primary production to vary spatially and seasonally [Citation29]. In situ studies conducted along the coast of Ecuador have reported PP is higher in the south coastal area of Puerto Bolivar (El Oro) in comparison to northern study sites [Citation30]. For example, the estuarine waters of the Gulf of Guayaquil (south of Ecuador) can reach Chl a concentrations from 0.66 to 0.74 mg m−3 [Citation31], while the estuarine waters of the Chone River (central Ecuador) can reach from 0.20 to 0.44 mg m−3 [Citation32]. Seasonal differences have also been reported. At the non-estuary area of the Jaramijó Bay (Manabí), Chl a is higher during the warm months (1.06 to 1.22 mg m−3) than during the cold ones (0.58 to 0.86 mg m−3) [Citation33]. Seasonal differences are mostly driven by changes in the phytoplankton assemblage, with diatom species dominating during the cold months [Citation34], and dinoflagellates during the warm months [Citation35]. While this in situ studies has shed light into spatial and seasonal variations of Chl a, and thus PP, along localized study sites, there are no dedicated investigations to assess its long-term variation nor its seasonal patterns in broader areas of the coast of Ecuador. The use of remote sensing thus provides a cost-effective tool to detect general spatial and seasonal trend patterns in primary production [Citation36,Citation37].
The main objective of the present study is to evaluate changes in Chl a concentration along the coast of Ecuador and examine how these changes correspond to changes in SST. This study used information from remote sensing of nine localities on the Ecuadorian coast to 1) assess annual trends, 2) evaluate spatial variations (latitudinal gradient) and seasonal patterns (climatic seasons) in Chl a concentration and SST, and 3) assess the response of Chl a to SST variation. This study will hopefully serve as the basis for continued long-term investigation into the effects of climate change on primary productivity and marine ecosystems along the Ecuadorian coast.
Materials and methods
Study area
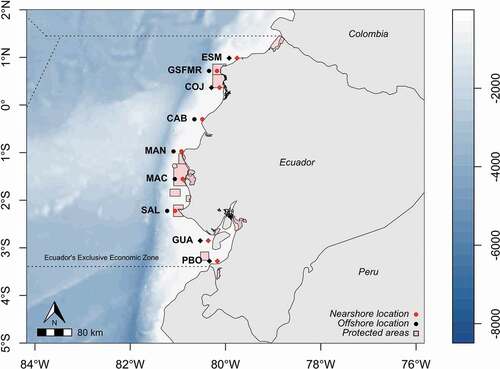
Ecuador is located in the northeast of the South American continent between latitudes 01°27ʹ06”N and 05°00ʹ56 “S and longitudes 75°11ʹ49”W to 81°00ʹ40”W. It borders Colombia to the north, Peru to the south and east, and the Pacific Ocean to the west [Citation38]. The Ecuadorian coast has about 2900 km of coastal profile, including inland waters, estuaries and protected coasts [Citation39]. This region is characterized by humid-tropical to dry-tropical climates, with an average annual temperature of 26°C [Citation28]. The main hydrography of the coastal zone is constituted by the Esmeraldas River (Esmeraldas Province), the Cojimíes River and the Chone River (Manabi Province), the Guayas River (Guayas Province) and the Jubones River (El Oro Province) [Citation40]. Ecuadorian ocean waters are influenced by a system of currents that include the warm current of Panama originating from the north, the cold Humboldt current originating from the south, the equatorial current originating from the north and south and moving westward, and the Equatorial countercurrent or Cromwell current moving eastward [Citation28]. For the present work, 18 sampling sites distributed along the Ecuadorian coast were utilized. Nine sites were located at a distance of 9.26 km from the coastline (red dots, ) and nine sites at a distance of 27.78 km (black dots, ). Four of the nine sites are influenced by river discharges (estuarine habitats), and five are not influenced by river discharge influence (non-estuarine habitats). Nearshore and offshore locations are just designations to differentiate the closest from the furthest study sites.
Figure 1. Location of sampled sites: Nearshore were at 9.26 km (red dots), and offshore at 27.78 km (black dots) from the coast. The diamonds represent the sites influenced by river discharges. This study was carried out in the following sites: Esmeraldas (ESM; –79.755828, 0.985231), Galera San Francisco Marine Reserve (GSFMR; –80.178535, 0.716439), Cojimies (COJ; –80.125645, 0.365199), Puerto Cabuyal (CAB; –80.486416, –0.299634), Manta (MAN; –80.925100, –0.974820), Machalilla (MAC; –80.897793, –1.554898), Salinas (SAL; –81.058012, –2.224775), Gulf of Guayaquil (GUA; –80.361911, –2.849038) and Puerto Bolivar (PBO; –80.169622, –3.279350)
Remote sensing data
The information used in this work comes from remote sensors (satellites) specialized in taking color images (for Chl a) and infrared images (for SST). Chl a concentration information was obtained from the MODIS-Aqua Moderate Resolution Imaging Spectroradiometer satellite database [Citation41]. Data used was the average monthly composite at a 0.0417 decimal degree spatial resolution. Sea surface temperature (SST) data was also download from the High Resolution Multi-Scale Analysis (MUR) fv04.1 database [Citation42]. This data set has the average monthly information recorded in degrees centigrade (°C) with a 0.011 decimal degree spatial resolution. The extraction of this data was done using the package “xtractomatic” v.3.4.2 [Citation43] available for the R statistical software [Citation44]. To fill in with missing (NAs) information within the imported Chl a and SST data, the algorithms found in the package “Amelia” v.3.4.2 were used [Citation45].
Compared to other regions of the world, current algorithms for ocean color detection have performed better in the Tropical Pacific Ocean. The MODIS-Aqua algorithms work well, but underestimate low chlorophyll concentration by 10.6% [Citation46]. On the other hand, the current version of MUR (fv04.1) incorporates a multiscale SST data interpolation and fusion technique (including in situ measurements) to correct biases. Overall, the biases from the data sets used by MUR are small (< 0.07°C) [Citation47].
Data analysis
Chl a concentration and SST time series were processed and analysed in the R statistical software [Citation44]. Data for each site was decomposed into its yearly trends, seasonal (monthly) variations and random portion following Stuart, Kendall [Citation48]. We determined the trend component using a moving average and then removed it from the time series. The seasonal variation (anomaly) was then computed by averaging, for each time unit, over all periods. To evaluate significant differences between the time series of each site, the Nemenyi non-parametric analysis was executed for Kruskal–Wallis type data [Citation49]. To assess if positive or negative changes occurred through time, yearly trends were examined using the Mann-Kendall analysis [Citation50] available in the “trend” v1.1.0 package [Citation51]. To compare the seasonal variations between sites, monthly Chl a concentration and SST anomalies were visually inspected. Finally, we assessed the relationship between Chl a concentration and SST by means of a smooth curve computed by locally weighted regression smoothing (LOWESS) to a scatter plot [Citation52].
Results
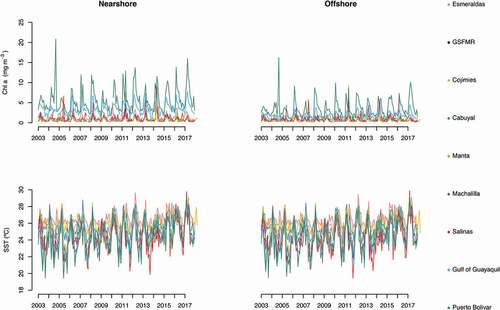
Chl a concentration and SST where highly variable across the 15-year study period (). The mean Chl a concentration along the Ecuadorian coast was 1.5 mg m−3, with higher values always recorded in nearshore sites. Puerto Bolivar, Gulf of Guayaquil and Esmeraldas held the highest mean Chl a; while GSFMR, Cojimies and Cabuyal held the lowest (). The highest Chl a concentration value (20.8 mg m−3) was recorded in Puerto Bolivar in the nearshore coastal zone during the cold season of 2004. The lowest Chl a value (0.01 mg m−3) was recorded in GSFMR in both the nearshore and offshore sites during the warm season of 2016.
Table 1. Chl a (mg m−3) and SST (oC) mean, minimum and maximum values recorded for both the nearshore and offshore study sites. Minimum and maximum values are in parenthesis
The mean SST on the coast of Ecuador was 25.3°C, with slightly higher values recorded in offshore sites. Esmeraldas, GSFMR and Cojimies held the highest mean SST values; while Salinas, Gulf of Guayaquil and Puerto Bolivar held the lowest (). The highest value was 29.9°C, recorded in Salinas during the warm season of 2017. The lowest value was 19.4°C, recorded in Puerto Bolivar during the cold season of 2005.
Figure 2. Raw monthly time series data for Chl a and SST from 2003 to 2017 for the nearshore and offshore study sites
Spatial variation
A marked latitudinal gradient was observed in both Chl a concentration and SST, yet the former increased from north to south while later increased from south to north (). The highest Chl a concentration was located mainly in the southern coastal zone (Gulf of Guayaquil and Puerto Bolivar), followed by the northern coastal area (Esmeraldas). The lowest concentrations were found in the central region, and markedly decreased with increasing distance from the coast (). Regardless of the study site proximity to the coast, the latitudinal gradient resulted in significant differences (p < 0.05) between Chl a concentration at Puerto Bolivar and all study sites except the Gulf of Guayaquil (). Esmeraldas, the northernmost site and third highest in Chl a concentration, also showed significant differences (p < 0.05) with all the sites apart from GSFMR, the closest one geographically. All the remaining sites located in the central coastal region had similar Chl a concentration, with some significant differences present. The sites influenced by the rivers discharge showed the highest Chl a concentration, both in nearshore and offshore locations.
Figure 3. Variation in the concentration of Chl a (mg m−3) and SST (°C) for the nine sites studied along the Ecuadorian coast. Sites position on the y axis are ordered based on their latitudinal location along the coast of Ecuador: Top, northern sites; Bottom, southern sites. NS: nearshore; OS, offshore. The light blue boxes represent the sites influenced by river discharge
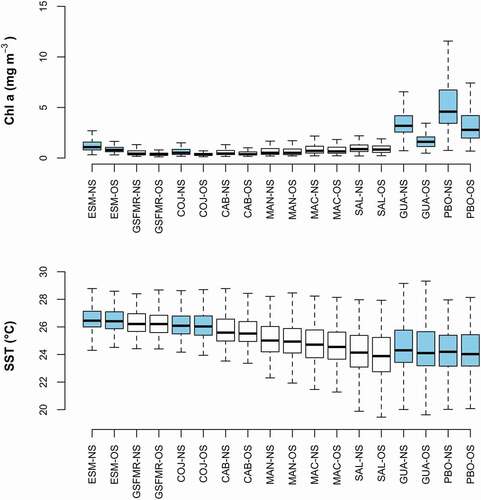
Table 2. Kruskal–Wallis significance test for the concentration of Chl a at nearshore and offshore study sites. Significant differences are marked in bold
In terms of the SST, the northern region was characterized by the warmest temperatures (>24°C) while the southern was characterized by the coldest (<20°C, ). Interestingly, SST range variation was narrower for higher than lower latitudes. The SST of the sites located in the northern zone were less variable (2° around the median); while those located in the southern zone presented a higher thermal stress (4° around the median). The SST at Esmeraldas was significantly different (p < 0.05) to that of all the other sites except GSFMR (). Similarly, recorded SST at Puerto Bolivar and Guayaquil were significantly different (p < 0.05) to all the other sites except Machalilla. SST variation was not significantly different between sites that were adjacent to each other. These results were consistent, regardless of the site’s proximity to the coast. The difference in SST between estuarine and non-estuarine sites was influenced by their latitudinal locations and not by rivers discharge.
Table 3. Kruskal–Wallis significance test for the differences in SST between locations. Significant differences are marked in bold
Yearly and seasonal trends
The analytical decomposition of the Chl a concentration time series showed a stable yearly trend for all except two sites (). Puerto Bolivar was the only site to show a significant positive trend for both the nearshore and offshore locations (p = 0.01; ), yet changes in the nearshore site reached more than 1 mg m−3 during the assessed 15-year time period. The Gulf of Guayaquil was the only other site to show a significant increase in Chl a concentration. The Chl a concentration increased by 0.5 mg m−3 in the nearshore site (p < 0.00; ). In terms of SST, the analytical decomposition exhibited a significant positive increase for all sites (p < 0.05; ), regardless of the marked occurrence of colder temperatures in 2014 (). No site showed a negative trend for Chl a or SST during the study period.
Figure 4. Decomposed yearly trends in Chl a concentration and SST across the nine study sites
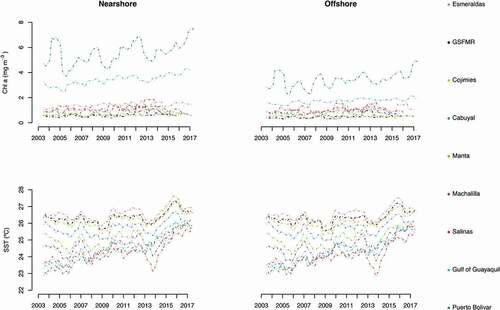
Table 4. Mann-Kendall trend significance test for the concentration of Chl a and SST in both inshore and offshore locations. Significant differences are marked in bold
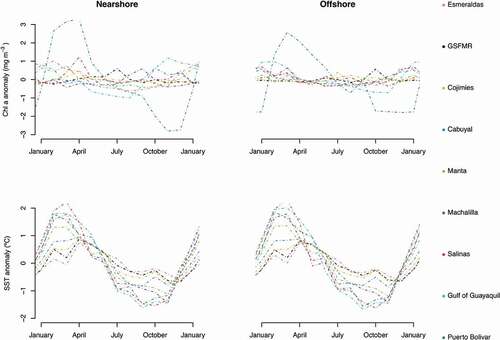
The concentration of Chl a showed a marked temporality for nearshore sites located mostly in southern coastal Ecuador (). Puerto Bolivar reported Chl a seasonal differences of up to 6 mg m−3, with higher values recorded during the warm season (January through April), and lower ones during the cold (July through December). Puerto Bolivar was the only site to report similar trends in both the nearshore and offshore sites. Esmeraldas, Manta and Salinas reported a similar scenario, but with changes only up to 2 mg m−3. Interestingly, the Gulf of Guayaquil, Cabuyal, and Machalilla showed an inverse scenario, with higher values mostly from September through January, and lower values from February through July. All of the other sites showed relatively low Chl a concentration changes (<0.5 mg m−3). The seasonal variation observed in offshore locations was generally smaller and followed a similar trend pattern than those observed nearshore. This was true everywhere except for the Gulf of Guayaquil, where the seasonal pattern showed higher values from January to May and lower values from July through December.
In terms of SST, nearshore and offshore sites reported the same seasonal patterns (). For all sites, warmer SST were observed from January through May, and colder SST from July through November. Salinas, Gulf of Guayaquil, Machalilla and Manta reported seasonal changes in SST up to 4°C. The northern study sites showed smaller seasonal changes in SST (up to 2°C) in agreement with the latitudinal gradient observed in .
Figure 5. Annual (upper) and monthly (lower) variations in Chl a concentration (mg m−3) and SST (°C) at the 9 study sites. Monthly variations are expressed in anomaly scales
Chl a and SST correlations
The smoothed curves show a substantial nonlinear relationship between the Chl a with temperature (). This relationship is positive and strong particularly for the nearshore locations of Puerto Bolivar (R2 = 0.16), Gulf of Guayaquil (R2 = 0.23) and Esmeraldas (R2 = 0.05). Cojimies (R2 = 0.02) and Cabuyal (R2 = 0.01) follow these sites, with slightly positive relationships between Chl a and SST.
Figure 6. LOWESS scatter plots of the relationship between Chl a (mg m−3) and SST (°C) for the nearshore study sites
Discussion
The evaluation of trend patterns in PP is of great importance to ecological studies, natural resource management, and terrestrial carbon sink estimates [Citation53]. Photosynthesis by oceanic phytoplankton is a vital link in the cycling of carbon between living and inorganic stocks [Citation54], and its variation exerts a bottom-up control on primary and secondary consumer’s biomass [Citation7]. This research shows PP in coastal Ecuador is rather low in comparison with other oceanic regions. A positive trend in Chl a concentration was detected for the southernmost (Puerto Bolivar and Gulf of Guayaquil) and northernmost (Esmeraldas) study sites, which positively responded to changes in local SST.
The Ecuadorian coast is located in the equatorial Pacific Ocean, which is considered a region with high nutrient content but low PP as a consequence of reduced levels of atmospheric deposition of iron in the ocean [Citation18]. In most of the studied areas, the averaged Chl a concentration was around 1.5 mg m−3, which is classified as a low level of PP [Citation55]. The highest concentration of Chl a values were recorded in Puerto Bolivar (e.g. 20.8 mg m−3); however, this is still low compared to the coastal upwelling systems of Peru and Benguela, whose annual concentration of Chl a reaches up to 120 mg m−3 and 160 mg m−3, respectively [Citation56]. Iron controls the phytoplankton productivity rate in the equatorial Pacific by restricting the consumption of available macronutrients (nitrates, phosphates and silicates) by phytoplankton [Citation57]. Iron is generally deposited in the ocean via atmospheric deposition, upwelling and coastal river discharges [Citation58]. Even though coastal outcrops are recorded for areas such as Machalilla and Puerto Bolivar [Citation59], coastal upwelling does not occur in Ecuadorian waters in the same magnitude as in the coast of Peru. Puerto Bolivar and the Gulf of Guayaquil are the only areas seasonally influenced by the strengthening of the Humboldt upwelling system and the Humboldt Current [Citation60]. The influence of these currents explains the higher values of Chl a observed in those areas in comparison to the other study sites. However, the remoteness of Esmeraldas to the Humboldt upwelling system suggests nutrient fertilization also occurs from coastal river discharges and mangroves. The Gulf of Guayaquil and Esmeraldas receive the water discharges from the largest hydrographic systems of the Ecuadorian coast [Citation40]. Compared to other coastal zones of Ecuador, estuaries exhibit high concentrations of nitrates, phosphates and silicates [Citation61,Citation62]. These nutrients promote the growth of phytoplankton biomass, particularly of species belonging to the group of diatoms [Citation63,Citation64], which have been recognized as the main contributors to the total marine PP and particulate carbon exported to the depths [Citation65]. Our study reported Chl a concentration values ranging from 1 to 7 mg m−3 for both sites, which are similar to previous in situ studies linking nutrient contribution to river discharge [Citation66,Citation67]. Iriarte, Vargas [Citation68] reported that the discharge of the great Itata River in the Concepción area (Chile) sustained the phytoplankton biomass during the winter season. Dasgupta, Singh [Citation69] analyzed the Chl a concentration of the world’s oceans and determined that it is generally high near the coasts as a result of coastal waters and river discharge mixture. These studies support our findings, and suggest PP could be driven by both the Humboldt upwelling system and river discharges along the coast of Ecuador.
In the last 15 years the concentration of Chl a along the Ecuadorian coast showed a tendency to increase, especially in the coastal areas of the Gulf of Guayaquil and Puerto Bolivar. In contrast, Boyce, Dowd [Citation70] determined global surface Chl a concentration decreased by 62% from 1890 to 2010. This downward trend in PP is associated with recent ocean warming, estimated to be about 0.1°C per decade since 1951 [Citation71]. These studies provide a conflicting panorama to our results. Under the global scenario, PP should follow an inverse trend to that of SST, yet a negative trend in Chl a was not observed at any of our study sites. Marrari, Piola [Citation72] reported that Chl a concentration significantly increased in the last 20 years in areas such as the Marino Grande Ecosystem of the Patagonian Platform, the Humboldt Marine Large Ecosystem, and the Central American Coastal Pacific Marine Ecosystem. Since 1980, regions near the continental shelves showed positive trends in Chl a concentration [Citation73], a product of constant coastal eutrophication and land runoff [Citation74]. Surely, the convergence of river discharge and marine currents are supplying the necessary nutrients to explain the increase in phytoplankton biomass in Puerto Bolivar, the Gulf of Guayaquil and to a lesser extent Esmeraldas [Citation75]. Precipitation in Ecuador’s coast is directly linked to high SST, particularly during ENOS events [Citation76], as warm surface waters induce abundant rains along the coast and western region of the Andes Mountain Chain [Citation2]. As such, positive correlation between Chl a and SST are likely a response to increased precipitation during warmer months, and could thus explain the upward trend in PP linked to SST for Puerto Bolivar, Gulf of Guayaquil and Esmeraldas.
In our study, SST has steadily increased during the 15-year study period. This time frame is rather short to draw conclusions on possible global warming scenarios, yet other studies have reported the same warming trend in Ecuador’s coast since 1975. For example, Nieto, Martínez [Citation77] determined that the SST rose around 0.82°C from 1975 to 2001, while Breaker, Loor [Citation78] determined an increase of 1°C from 1990 to 2014. Our study time frame (2003–2017) shows SST increment is still undergoing, and it is stronger in southern coastal Ecuador where a high SST variability was also observed. This variability is likely in response to intra-seasonal (trapped coastal waves), annual (Rossby waves), inter-annual (ENSO) and decadal (Pacific Decadal Oscillation, PDO) events interacting with the prevailing oceanic currents [Citation60]. For example, there was a sudden drop in SST during 2014 that matches the year with the highest PP values recorded for coastal Ecuador. While global average SST has significantly increased since 1951, there is evidence that this warming has slowed down since 1998 [Citation79]. In fact, the Eastern Pacific Ocean is the only large marine ecosystem that shows a cooling trend for both its Humboldt upwelling [Citation80] and Galapagos upwelling ecosystems [Citation81]. Dai, Fyfe [Citation82] attributed this to the cooling phase of the PDO, which since 1999 changed from its hot phase (positive) to its cold phase (negative) [Citation83]. Other authors explain that the pause in the warming of SST is linked to a decadal La Niña type decay in the equatorial Eastern Pacific [Citation84] and the pronounced Pacific trade wind strengthening in the last two decades [Citation85]. The interactions between these factors could be responsible for the observed thermal stress, particularly in the south region of coastal Ecuador.
Uncertainty associated to remote sensing
Satellite estimates have certain inaccuracies particularly near the coast, as the estimates are skewed by the colors of suspended materials [Citation86]. Investigations have determined that the accuracy of the satellite data is affected by the degree of turbidity of the waters [Citation87,Citation88]. Similarly, the availability of color data of the oceans is also affected by the cloudiness of the area [Citation89]. It has been suggested that remote sensed data could overestimate plant pigment concentrations by 2–4 times, particularly in marginal seas and coastal waters [Citation90]. Despite these limitations, recent advances in the use of remote sensors have developed methods to correct ocean color readings via algorithms and in situ data collection [Citation91]. Through this discussion, we have provided evidence that our results match those results from in situ data collected across coastal Ecuador. Regardless of its limitations, the use remote sensing should not be discredited. Remote sensing is an accessible tool that allows scientists to obtain data from a wide range in time and a greater spatial coverage than in situ studies [Citation36].
Implications for marine biodiversity
Marine coastal ecosystems are one of the most valuable and widely used natural systems worldwide [Citation92]. These areas rely on PP to sustain balanced coastal and pelagic secondary productivity. Changes in PP can significantly affect the amount of energy transferred to higher trophic levels, increasing the number of trophic links and creating less efficient food webs [Citation93], impacting the biomass and fitness of commercially exploited species [Citation94], and affecting the marine community’s biodiversity [Citation95]. For example, tuna species have high-energy requirements due to their characteristic rapid development, and a decrease in the productivity of the micronekton (primary consumers) and zooplankton (secondary consumers) on which they feed could seriously affect their populations [Citation96]. Projected changes in PP suggest also that an increase in SST and a decrease in PP could restrict the distribution of species such as Pacific sardines (Sardinops sagax) [Citation97]. On the other hand, changes in the phytoplankton assemblage could induce a sharply decline in body size and biomass of certain fish communities, while favoring other fish species. Pennington, Mahoney [Citation98] reported this for the Humboldt upwelling system, where warmer water conditions favor picoplankton-dominated phytoplankton communities that boost sardine’s biomass; yet cooler water conditions favor diatom-dominated phytoplankton communities that boost anchovy’s biomass. Such variations have been already reported for specific sites in the coast of Ecuador, suggesting an important change in the phytoplankton community between the warm and cold months [Citation34,Citation35]. Given the current ocean warming and PP patterns, and the lack of formal research undertaken in this topic in coastal Ecuador, it is difficult to infer in any potential PP change scenario and how it will affect species of commercial and conservation interest. This is of particular concern as nearly 57,158 Ecuadorian fisher families rely on the exploitation of fish stocks as a source of employment and food production [Citation99]. Also, the seasonal presence of the plankton-feeder species such as giant manta rays (Mobula birostris) and whale sharks (Rhincodon typus) could also be affected [Citation100], and thus the marine tourism activities that rely on this species. These links highlight the importance of improving our understanding of the effects of climate change on coastal PP, and the potential for these effects to influence on the health of commercial and threatened marine species.
Conclusions
PP in Ecuador is located mainly in coastal areas, as a result of constant coastal eutrophication due to river discharge. In the last two decades, PP showed a tendency to increase, especially in Puerto Bolivar, Gulf of Guayaquil and Esmeraldas. For the southern areas, the increase is associated with the influence of the Guayas River and the extension of the cold Humboldt current. SST off the coast of Ecuador was characterized by high temperatures in the northern region of the country and low temperatures in the southern region. However, in the last 15 years the SST showed an upward trend for all sites. The study of PP using remote sensors allows for coverage of a wide spatial and temporal range, unlike in situ methods. This tool can be used to generate knowledge about the dynamics of primary production, which is important for the conservation of marine biodiversity and the sustainable management of fisheries. Further research should assess the implications of a changing PP and SST for species of commercial and conservation interest along the coast of Ecuador. This should be focused particularly on those species with a restricted distribution and those that are particularly sensitive to thermal stressors.
Acknowledgments
The present project was made possible thanks to the kind contribution of Iris and Michael Smith. This study is a research project carried out by the Plankton BM607 class of the Pontificia Universidad Católica del Ecuador, Sede Manabí.
Disclosure statement
No potential conflict of interest was reported by the author(s).
Additional information
Funding
References
- Barocio-León O, Millán-Núñez R, Santamaría-del-Ángel E, et al. Productividad primaria del fitoplancton en la zona eufótica del Sistema de la Corriente de California estimada mediante imágenes del CZCS. Cienc. Mar.2007;33(1):59–72.
- Fiedler PC, Lavín MF. Oceanographic conditions of the Eastern Tropical Pacific. In: Glynn PW, Manzello DP, Enochs IC, editors. Coral reefs of the Eastern Tropical Pacific: persistence and loss in a dynamic environment. Dordrecht: Springer Netherlands; 2017. p. 59–83.
- Gregor J, Maršálek B. Freshwater phytoplankton quantification by chlorophyll a: a comparative study of in vitro, in vivo and in situ methods. Water Res. 2004;38(3):517–522.
- Picado A, Alvarez I, Vaz N, et al. Chlorophyll concentration along the northwestern coast of the Iberian Peninsula vs. atmosphere-ocean-land conditions. J Coast Res. 2013;165:2047–2052.
- Field C, Behrenfeld M, Randerson J, et al. Primary production of the biosphere: integrating terrestrial and oceanic components. Science. 1998;281:237–240.
- Rousseaux C, Gregg W. Interannual variation in phytoplankton primary production at a global scale. Remote Sen. 2014;6:1–14.
- Hunt GL, McKinnell S. Interplay between top-down, bottom-up, and wasp-waist control in marine ecosystems. Prog Oceanogr. 2006;68(2):115–124.
- Litchman E, De Tezanos P, Edwards K, et al. Global biogeochemical impacts of phytoplanckton: a trait-based perspective. J Ecol. 2015;103(6):1384–1396.
- Canfield D, Glazer A, Falkowski P. The evolution and future of Earth’s nitrogen cycle. Science. 2010;330(6001):192–196.
- Platt T, Sathyendranath S. Spatial structure of pelagic ecosystem processes in the global ocean. Ecosystems. 1999;2(5):384–394.
- Reyes-Salinas A, Cervantes-Duarte R, Morales-Pérez R, et al. Variabilidad estacional de la productividad primaria y su relación con la estratificación vertical en la Bahía de la Paz, B.C.S. Hidrobiológica. 2003;13(2):103–110.
- Yoder J, McClain C, Feldman GC. Annual cycles of phytoplankton chlorophyll concentrations in the global ocean: a satellite view. Global Biogeochem Cy. 1993;7(1):181–193.
- Rowe GT, Clifford CH, Smith KL Jr, et al. Benthic nutrient regeneration and its coupling to primary productivity in coastal waters. Nature. 1975;255(5505):215.
- Gameiro C, Cartaxana P, Cabrita MT, et al. Variability in chlorophyll and phytoplankton composition in an estuarine system. Hydrobiologia. 2004;525(1):113–124.
- Racault M-F, Sathyendranath S, Brewin R, et al. Impact of El Niño Variability on oceanic phytoplankton. Front Mar Sci. 2017;4(133):1–15.
- Shi D, Xu Y, Hopkinson B, et al. Effect of ocean acidification on iron availability to marine phytoplankton. Science. 2010;327(5966):676–679.
- Winder M, Sommer U. Phytoplankton response to a changing climate. Hydrobiologia. 2012;698(1):5–16.
- Gregg W, Conkright M, Ginoux P, et al. Ocean primary production and climate: global decadal changes. Geophys Res Lett. 2003;30(15):1–4.
- Gregg W, Conkright M. Decadal changes in global ocean chlorophyll. Geophys Res Lett. 2002;29(15):1–4.
- Brown C, Fulton E, Hobday A, et al. Effects of climate-driven primary production change on marine food webs: implications for fisheries and conservation. Glob Change Biol. 2010;16(4):1194–1212.
- Gabor N. Un océano inexplorado: las especies marinas del Ecuador. Revista Desafío. 2002;3(5):32–34.
- Cucalón E. Oceanografía y sistemas físicos. Sistemas biofísicos en el Golfo de Guayaquil. Quito, Ecuador: Comisión Asesora Ambiental de la Presidencia de la República del Ecuador; 1996, 1–109.
- Perugachi-Salamea C, González-Narváez M, Pambabay-Calero J, et al. Caracterización oceanográfica del perfil costero ecuatoriano a través de métodos estadísticos aplicados a las estaciones fijas de monitoreo del INOCAR, serie a partir de 1981. Acta Oceanogr Pac. 2014;19(2):7–21.
- Cruz M, Gabor N, Mora E, et al. The known and unknown about marine biodiversity in Ecuador (continental and insular). Gayana. 2003;67(2):232–260.
- Cucalon E. Variabilidad oceanográfica frente a la costa del Ecuador durante el período 1981-1986. Boletín Erfen. 1986;19:11–26.
- Lavín MF, Fiedler PC, Amador JA, et al. A review of eastern tropical Pacific oceanography: summary. Prog Oceanogr. 2006;69(2–4):391–398.
- Morán-Tejeda E, Bazo J, López-Moreno JI, et al. Climate trends and variability in Ecuador (1966–2011). Int J Climatol. 2016;36(11):3839–3855.
- Sosa A. El fenómeno El Niño 1997–1998. Memoria, retos y soluciones. Quito, Ecuador: Corporación Andina de Fomento; 2000.
- Tapia M, Naranjo C. Aspectos oceanográficos del plancton y su relación con el frente ecuatorial, durante septiembre del 2011. Acta Oceanogr Pac. 2012;17(1):67–91.
- Naranjo C, Tapia M. Composición y abundancia del plancton en la zona costera del Ecuador, en mayo de 2013. Acta Oceanogr Pac. 2017;21(1):27–45.
- Tapia M, Naranjo C. Fitoplancton en el Golfo de Guayaquil externo, durante enero de 2014. Acta Oceanogr Pac. 2017;21(1):46–58.
- Tapia M, Naranjo C. Caracterización del plancton en Bahía de Caráquez y en el estuario del río Chone, Ecuador durante marzo de 2012. Acta Oceanogr Pac. 2015;20(1):57–69.
- Gualancañay E, Tapia M, Naranjo C, et al. Caracterización biológica de la bahía de Jaramijó en la costa ecuatoriana, 2008. Acta Oceanogr Pac. 2010;16(1):33–52.
- Torres G. Composición y distribución del fitoplancton en aguas costeras ecuatorianas durante La Niña (septiembre 2001) [Tesis de maestría]. Guayaquil, Ecuador: Universidad de Guayaquil; 2010.
- Pesantes F. Los dinoflagelados como indicadores de “El Niño” en el mar ecuatoriano. Acta Oceanogr Pac. 1983;2(1):84–117.
- Lee Z, Marra J, Perry MJ, et al. Estimating oceanic primary productivity from ocean color remote sensing: a strategic assessment. J Mar Syst. 2015;149:50–59.
- Valdez-Holguín J, Gaxiola-Castro G, Cervantes-Duarte R. Productividad primaria en el Golfo de California calculada a partir de la relación de irradiancia superficial y clorofila de la zona eufótica. Cienc. Mar.1995;21(3):311–329.
- Instituto Oceanográfico de la Armada. Información general de la República del Ecuador. Derrotero. De la costa continental e insular del Ecuador. Guayaquil, Ecuador: INOCAR; 2012.
- Boothroyd J, Ayon H, Robadue D, et al. Características de la líneas costera del Ecuador y recomendaciones para su manejo. Guayaquil, Ecuador: International Coastal Resources Management Program; 1994.
- Instituto Oceanográfico de la Armada. Derrotero. De la costa continental e insular del Ecuador. Guayaquil, Ecuador: INOCAR; 2005.
- NASA GFSC. Moderate-resolution Imaging Spectroradiometes (MODIS) Aqua Ocean Color Data. Greenbelt, MD, USA: NASA Goddard Space Flight Center, Ocean Ecology Laboratory, Ocean Biology Processing Group; 2018 [2019/04/13]. Available from: https://oceancolor.gsfc.nasa.gov/data/aqua
- JPL MUR MEaSUREs Project. GHRSST Level 4 MUR Global Foundation Sea Surface Temperature Analysis (v4.1). PO.DAAC, CA, USA; 2015 [2019/04/13]. Available from: https://podaac.jpl.nasa.gov/dataset/MUR-JPL-L4-GLOB-v4.1
- Mendelssohn R. xtractomatic: Accessing Environmental Data from ERD’s ERDDAP Server. R package version 3.4.2; 2018.
- R Core Team. R: A language and environment for statistical computing. R Foundation fot Statistical Computing. Vienna, Austria; 2018.
- Honaker J, King G, Blackwell M. Amelia II: a program for missing data. J Stat Softw. 2011;45(7):1–47.
- Pittman NA, Strutton PG, Johnson R, et al. An assessment and improvement of satellite ocean color algorithms for the Tropical Pacific Ocean. J Geophys Res Oceans. 2019;124(12):9020–9039.
- Chin TM, Vazquez-Cuervo J, Armstrong EM. A multi-scale high-resolution analysis of global sea surface temperature. Remote Sens Environ. 2017;200:154–169.
- Stuart A, Kendall M, Ord JK. The advanced theory of statistics. Vol 3: Design and analysis of time-series. London, UK: Griffin; 1983.
- Nemenyi P. Distribution-free Multiple Comparisons [ Ph.D. thesis]. Princeton University; 1963.
- Hirsch RM, Slack JR, Smith RA. Techniques of trend analysis for monthly water quality data. Water Resour Res. 1982;18(1):107–121.
- Pohlert T. Trend: Non-parametric trend tests and change-point detection. R package version 1.1.1; 2018.
- Zar JH. Biostatistical Analysis. 5 ed. New Jersey, United States: Prentice Hall; 2010.
- Cao M, Prince SD, Small J, et al. Remotely sensed interannual variations and trends in terrestrial net primary productivity 1981–2000. Ecosystems. 2004;7(3). DOI:https://doi.org/10.1007/s10021-003-0189-x.
- Behrenfeld MJ, O’Malley RT, Siegel DA, et al. Climate-driven trends in contemporary ocean productivity. Nature. 2006;444(7120):752–755.
- Ramírez B, Pizarro E. Distribución de clorofila a y feopigmentos en los canales australes chilenos comprendidos entre Puerto Montt y la Laguna San Rafael, Chile. Cienc Tecnol. 2005 Mar;28(1):45–62.
- Chavez FP, Messié M. A comparison of Eastern Boundary Upwelling Ecosystems. Prog Oceanogr. 2009;83(1):80–96.
- Brzezinski MA, Baines SB, Balch WM, et al. Co-limitation of diatoms by iron and silicic acid in the equatorial Pacific. Deep-Sea Res Pt II: Top Stud Oceanogr. 2011;58(3):493–511.
- Lalli CM, Parsons TR. Biological oceanography: an introduction. 2nd ed. Burlington, United States: Elsevier Butterworth-Heinemann; 2006.
- Terán M, Campos F, Clark K, et al. Portafolio de sitios prioritarios para la conservación dentro de la Unidad de Planificación Ecorregional Pacífico Ecuatorial: Componente marino. Quito, Ecuador: The Nature Conservancy; 2004.
- Montecino V, Lange C. The Humboldt Current System: ecosystem components and processes, fisheries, and sediments studies. Prog Oceanogr. 2009;83(1–4):65–79.
- Salcedo J, Coello D. Dinámica del plancton en la primera milla náutica de la costa ecuatoriana, provincia de Manabí. La Técnica. 2019;(21):1–16.
- Salcedo J, Coello D. Dinámica del plancton en la primera milla náutica frente a la provincia de El Oro, Ecuador. Rev Biol Trop. 2018;66(2):836–847.
- Naranjo C, Tapia M. Composición, distribución y abundancia del plancton en el estuario de San Lorenzo, Esmeraldas-Ecuador. Acta Oceanogr Pac. 2002;11(1):113–128.
- Prado M, Trocccoli-Ghinaglia L, Cajas J. Análisis del estado trófico y microfitoplancton de la zona costera de la provincia del Guayas, Ecuador. Bol Invest Mar Cost. 2017;46(2):91–114.
- Tréguer P, Bowler C, Moriceau B, et al. Influence of diatom diversity on the ocean biological carbon pump. Nat Geosci. 2018;11(1):27–37.
- Coello D, Prado M. Variabilidad del fitoplancton y microzooplancton frente a la costa ecuatoriana durante 1995–1999. Boletín especial INP (Ecuador); 1999, 72–108.
- Tapia M, Naranjo C. Diversidad del plancton en el estuario interior de Puerto Bolívar, Ecuador durante julio de 2002. Acta Oceanogr Pac. 2004;12(1):29–49.
- Iriarte JL, Vargas CA, Tapia FJ, et al. Primary production and plankton carbon biomass in a river-influenced upwelling area off Concepción, Chile. Prog Oceanogr. 2012;92–95:97–109.
- Dasgupta S, Singh RP, Kafatos M. Comparison of global chlorophyll concentrations using MODIS data. Adv Space Res. 2009;43(7):1090–1100.
- Boyce DG, Dowd M, Lewis MR, et al. Estimating global chlorophyll changes over the past century. Prog Oceanogr. 2014;122:163–173.
- Trenberth KE, Jones PD, Ambenje P, et al. Observations: surface and Atmospheric Climate Change. In: Solomon S, Qin D, Manning M, et al., editors. Climate change 2007: the physical science basis. Contribution of Working Group I to the Fourth Assessment Report of the Intergovernmental Panel on Climate Change. Cambridge, United Kingdom - New York, United States: Cambridge University Press; 2007. p. 996.
- Marrari M, Piola AR, Valla D. Variability and 20-year trends in satellite-derived surface chlorophyll concentrations in Large Marine Ecosystems around South and Western Central America. Front Mar Sci. 2017;4(372). DOI:https://doi.org/10.3389/fmars.2017.00372
- Boyce DG, Lewis MR, Worm B. Global phytoplankton decline over the past century. Nature. 2010;466(7306):591–596.
- Gregg W, Casey N, McClain C. Recent trends in global ocean chlorophyll. Geophys Res Lett. 2005;32(3). DOI:https://doi.org/10.1029/2004GL021808
- Hurtado M, Hurtado-Domínguez M, Soto L, et al. Áreas costeras y marinas protegidas del Ecuador. Quito, Ecuador: Ministerio del Ambiente; 2010.
- Soledispa B. El fenómeno El Niño 97–98 y sus efectos en las costas ecuatorianas. Acta Oceanogr Pac. 2000;10(1):181–188.
- Nieto J, Martínez R, Regalado J, et al. Análisis de tendencia de series de tiempo oceanográficas y meteorológicas para determinar evidencias de cambio climático en las costa del Ecuador. Acta Oceanogr Pac. 2002;11(1):17–21.
- Breaker L, Loor H, Carroll D. Trends in sea surface temperature off the coast of Ecuador and the major processes that contribute to them. J Mar Syst. 2016;164:151–164.
- Stocker T, Qin D, Plattner G-K, et al. Climate change 2013: the physical science basis. Contribution of Working Group I to the Fifth Assessment Report of the Intergovernmental Panel on Climate Change. New York, United States: Cambridge University Press; 2013. p. 1535.
- Belkin IM. Rapid warming of Large Marine Ecosystems. Prog Oceanogr. 2009;81(1–4):207–213.
- Zevallos-Rosado J. Análisis comparativo de la temperatura superficial del mar (TSM) en la región del Pacífico Este Tropical (PET) [ Tesis de licenciatura]. Bahía, Manabí, Ecuador: Pontificia Universidad Católica del Ecuador - Sede Manabí; 2020.
- Dai A, Fyfe JC, Xie S-P, et al. Decadal modulation of global surface temperature by internal climate variability. Nat Clim Change. 2015;5(6):555.
- Dai A. The influence of the inter-decadal Pacific oscillation on US precipitation during 1923–2010. Clim Dyn. 2013;41(3):633–646.
- Kosaka Y, Xie S-P. Recent global-warming hiatus tied to equatorial Pacific surface cooling. Nature. 2013;501(7467):403.
- England MH, McGregor S, Spence P, et al. Recent intensification of wind-driven circulation in the Pacific and the ongoing warming hiatus. Nat Clim Change. 2014;4(3):222.
- Chavez F, Messié M, Pennington T. Marine primary production in relation to climate variability and change. Annu Rev Mar Sci. 2011;3(1):227–260.
- Ndungu J, Monger B, Augustijn D, et al. Evaluation of spatio-temporal variations in chlorophyll-a in Lake Naivasha, Kenya: remote-sensing approach. Int J Remote Sens. 2013;34(22):8142–8155.
- Gong G-C, Wen Y-H, Wang B-W, et al. Seasonal variation of chlorophyll a concentration, primary production and environmental conditions in the subtropical East China Sea. Deep-Sea Res Pt II: Top Stud Oceanogr. 2003;50(6):1219–1236.
- Tang DL, Ni IH, Müller-Karger FE, et al. Analysis of annual and spatial patterns of CZCS-derived pigment concentration on the continental shelf of China. Cont Shelf Res. 1998;18(12):1493–1515.
- Nezlin NP, Kostianoy AG, Gregoire M. Patterns of seasonal and interannual changes of surface chlorophyll concentration in the Black Sea revealed from the remote sensed data. Remote Sens Environ. 1999;69(1):43–55.
- Gitelson AA, Schalles JF, Hladik CM. Remote chlorophyll-a retrieval in turbid, productive estuaries: chesapeake Bay case study. Remote Sens Environ. 2007;109(4):464–472.
- Barbier EB. Marine ecosystem services. Curr Biol. 2017;27(11):R507–R510.
- Bell JD, Ganachaud A, Gehrke PC, et al. Mixed responses of tropical Pacific fisheries and aquaculture to climate change. Nat Clim Change. 2013;3(6):591–599.
- Sumaila UR, Cheung WWL, Lam VWY, et al. Climate change impacts on the biophysics and economics of world fisheries. Nat Clim Change. 2011;1(9):449–456.
- Ramirez F, Afan I, Davis LS, et al. Climate impacts on global hot spots of marine biodiversity. Sci Adv. 2017;3(2):e1601198.
- Alatorre-Ramirez VG, Galván-Magaña F, Torres-Rojas YE, et al. Trophic segregation of mixed schools of yellowfin tuna (Thunnus albacares) and skipjack tuna (Katsuwonus pelamis) caught in the eastern tropical Pacific Ocean. Fish Bull. 2017;115(2):252–268.
- Cheung WWL, Lam VWY, Sarmiento JL, et al. Large-scale redistribution of maximum fisheries catch potential in the global ocean under climate change. Glob Change Biol. 2010;16(1):24–35.
- Pennington JT, Mahoney KL, Kuwahara VS, et al. Primary production in the eastern tropical Pacific: a review. Prog Oceanogr. 2006;69(2–4):285–317.
- Martinez-Ortiz J, Aires-da-silva AM, Lennert-Cody CE, et al. The Ecuadorian artisanal fishery for large pelagics: species composition and spatio-temporal dynamics. PLoS One. 2015;10(8):e0135136.
- MAE. Valoración economica del aporte del Sistema Nacional de Áreas Protegidas: Turismo e hidroelectricidad. Quito, Ecuador: Ministerio de Ambiente Ecuador; 2015.