
 ?Mathematical formulae have been encoded as MathML and are displayed in this HTML version using MathJax in order to improve their display. Uncheck the box to turn MathJax off. This feature requires Javascript. Click on a formula to zoom.
ABSTRACT
Despite being increasingly threatened by human-induced disturbances, dry forests remain the least studied and protected forest types in the Caribbean region. In contrast to many other forest systems in the world, we have little knowledge of the site-specific variation in vegetation communities within these forests nor understand how plant species distribution is determined by environmental variables, including geological attributes. Here, we aimed to provide evidence of the relationship between biodiversity and geodiversity, by assessing the associations between plant communities and habitat types in a semi-deciduous forest of the Dominican Republic. We collected vegetation data from 23 sites within the Ocoa river basin, which we classified into six groups with a Random Forest algorithm, using lithology, geomorphology, topography, and last decade history of forest loss as predictor variables. We established three main clusters: one group, which encompassed sites with forest over a limestone substrate, four groups of sites with forests over a marlstone substrate with varying degrees of steepness and forest loss history, and one group that gathered all sites with forest over an alluvial substrate. In order to measure the associations of plant communities with groups of sites, we used the indicator value index (IndVal), which indicates whether a plant species is found in one or multiple-habitat types and the phi coefficient of association, which measures species preferences for habitats. We found that 16 species of woody plants are significantly associated with groups of sites by means of their indices. Our findings suggest that the detection of plant species associations with our selection of environmental variables is possible using a combination of indices. We show that there is considerable variation in plant community composition within the semi-deciduous forest studied and suggest that conservation planning should focus on protection of this variation, while considering the significance and variability of geodiversity as well. In addition, we propose that our indicator groups facilitate vegetation mapping in nearby dry forests, where it is difficult to conduct thorough vegetation or environmental surveys. In short, our analyses hold potential for the development of site-specific management and protection measures for threatened semi-deciduous forests in the Caribbean.
1. Introduction
Tropical dry forests are amongst the most-threatened tropical ecosystems in the world [Citation1,Citation2], with 16% of the original area of dry forest remaining in South and Southeast Asia and 40% in Latin America [Citation2,Citation3]. In the Caribbean region, dry forests are usually considered relatively resilient to natural disturbances, due to high levels of biodiversity and a high proportion of root biomass, which aids a quick recovery of above-ground parts of plants by rapid absorption of water and nutrients [Citation4]. However, human-induced disturbances decrease this natural resilience and allow for the invasion of alien species [Citation5]. Despite these threats, dry forests remain the least studied and protected forest types in the Caribbean region [Citation5–7].
Some of the key factors that contribute to the resilience of forest ecosystems threatened by anthropogenic activities, are the structural and compositional diversity of the vegetation, and the local presence of old-growth forest remnants [Citation8,Citation9]. Such diversity is, in turn, determined by the spatial turnover and distribution of vegetative communities, the heterogeneity of which is linked to spatial patterns among environmental factors [Citation10,Citation11]. For example, we know that geodiversity may explain richness and distribution of plant species, and by extension determine turnover among vegetative communities, at various spatial scales [Citation12–15]. However, while efforts are being made to expand this link between biodiversity and geodiversity to conservation and ecosystem management [Citation16,Citation17], empirical evidence of this relationship remains incomplete, especially for (sub-)tropical ecosystems [Citation18]. This also holds true for previous studies of dry forests in the Dominican Republic (hereafter, DR), which have hinted at, but failed to analyze, biodiversity-geodiversity relationships [Citation19,Citation20].
We examined to what extent various environmental factors, those related to geodiversity in particular, drive the spatial distribution of vegetation within a semi-deciduous tropical forest in the Dominican Republic. Specifically, we hypothesized that the spatial distribution of plant species corresponds to their associations with selected morpho-topographic and geological attributes, as well as past forest loss. And, by extension, that detection of associations of vegetation with environmental variables allows for typification of distinct habitat types within these dry forests; habitat types for which we may find indicator plant species [Citation21]. An understanding of plant community associations with geodiversity and land use attributes would be instrumental for conservation and ecosystem management efforts in these logistically difficult to survey, and topographically complex, forests. For example, identification of indicator plant species may allow us to map the current and potentially changing distributions of communities of plants defined by their mutual associations with aforementioned environmental variables. And, remote-sensing derived morpho-topographic, geological, and land-use attributes are easily mapped across inaccessible areas, from which we may then infer associated vegetation characteristics [Citation22–28]. All in all, we propose that our findings allow for a better understanding and protection of patterns and drivers of heterogeneity, and by extension diversity and resilience to change, in plant communities of tropical dry forests.
2. Material and methods
2.1. Location and sampling sites selection
We collected our samples within a Swietenia–Coccoloba semi-deciduous forest [Citation20] in the Ocoa river basin of the Dominican Republic (18 31’ N, 70
33’ W) (). This forest ranges in altitude from almost 300 m to over 800 m, on slopes of varied inclination. The total annual precipitation is 1300 mm, and the mean annual temperature is 24
C. The most common lithology is marlstone, but alluvial deposits and limestone are also common.
Figure 1. Location map of 23 sampling sites (circles filled white), showing the town of San José de Ocoa (see a description of the rock/landform attributes of the sites in ). The overlapping points are depicted slightly displaced from their actual positions to ensure that all become visible. The background is a color shaded-relief view (red-white is highland, green is lowland) based on a 30-m SRTM DEM (Ref: NASA LP DAAC, 2000. SRTM 1 Arc-Second Global, https://earthexplorer.usgs.gov/. Published September 2014). The bottom-left inset shows the area in the context of the Dominican Republic
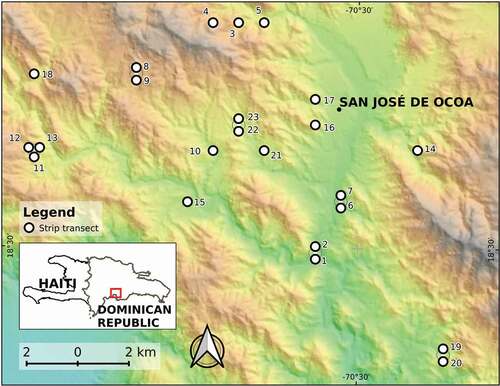
Using QGIS [Citation29], we established 23 sampling sites by placing random points in digital vector polygons of different rock and landform-types, in proportions that were representative of the area of the Ocoa Basin covered by each rock/landform type (see ). This allowed us to obtain samples from all rock and landform types found in the region but did not take forest loss into account as a factor of importance for our sampling design.
However, during field sampling, we obtained local information that there was considerable recent forest loss (after year 2000) in at least two plot locations, something we were able to confirm using a check of maps created by Hansen et al. [Citation27,Citation28]. These authors defined forest loss as a stand-replacement disturbance or a change from a forest to non-forest state, by assessing percent tree cover over time from Landsat imagery. We thereafter decided to utilize this useful–but not a priori considered at the onset of this study–information to conduct preliminary analyses on the impact of forest loss on vegetative community composition.
Due to the challenging conditions for accessing the forest, we adjusted the predefined location of some of the sites while keeping resemblance with traits of the original points. In addition, to assess the risk of spatial autocorrelation in our data, we conducted a spatial neighbourhood analysis using the actual coordinates of the ultimately selected locations. The average distance between the 23 points was ca. 7.1 km, the minimum was 39 m and the maximum was 19.3 km. It is noteworthy that, from 253 pairwise distances calculated between points, only 9 were below 500 m.
To identify rock types we used field recognition and consultation of geological maps (1:50,000 scale) [Citation26], choosing between the following types: limestone (Jura Formation, Middle Eocene), marlstone/mudstone frequently sandy and intercalated with sandstone and boulders (Ocoa Formation, Upper Eocene), marlstone with boulders and sand (Ocoa Formation, Upper Eocene) and alluvial deposits such as boulders, gravels and sand (Quaternary).
Based on our field observations and aerial photography [Citation25], we classified landforms qualitatively, choosing between one of the three types: slopes, which could be of high or low/medium steepness, river bank/margin, and ridge. As a complement, we also calculated the slope from a terrain processed SRTM 1 Arc-Second Global DEM [Citation24]. To estimate the average angle of the slope representative of each entire site, we averaged the slope value of a 55 pixel moving window centered on each site.
2.2. Vegetation data collection
During two field campaigns (fall 2013 and summer/fall 2014), we collected our vegetation data in the 23 randomly placed sites using an adapted version of the Gentry transect protocol [Citation30], based on Cámara & Díaz del Olmo [Citation31]. In each of the 23 sites, we established one 50 m 2 m (100 m2) transect, sampling a total area of 2300 m2. In our adapted version, we recorded vines, trees and shrubs over 2.5 cm dbh and 1.5 m or more in height. We used height and branching as criteria for differentiating between trees, woody plants
m high and shrubs,
m and ramified from their base [Citation32].
To digitize our vegetation data, we used LIBREOFFICE CALC worksheets [Citation33]. In order to avoid the use of unaccepted names, duplicates and synonyms, we cleaned our data consulting international databases [Citation34,Citation35] and reviewing previous research [Citation36,Citation37].
An expert botanist from the National Botanical Garden of Santo Domingo aided us with the identification of the species. We conducted all fieldwork under a permit issued by the Ministry of Environment and Natural Resources and also requested permission to access private land orally and on-site when required.
2.3. Statistical methods
We conducted all statistical analyses in R [Citation38], using the packages cluster [Citation39], factoextra [Citation40], and randomForest [Citation41] to classify sites in groups. For assessing species associations with site groups, we used package indicspecies [Citation42,Citation43]. For zonal statistics, we used raster [Citation44] and rgdal [Citation45], and for data management the packages reshape2, dplyr and tidyr [Citation46–48].
Based on the environmental variables, we generated a distance matrix (1-proximity) using the machine learning algorithm Random Forest in unsupervised learning mode, a suitable method for variables of mixed types [Citation41]. We configured the algorithm to sample cases with replacement growing 1000 trees and to use out-of-bag proximity estimation. Subsequently, we used the distance matrix as the source for AGNES agglomerative hierarchical clustering algorithm with Ward’s method (agglomerative coefficient of 0.91), then we divided the tree into site groups and characterized them accordingly using environmental traits.
In order to assess the association of species with groups of sites, we calculated the following two indices:
(1) Indicator value index (hereafter IndVal), which assesses the value of a species as a bioindicator. This index was originally proposed by Dufrêne and Legendre [Citation49], as the product of quantity A, which measures the positive predictive value of a species as an indicator of the site group, and B, which measures the fidelity or sensitivity of the species with the site group. There are variants of the index for presence-absence data and for individual-based data. Also, in the case of unequal group sizes, the authors suggest the equalization of the relative sizes of all site groups. As we collected plant abundance in field campaigns, and our groups are unequally sized, we opted to calculate an “individual-based group-equalized indicator value index” using the following formula [Citation21]:
where is the mean abundance of the species in the target site group divided by the sum of the mean abundance values over all groups (hereafter Aind), Bpa is the relative frequency of occurrence (presence-absence) of the species inside the target site group, ap is the sum of the abundance values of the species within the target site group, np is the number of occurrences of the species within the target site group, Np is the number of sites belonging to the target site group, k is the number of site groups, ak is the sum of the abundance values of the species in the kth site group, and Nk is the number of sites belonging to the kth site group.
(2) Pearson’s phi point-biserial correlation coefficient (hereafter rpb), in its group-equalized variant, which is suitable for determining the degree of preference of a species for a specific site group among a set of alternative site groups, having individual-based data. We calculated this index according to the following formula (same notation from previous equation) [Citation21]:
where l is the norm of the vector abundances of the species, ,
,
and
.
As stated by De Cáceres and Legendre [Citation21], an advantage of rpb is that it can take negative values, which suggests that species avoid particular environmental conditions. In such a scenario, absences outside the target group contribute to increase the strength of the association, in contrast to IndVal which assumes that having fewer or more absences of a particular species outside the target group is not taken into account for measuring the strength of the association.
Using the function multipatt from package indicspecies, we estimated both indices, IndVal and rpb. This function computes the value of each index for a site group and also for a combination of them. For each species, the function chooses the site group or the combination of them with the highest association value. Afterward, the best matching patterns are tested for statistical significance of the associations, by means of the permutation test and with set at 0.05.
The permutation test compares an observed statistic with a distribution obtained by randomly reordering the data. Under the null hypothesis of no association, the statistic computed after randomly reassigning the occurrence or abundance values of sites, should be very close to those obtained from unpermuted data. The p-value of the test is the proportion of permutations that yielded the same association values than that observed for the unpermuted data. Therefore, we reject the null hypothesis of no association whether the p-value is lower or greater than the significance level [Citation21].
The strategy of randomly reordering the samples varies according to the number of permutations and the random number generator used (the “seed”). Thus, we assessed the sensitivity of our approach by comparing the results of various tests with different combinations of numbers of permutations and seeds. First, we computed 20 tests, by combining 10 different seeds with 103 and 104 permutations each. Afterward, we computed 60 additional tests, by combining 20 different seeds with 103, 104 and 105 permutations each. Overall, we computed 80 p-values, and subsequently we summarized them in a conservative approach by keeping the maximum p-value from the different permutation tests. Thus, we obtained a short list of species significantly associated with habitats, from which we kept only those species with four or more individuals, which at the same time were recorded in at least two sites.
Finally, as a means of validating our results, we performed a redundancy analysis (RDA), which is a type of canonical ordination aimed to extract the structure of a community matrix in relation to an environmental data set. For this, first we generated a Hellinger transformed matrix from our original community data. Afterwards, we fitted the transformed matrix to the environmental matrix using multiple-regression techniques, and summarized the results in “triplot” showing sites, species and environmental variables in a two-dimensional space. Finally, we generated a PCA ordination using the Hellinger matrix, and subsequently performed a passive post hoc explanation method, by fitting the environmental variables onto the ordination. We assessed the significance of the environmental variables by means of permutation tests [Citation11,Citation50].
3. Results
During our field campaigns, we recorded a total of 2158 individuals belonging to 172 species, from which 69 are trees, 68 shrubs, 4 palms, 29 vines and 2 cacti. The vast majority are native (n = 130, 76%) and endemic species (n = 34, 20%). The eight most abundant species represented almost one-third of the abundance, which included Coccoloba diversifolia and Randia aculeata. We collected an average of 93 individuals per site, with a maximum of 175 individuals and a minimum of 47 individuals. The average numeric richness per site was 28 species, with the richest site reaching 44 species and the poorest just 16 species.
To assess the completeness of the sample, we used our abundance data to estimate the expected species richness with several asymptotic methods available in the SpadeR R package [Citation51]. Species richness estimates for our plots ranged from 194 (parametric homogeneous model) to 277 species (uncorrected Chao1), which indicates that our observed richness reached between 62% and 89% of the estimated richness. Although we are aware that we sampled across a relatively small study area (few small plots), we were logistically restricted to this sampling design, and deemed our sampling sufficiently complete to justify further analyses.
3.1. Site groups
We classified our 23 sites in six groups, which we characterize below according to environmental traits (see ):
Figure 2. Dendrogram of groups of sites based on selected environmental variables. Groups are indicated by bold letters A to F, and sites are denoted by numbers. See text for details and for a description of the transects
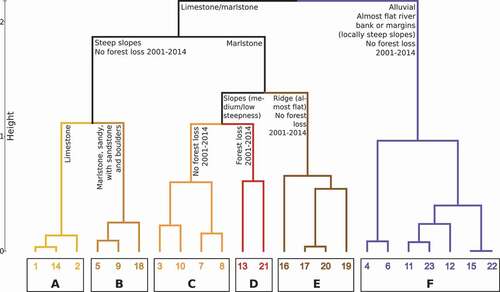
(1) Group A. Forests on steep slopes consisting of limestone, no forest loss reported from 2001 to 2014.
(2) Group B. Forests on steep slopes consisting of sandy marlstone, intercalated with sandstone and boulders, no forest loss reported from 2001 to 2014.
(3) Group C. Forests on medium to low steepness slopes consisting of marlstone, no forest loss was reported from 2001 to 2014.
(4) Group D. Forests on medium to low steepness slopes consisting of marlstone, occasionally with boulders and sands, forest loss reported from 2001 to 2014.
(5) Group E. Forests on almost flat ridges consisting of marlstone, no forest loss reported from 2001 to 2014.
(6) Group F. Forests on almost flat river banks or margins (locally steep slopes) consisting of alluvial deposits, no forest loss reported from 2001 to 2014.
3.2. Indicator value index, IndVal
IndVal calculations suggest that 11 species are significantly associated with groups of sites (). Five species showed significant association with only one group of sites, and the the other six species showed a strong association with combinations of groups of sites.
Table 1. IndVal calculations for 11 significantly associated species with groups of sites
We highlight that Phyllostylon rhamnoides and Savia sessiliflora are suitable indicators for group A (forests on steep slopes consisting of limestone). Two species, Acacia skleroxyla and Randia aculeata, showed a strong association with forest growing on marlstones in different geomorphological positions. Also, we found that Eugenia foetida is a good indicator of forests on flat marlstone ridges (group E), and tests showed that Schaefferia frutescens is significantly associated with group B, which comprises forests on steep slopes consisting of sandy marlstone, intercalated with sandstone and boulders. Moreover, we found that Trichilia pallida is a suitable indicator of group F, which are forests on almost flat river banks or margins (locally steep slopes) consisting of alluvial deposits.
3.3. Pearson’s phi point-biserial correlation coefficient,
Ecological preference, measured by rpb, showed that 13 species are significantly associated with one group of sites or a combination of them (see ). From this, seven species are shared between this list and that of the IndVal calculations, also showing preference for the same groups of sites with which they were associated through IndVal. In addition, we highlight Ateleia gummifera, Coccothrinax argentea and Leucaena leucocephala, associated with group D, which represent forests on marlstone with tree cover loss reported between 2001 and 2014. Finally, we highlight two other species, Hura crepitans and Picramnia pentandra, which showed ecological preference with group F.
Table 2. Rpb calculations for 13 significantly associated species with groups of sites
3.4. Summary of species associated with site groups
Overall, 16 species are significantly associated with groups of sites by means of IndVal and/or rpb indices (see ). We separated three sets of species based on whether the association to site groups was detected by both indices or only by one of them:
(1) Eight species that are significantly associated with site groups by both indices: Ateleia gummifera, Coccoloba incrassata, Eugenia foetida, Exostema caribaeum, Phyllostylon rhamnoides, Pictetia sulcata, Schaefferia frutescens and Trichilia pallida. Thus, these species are indicators and also have significant preference for the habitat types represented in site groups, meaning that associations are likely to be strong.
(2) Three species that are associated with site groups by means of IndVal only: Acacia skleroxyla, Randia aculeata and Savia sessiliflora. These species are indicators of one or more of their associated site groups.
(3) Five species that are associated with site groups by means of rpb only: Coccothrinax argentea, Hura crepitans, Leucaena leucocephala, Picramnia pentandra and Samyda dodecandra. These species show an ecological preference to one or more of the habitats represented by their associated site groups.
Table 3. List of species significantly associated with one or more groups of sites by means of IndVal and/or rpb.
Legend: IndVal and rpb: “X” indicates the species is significantly associated with one or more groups of sites, whether by means of only one of the indices or by both of them simultaneously. Species highlighted in boldface are associated to site groups by both indices, which suggests a strong association.
3.5. Canonical ordination analyses
We performed a redundancy analysis (RDA), a type of constrained community ordination that incorporates the explanatory variables directly in the ordination process. This technique is suitable for extracting the structure of the composition data set (e.g. the community matrix) that are related to the environmental variables. We found that one-third of the total variance explained by the RDA corresponds to the constrained fraction, which is a high value considering the high complexity of our community matrix.
To represent the RDA trends, we used a triplot, which is a graph that features three types of entities in a single ordination space: sites, response variables (e.g. species) and explanatory variables, which in this case are environmental variables (see ). The triplot resembles the six clusters identified by the AGNES agglomerative hierarchical clustering algorithm. In addition, the species correlated with the sites are the same highlighted as associated by both IndVal and/or rpb indices to any of the groups previously identified. This is an expected result, since the RDA incorporates the environmental variables in the ordination process.
Figure 3. Triplot of the Hellinger-transformed abundance community matrix, constrained by the variables (blue outlined rectangles) lithology, geomorphology, forest loss 2001–2014 and slope. Though we used the entire community matrix for computing the RDA, we only plotted the 16 species associated by means of IndVal and rpb. This is a scaling 2 triplot, where angles between species and explanatory variables, and angles between species themselves and variables themselves, are interpreted as correlations. The labelled (A to F) ellipses with grey dotted border enclose site groups defined by the AGNES agglomerative hierarchical clustering algorithm. See text for details and for a description of the transects
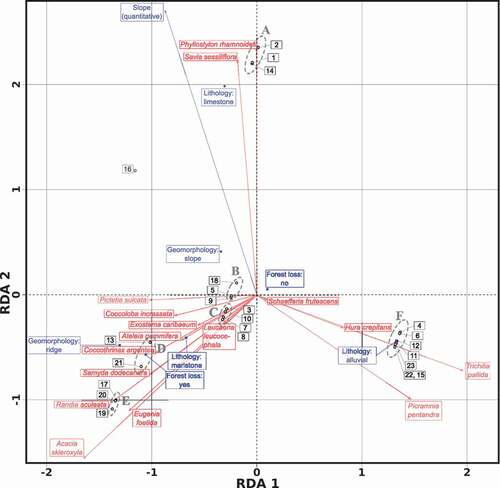
To test the significance of our environmental variables in relation to the community composition, we used a passive post hoc explanation fitting method by fitting the environmental matrix to a PCA ordination of the Hellinger transformed community matrix. The results of the permutation tests, suggest that both lithology and geomorphology are significant factors in our sample. However, forest loss history and terrain slope resulted in non-significant variables according to the tests ().
Table 4. Regression results from fitting the environmental variables onto a PCA ordination of a Hellinger transformed community matrix
4. Discussion
We confirm that spatial heterogeneity in the composition of plant communities in semi-deciduous forests of the DR, can be linked to local spatial patterns in geodiversity and topography, with less evidence for the role of past land-use. Specifically, we found support for the hypothesis that plant species are significantly associated with sites characterized by two qualitative factors, lithology and geomorphology. Accordingly, our findings provide new evidence of the links between geodiversity and biodiversity in tropical dry forests, and support the hypothesis of association between forest communities and site groups characterized by lithological attributes found in the previous research [Citation52].
Several studies support most of the species-habitats associations we detected in our study. For example, Phyllostylon rhamnoides (Ulmaceae) and Savia sessiliflora (Phyllanthaceae) often occur on calcareous soils within dry tropical forests [Citation5,Citation53,Citation54]. Similarly, Acacia skleroxyla (Leguminosae) is considered a calciphilous species (i.e. adapted to life in calcium-rich and clayish soils typically developed on marlstone) and Randia aculeata (Rubiaceae) is commonly reported in fertile soils developed on limestone substrate [Citation19,Citation54–56]. Moreover, Hura crepitans (Euphorbiaceae), Picramnia pentandra (Picramniaceae) and Trichilia pallida (Meliaceae), are categorized as hygrophilous species or occuring in riparian forests on alluvial soil [Citation54,Citation57,Citation58].
Conversely, knowledge of these species-habitat associations allows us to quickly target high, or highly complementary, plant diversity when gazetting core-protected areas or conducting restoration efforts. For example, high representation of diverse plant species in a given gazetted area could be achieved by focusing on selecting plots across gradients in lithology [Citation59,Citation60]. This would allow for high species turnover (i.e. unique species in plant communities across lithology types), low nestedness of plant communities (i.e. local plant communities are not merely a subset of the wider species pool), and thus a high beta diversity between locations and ultimately a high gamma diversity for the entire area. And, such an exercise could be facilitated by a focus on the presence of just a few indicator species such as P. rhamnoides (limestone), T. pallida (alluvial), and Acacia skleroxyla (marlstone); all significantly associated with one particular lithology type and distinctly plotted at the extremes of lithology-related gradients in the community ordination plot ().
Although we found strong species-habitat associations, we acknowledge that factors other than lithology and geomorphology, play a significant role on the plant species distributions of the dry forest analyzed. Future research may address to what extent climate, drainage and soil nutrients at site-level, as well as biotic interactions (e.g. pollination and dispersal), determine vegetation communities in these forests [Citation61–63]. These challenging goals may be addressed using fine resolution instrumentation (e.g. soil moisture loggers) and periodic monitoring.
Although we found no significant association between plants and forest loss following the passive post hoc explanation fitting method, we do recognize that both IndVal and rpb calculations suggest a strong association with forest loss for certain species. For example, Coccothrinax argentea (Arecaceae), an endemic palm, is strongly associated with sites that experienced recent tree cover loss (group D), which is in line with this species’ needs for direct sunlight and well-drained soils [Citation64]. Similarly, the presence of a species such as Leucaena leucocephala (Leguminosae) in this group–present at all groups of sites but particularly associated with group D–can easily be explained, as this agrees with the notion that this is an invasive species that quickly becomes abundant under open canopies (e.g. elsewhere it is known to invade pastures) [Citation65–68]. More surprisingly, we also found some species that were not previously considered to be associated with forest disturbances or conditions of direct sunlight occurring in group D, such as Ateleia gummifera and Pictetia sulcata (both Leguminosae), which suggests that these species may be related to disturbed forests or calcium-rich soils [Citation54].
We propose that our analyses hold potential for the development of site-specific management in these forests and may support their conservation by restoration practices and protection. First, we show that geodiversity metrics, which are relatively easy to obtain from remote sensing imagery and official maps, are useful predictors of plant communities in dry forests of the DR. Second, at relatively small-scales, we detected considerable variation in forest composition, a variation that could be related back to the presence of a small set of indicator species. Since it is logistically challenging to survey all dry forests in the DR or the wider Caribbean region, we might thus focus our attention on this suite of indicator species to protect a large and complementary range of biodiversity. And third, we showed the potential of Random Forest algorithms, association analyses based on IndVal and rpb indices, and ordination techniques, in filling in gaps in our understanding of the spatial clustering, association, and variation of vegetative communities of DR’s dry forests. Taken together, these three arguments support the notion that our approach can be replicated across other forests and countries in the region and that our methods can be scaled up to aid regional conservation planning.
Acknowledgments
We are grateful to Iris Santos, Gerónimo Laurencio, Edwin Medina, María de Aza and Wendy Rojas who aided in the field data collection. The design of the work was discussed with Rafael Cámara Artigas, from the University of Seville, who also helped in the acquisition of field data. Species identification was done by Teodoro Clase, with the support of the National Botanical Garden of Santo Domingo. Geological maps were kindly facilitated by the National Geological Survey of the Dominican Republic. Aerial photographs were donated by the National Institute for Hydraulic Resources.
Disclosure statement
No potential conflict of interest was reported by the author(s).
Additional information
Funding
References
- Janzen DH. Tropical dry forests: the most endangered major tropical ecosystem. In: Wilson E, editor. Biodiversity. Washington (DC): National Academy Press; 1988. p. 130–137. Available from. DOI:https://doi.org/10.17226/989.
- Miles L, Newton AC, DeFries RS, et al. A global overview of the conservation status of tropical dry forests. J Biogeograph. 2006;33(3):491–505. Available from.
- Olson DM, Dinerstein E, Wikramanayake ED, et al. Terrestrial ecoregions of the world: a new map of life on earth: a new global map of terrestrial ecoregions provides an innovative tool for conserving biodiversity. BioScience. 2001;51(11):933–938. Available from.
- Lugo AE, Medina E, and Trejo-Torres JC, et al. Botanical and ecological basis for the resilience of antillean dry forests. In: Pennington RT, Lewis GP, Ratter JA, editors. Neotropical savannas and seasonally dry forests. Boca Raton, Fl: CRC Press; 2006. p. 359–381. Available from DOI:https://doi.org/10.1201/9781420004496.
- Pennington RT, and Ratter JA. Neotropical savannas and seasonally dry forests: plant diversity, biogeography, and conservation. Boca Raton, Fl: CRC Press; 2006. DOI:https://doi.org/10.1201/9781420004496.
- Portillo-Quintero C, Sánchez-Azofeifa GA. Extent and conservation of tropical dry forests in the Americas. Biol Conserv. 2010;143(1):144–155. Available from.
- Banda K, Delgado-Salinas A, Dexter KG, et al. Plant diversity patterns in neotropical dry forests and their conservation implications. Science. 2016;353(6306):1383–1387.
- Oliver TH, Heard MS, Isaac NJ, et al. Biodiversity and resilience of ecosystem functions. Trends Ecol Evol. 2015;30(11):673–684.
- Norden N, Chazdon RL, Chao A, et al. Resilience of tropical rain forests: tree community reassembly in secondary forests. Ecol Lett. 2009;12(5):385–394.
- Lawler JJ, Ackerly DD, Albano CM, et al. The theory behind, and the challenges of, conserving nature’s stage in a time of rapid change. Conserv Biol. 2015;29(3):618–629.
- Borcard D, Gillet F, Legendre P. Numerical Ecology with R. New York: Springer-Verlag; 2018. DOI:https://doi.org/10.1007/978-1-4419-7976-6.
- Bailey JJ, Boyd DS, Hjort J, et al. Modelling native and alien vascular plant species richness: at which scales is geodiversity most relevant? Global Ecol Biogeogr. 2017;26(7):763–776.
- Antonelli A, Kissling WD, Flantua SG, et al. Geological and climatic influences on mountain biodiversity. Nat Geosci. 2018;11(10):718–725.
- Hjort J, Heikkinen RK, Luoto M. Inclusion of explicit measures of geodiversity improve biodiversity models in a boreal landscape. Biodivers Conservat. 2012;21(13):3487–3506.
- Gray M. Geodiversity: valuing and conserving abiotic nature. John Wiley & Sons; 2004.
- Schrodt F, Bailey JJ, Kissling WD, et al. Opinion: to advance sustainable stewardship, we must document not only biodiversity but geodiversity. Proc Nat Acad Sci. 2019;116(33):16155–16158.
- Alahuhta J, Ala-Hulkko T, Tukiainen H, et al. The role of geodiversity in providing ecosystem services at broad scales. Ecol Indic. 2018;91:47–56.
- Alahuhta J, Toivanen M, Hjort J. Geodiversity–biodiversity relationship needs more empirical evidence. Nat Ecol Evol. 2020;4(1):2–3.
- Cano E, Veloz A. Contribution to the knowledge of the plant communities of the Caribbean-Cibensean Sector in the Dominican Republic. Acta Botanica Gallica. 2012;159(2): 201–210.
- Hager J, Zanoni TA. La vegetación natural de la República Dominicana: una nueva clasificación. Moscosoa. 1993;7: 39–81. Available from: https://www.biodiversitylibrary.org/item/181315
- Cáceres MD, Legendre P. Associations between species and groups of sites: indices and statistical inference. Ecology. 2009;90(12):3566–3574.
- Zarnetske PL, Read QD, Record S, et al. Towards connecting biodiversity and geodiversity across scales with satellite remote sensing. Global Ecol Biogeogr. 2019;28(5):548–556.
- NASA/USGS. Land processes distributed active archive center. LP DAAC; 2013. Available from: https://lpdaac.usgs.gov/
- NASA LP DAAC. SRTM 1 arc-second global; 2000. [Published Sept 2014; cited May 2016]. Available from: https://earthexplorer.usgs.gov/
- Instituto Nacional de Recursos Hidráulicos. Vuelo fotogramétrico INDRHI. Colección de fotografías aéreas escala 1:20,000 de República Dominicana; 2000-2003.
- Servicio Geológico Nacional. Mapa Geológico de la República Dominicana Escala 1:50,000, Hojas San José de Ocoa (6071-I), La Ciénaga-Sabana Larga (6171-IV), Azua (6071-II) y La Montería (6171-III); 2000. Available from: https://www.sgn.gob.do/images/mapas/cartog_geologica_sgn/cgeo_rd/.
- Hansen MC, Potapov PV, Moore R, et al. High-resolution global maps of 21st-century forest cover change. science. 2013;342(6160):850–853.
- Hansen MC, Potapov PV, Moore R, et al. Global forest change; 2015. Available from: http://earthenginepartners.appspot.com/science-2013-global-forest
- QGIS Development Team. Qgis; 2014. Available from: http://www.qgis.org/
- Gentry AH. Patterns of neotropical plant species diversity. In: Hecht MK, Wallace B, Prance GH, editors. Evolutionary biology. New York: Springer; 1982.p. 1–84. DOI:https://doi.org/10.1007/978-1-4615-6968-8_1.
- Cámara Artigas R, Díaz Del Olmo F. Muestreo en transecto de formaciones vegetales de fanerófitos y caméfitos (I): fundamentos metodológicos. Estudios Geográficos. 2013;74(274): 67–88.
- Licker MD, (publisher). Mcgraw-hill encyclopedia of science & technology. New York: McGraw-Hill Companies; 2007.
- The Document Foundation. LibreOffice; 2015. Available from: http://www.libreoffice.org/
- Acevedo-Rodríguez P, Strong MT. Catalogue of seed plants of the West Indies. In: Smithsonian contributions to botany. Smithsonian Institution; 2012, Vol. 98. p. 1–1192.
- The Plant List. version 1.1; 2013 January 1. Published on the internet. Available from: http://www.theplantlist.org/
- Mejía M Inventario ecoflorístico del nacimiento y de las márgenes del arroyo Parra; 1981.
- Mejia M. La vegetación y la flora de la cuenca del Arroyo Parra, Provincia Peravia. República Dominicana. Moscosoa. 1984;3:127–148. Available from: https://www.biodiversitylibrary.org/item/181575
- R Core Team. R: a language and environment for statistical computing. Vienna (Austria): R Foundation for Statistical Computing; 2015. Available from: https://www.R-project.org/
- Maechler M, Rousseeuw P, Struyf A, et al. Cluster: cluster analysis basics and extensions. R package version 2.0.3 — For new features, see the ‘Changelog’ file (in the package source); 2015. Available from: https://CRAN.R-project.org/package=cluster.
- Kassambara A, Mundt F. “Factoextra”: extract and visualize the results of multivariate data analyses. R package version 1.0.5; 2017. Available from: https://CRAN.R-project.org/package=factoextra
- Liaw A, Wiener M. Classification and regression by random Forest. R News. 2002;2(3):18–22. Available from: https://cran.r-project.org/doc/Rnews/Rnews_2002-3.pdf
- De Cáceres M. How to use the “indicspecies” package. R Package Version. 2013;1(7). Available from: https://cran.r-project.org/web/packages/indicspecies/vignettes/indicspeciesTutorial.pdf
- De Cáceres M, Legendre P, Moretti M. Improving indicator species analysis by combining groups of sites. Oikos. 2010;119(10):1674–1684.
- Hijmans RJ. Raster: geographic data analysis and modeling. R package version 2.5-8; 2016. Available from: https://CRAN.R-project.org/package=raster.
- Bivand R, Keitt T, Rowlingson B. Rgdal: bindings for the geospatial data abstraction library. R package version 1.2-8; 2017. Available from: https://CRAN.R-project.org/package=rgdal
- Wickham H. Reshaping data with the “reshape” package.J Stat Softw. 2007;21(12):1–20.
- Wickham H, Francois R. Dplyr: a grammar of data manipulation. R package version 0.4.3; 2015. Available from: http://CRAN.R-project.org/package=dplyr
- Wickham H. tidyr: easily tidy data with “spread()” and “gather()” functions. R package version 0.3.1; 2015. Available from: http://CRAN.R-project.org/package=tidyr
- Dufrêne M, Legendre P. Species assemblages and indicator species: the need for a flexible asymmetrical approach. Ecol Monogr. 1997;67(3):345–366.
- Oksanen J, Blanchet FG, Friendly M, et al. Vegan: community ecology package. R package version 2.5-6; 2019. Available from: https://CRAN.R-project.org/package=vegan.
- Chao A, Chiu CH. Species richness: estimation and comparison. Wiley StatsRef: Statistics Reference Online; 2016; Available from: https://doi.org/10.1002/9781118445112.stat03432.pub2.
- Martinez Batlle JR, Van Der Hoek Y, Bone C. Clusters of high abundance of plants detected from local indicators of spatial association (lisa) in a semi-deciduous tropical forest.PloS One. 2018;13(12):e0208780.
- Todzia CA. A reevaluation of the genus Phyllostylon (Ulmaceae). SIDA, Contribut Botany. 1992:263–270. Available from: https://www.biodiversitylibrary.org/part/162970
- Grandtner MM. Elsevier’s dictionary of trees. Vol. 1. North America: Elsevier; 2005.
- Ceccon E, Olmsted I, Campo Alves J. Vegetación y propiedades del suelo en dos bosques tropicales secos de diferente estado regeneracional en Yucatán. Agrociencia. 2002;36:5.
- Kinzel H. Influence of limestone, silicates and soil pH on vegetation. In: Lange OL, Nobel PS, Osmond CB, Ziegler H, editors. Physiological plant ecology iii. Berlin: Springer; 1983. p. 201–244. DOI:https://doi.org/10.1007/978-3-642-68153-0_7.
- Bertani DF, Rodrigues RR, Ferreira Batista JL, et al. Análise temporal da heterogeneidade florstica e estrutural em uma floresta ribeirinha. Braz J Bot. 2001;24(1). DOI:https://doi.org/10.1590/S0100-84042001000100002.
- Pizano C, González R, González M, et al. Las plantas de los bosques secos de Colombia. In: Pizano C, García H, editors. El bosque seco tropical en colombia. c. pizano and h. garca, eds., bogotá, dc. Colombia: Instituto de investigaciones alexander von humboldt. Instituto de Investigación de Recursos Biológicos Alexander von Humboldt Bogotá; 2014. p. 48–93. Available from: DOI:https://doi.org/10.21068/b001.2015.202.
- Ferrier S. Mapping spatial pattern in biodiversity for regional conservation planning: where to from here? Syst Biol. 2002;51(2):331–363. Available from.
- Rodrigues AS, Brooks TM. Shortcuts for biodiversity conservation planning: the effectiveness of surrogates. Annu Rev Ecol Evol Syst. 2007;38:713–737. Available from:
- Niittynen P, Heikkinen RK, Aalto J, et al. Fine-scale tundra vegetation patterns are strongly related to winter thermal conditions. Nat Climate Change. 2020;10(12):1143–1148.
- Kemppinen J, Niittynen P, Aalto J, et al. Water as a resource, stress and disturbance shaping tundra vegetation. Oikos. 2019;128(6):811–822.
- Ledo A, Illian JB, Schnitzer SA, et al. Lianas and soil nutrients predict fine-scale distribution of above-ground biomass in a tropical moist forest. J Ecol. 2016;104(6):1819–1828.
- Jones DL. Palms throughout the world. Reed Books; 1995. DOI:https://doi.org/10.5860/choice.33-6292.
- Erickson H, Davidson EA, Keller M. Former land-use and tree species affect nitrogen oxide emissions from a tropical dry forest. Oecologia. 2002;130(2):297–308.
- Dirección de Vida Silvestre y Biodiversidad, Ministerio de Medio Ambiente y Recursos Naturales. Especies exóticas invasoras en la República Dominicana. Última revisión: febrero 2010; 2010. [Online; accessed agosto-2017]. Available from: http://ambiente.gob.do/wp-content/uploads/2016/10/Registros-Especies-Exoticas-Potencialmente-Invasoras.pdf
- Lowe S, Browne M, Boudjelas S, et al. 100 of the world’s worst invasive alien species: a selection from the global invasive species database. Invasive Species Specialist Group Auckland; 2000. Vol. 12. DOI:https://doi.org/10.1163/9789004278110_019.
- Yanes CV, Muñoz AIB, Silva MIA, et al. Árboles y arbustos nativos potencialmente valiosos para la restauración ecológica y la reforestación. México D.F (México): Instituto de Ecología, Universidad Nacional Autónoma de México. 2001; Available from: http://ixmati.conabio.gob.mx/conocimiento/info_especies/arboles/doctos/inicio.pdf
Appendix
Appendix A. Morpho-topographic, geological and land use attributes of the transects
Table A1. Morpho-topographic, geological and land use attributes of the transects