
ABSTRACT
Bergmann’s rule is one of the most vigorously debated ecogeographic patterns but has rarely been examined in Neotropical bats. Herein, I examined Bergmann’s rule in Carollia perspicillata and Artibeus lituratus along an elevation gradient of 2500 m at both inter- and intraspecific level. I measured 384 specimens from collections belonged to C. perspicillata (89 ♀, 102 ♂) and A. lituratus (89 ♀, 104 ♂). The size of C. perspicillata increased with increasing elevation and decreasing temperature, whereas A. lituratus showed the converse pattern. For both species, females did not differ between elevation categories, contrary to males that were larger above 1000 m in C. perspicillata, but smaller in A. lituratus. Conformity to Bergmann’s rule depends on bat size and sex. Despite C. perspicillata follows the pattern, the explanatory mechanisms still need to be understood. By contrast, A. lituratus follows the converse of Bergmann’s rule due to naked and highly vascularized wings that aid thermoregulation in warmer environments. Male size is more sensitive to changes in temperature for both species which may be partially explained by sexual selection. Elevation and temperature are not the only factors related to bat morphology and other mechanisms may explain size in bats.
Introduction
The interaction between animals and their environment modulates the variation of body size [Citation1]. Animal size determines the organization of biological communities [Citation2] as well as the physiological and ecological features associated to energy acquisition and expenditure [Citation3]. The mountains of the world are complex ecosystems where species have evolved under harsh environmental pressures including low temperatures, strong winds, and low net primary productivity [Citation4–6]. Therefore, mountain ecosystems offer many opportunities for testing ecological and evolutionary theories of species adaptations by comparative observations along broad environmental gradients [Citation7], thus providing key information for forecast the effects of global change over animal communities in the coming years. For instance, the study of temperature-body size relationship has remarkable implications for understanding how size of animals will respond to climate change [Citation8]. This relation is framed in a biogeographic pattern described more than 170 years ago, known as the Bergmann’s rule [Citation9].
On its original statement, Bergmann’s rule poses that in colder climates endotherms have larger body size than closely related species from warmer climates because of heat conservation [Citation9–11]. In this sense, larger animals display a low surface/volume ratio as a mechanism that precludes energy dissipation in colder environments [Citation12]. However, this pattern has been extended to the population scale [Citation12–14], and other mechanisms have been proposed to explain the variation in body size such as food availability [Citation3,Citation15,Citation16], thermoregulation by insulative properties of fur [Citation17], habitat availability [Citation18], migration, phylogeny, among others [Citation15]. Broadly speaking, latitude has been traditionally employed at large geographical scales as a surrogate of temperature [Citation1,Citation11,Citation14], yet they are not always correlated [Citation19]. Furthermore, at small continental scales (e.g. geographical distribution of a species in a country) latitude does not reflect a broad temperature gradient [Citation20]. Elevation, instead, is a reliable proxy of temperature at finer scales considering the inverse relation between mean atmospheric temperature and altitude [Citation7]. For instance, it has been established in the Andean region of Colombia that for every 1000 m elevation there is a decline of 6.5 °C [Citation21].
As generally occurs with other biogeographical patterns, Bergmann’s rule may vary across different vertebrate species, thus being important to evaluate its validity on taxa that has not been extensively assessed as is the case with flying mammals. Particularly in bats, Bergmann’s rule has rarely been examined explicitly at both intra- and interspecific level [Citation22], since the existing studies in mammals either do not separate bats from all other mammals or omit bats altogether [Citation2,Citation18]. Likewise, in the few studies conducted on bats, the category of analysis has focused on the level of order [Citation22] and family [Citation23] and have pointed out a Bergmann’s rule converse explained by biophysical features of wings (e.g. naked and highly vascularized membranes) that increase the surface/volume ratio in comparison to other endotherms of similar body size. However, studies assessing this pattern between species and sexes are still missing. In this regard, considering that body size is a crucial determinant of reproductive success in bats [Citation24,Citation25], the variation of this trait entails important divergent consequences for males and females [Citation24]. This is especially true for species characterized by highly polygynous mating systems, wherein males, body size influences mating access to receptive females and territory acquisition [Citation24], and in the case of females, size enables faster flights and to carry a greater amount of resources to rearing offspring [Citation25,Citation26]. Nonetheless, it is still unknown the intraspecific body size variation for several species and, in particular, from Neotropical bat faunas which are highly diverse.
Among New World bats, Phyllostomidae is the most ecologically diverse family and the most speciose with 225 recognized species in nearly 60 genera [Citation27]. Despite phyllostomid bats represent many opportunities for investigating biogeographical patterns due to the fact that they inhabit a wide variety of habitats from the sea level to the upland regions of the Neotropics, there are few studies that have evaluated whether bats obey the Bergmann’s rule, especially on frugivorous species [Citation20,Citation28,Citation29]. Additionally, results from these studies are contradictory and employ the latitude as a surrogate of temperature rather than altitude which may be a more appropriate gradient for testing the rule at small geographical scales. Specifically, Carollia perspicillata (Linnaeus, 1758) and Artibeus lituratus (Olfers, 1818) are common frugivorous bats with altitudinal distributions that extends from the sea level to over 2500 m elevation. The former is a medium-sized bat (Body mass: 18.5 g, total length: 66–95 mm) distributed from southern Mexico to southern Bolivia, Paraguay, and Brazil and is specialized in the consumption of Piper plants [Citation28,Citation30]. The latter is a big-sized bat (Body mass: 65.9 g, total length: 82–87 mm) distributed from central Mexico to northcentral Argentina that consumes mainly Ficus and Cecropia plants [Citation31,Citation32]. Both species are suitable for testing Bergmann’s rule because of their broad altitudinal distribution across 2500 m elevational gradient.
Following an elevation transect, I tested to what extent the pattern described by Bergmann’s rule applies to Colombian populations of C. perspicillata and A. lituratus. I hypothesized that bats don’t obey Bergmann’s rule as larger sizes in colder environments would represent a high energy expenditure due to the naked and highly vascularized wing membranes. Herein, I propose that bats follow a converse pattern of Bergmann’s rule [Citation20,Citation23] (). At a more detailed analysis, I also examined whether Bergmann’s rule apply differently to male and female bats of each species by analyzing their relations between size and temperature variables and by comparing between elevation categories (i.e. below 1000 m vs above 1000 m). Because males and females have different ecological and reproductive trade-offs [Citation33–35] and body size highly influences reproductive rates [Citation24], I hypothesized that for both species, males and females will differ in their relations between size and climatic variables as well as in the size comparisons between elevation categories ().
Figure 1. Hypothesis expected of Bergmann’s rule converse for the two phyllostomid species (Carollia perspicillata and Artibeus lituratus). This statement poses an increase in body size with decreasing elevation and increasing temperature (Hypothesis 1). For both species, differences in size between males and females along the elevation is also expected (Hypothesis 2).
Materials and methods
Bat specimens
I obtained wing measurements from 384 bat vouchers from the Mammalian Collection at the Museo Javeriano de Historia Natural of Pontificia Universidad Javeriana (MPUJ-MAMM) (Bogotá, Colombia). All were dry specimens and corresponded to adults solely. I excluded bat specimens in a bad state of preservation (i.e. broken wings). I measured 191 specimens belonged to C. perspicillata (89 ♀, 102 ♂) and 193 belonged to A. lituratus (89 ♀, 104 ♂) (Appendix 1). Identification of each specimen was corroborated with taxonomic keys from Gardner [Citation31].
Spatial information
The specimens belonged to 26 localities from 12 departments and 24 municipalities encompassing the Andean, Llanos, Pacific, and Caribbean regions as described in , and . This information was collected from the skin tag of each specimen. For climatic variables, I used Climatologies at high resolution (30 arc sec, ~1 km) for the Earth land surface areas (CHELSA 1.2 http://chelsa-climate.org/). In the CHELSA database, monthly and annual mean temperatures are provided for the time period 1979–2013, which is the time period where the specimens examined were collected (Appendix 1). Thus, I included Mean Annual Temperature (MAT), Mean Diurnal Range (MDR), Isothermality (ISO), Temperature Seasonality (TS), Max Temperature of Warmest Month (MTWM), Min Temperature of Coldest Month (MTCM), and Temperature annual range (TAR) (). To obtain elevation from each site, Worldclim 2.1 database (https://www.worldclim.org/) was employed from the coordinates of each location (Appendix 2). To process spatial information, Qgis software was used [Citation36].
Figure 2. Locations of C. perspicillata and A. lituratus from Colombia. Linear regression between elevation and mean atmospheric temperature of the locations shows an inverse relation (R2 = 0.96; β = −0.0048; P < 0.0001; Std. error = 0.0002; t = −23.73; n = 26). Codes of each site are described in .
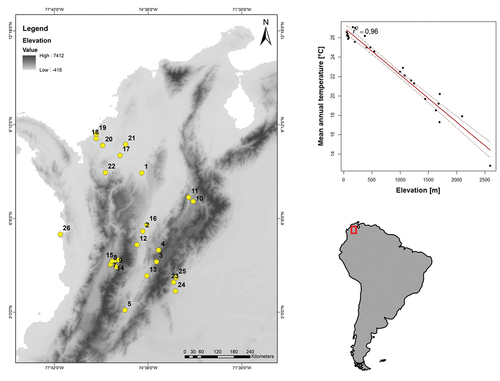
Table 1. Climatic variables of the 26 sites analyzed in the study. Sites are organized by biogeographic regions (CAPITALS) and departments (bold). Code of each site represents geographic coordinates (Appendix 2) shown in . Mean Annual Temperature (MAT), Mean Diurnal Range (MDR), Isothermality (ISO), Temperature Seasonality (TS), Max Temperature of Warmest Month (MTWM), Min Temperature of Coldest Month (MTCM), and Temperature annual range (TAR). Units of MAT, MDR, TS, MTWM, MTCM, and TAR are in °C, ISO in %, and Elevation in m
Size measurements
Even though body mass has been established as the gold standard for estimating bat size, many sources of variation that are not often reported in biological collections can result in a less accurate measure of size; for example, reproductive condition, seasonality, and the effect of different amounts of food within digestive system [Citation25]. Moreover, the information of body mass found in the skin tag is biased to the measurements obtained by different researchers and by equipment accuracy employed to weight each bat. Therefore, to avoid issues related to body mass and researcher bias, I measured forearm length of the right wing from all individuals, considering that this is the most reliable, easy, and common measure for estimating size in bats [Citation22,Citation25,Citation37–39]. All measurements were taken using a digital calliper (Mitutoyo Calibrador Vernier Mod Cd6 -csx 150 Mm) with an accuracy of 0.01 mm.
Statistical analysis
For both species, I calculated the statistical mean and standard deviation of forearm length at each locality. To explore relationships between body size, elevation and temperature, I made individual linear regression analyses between forearm length and elevation and between forearm length and MAT for both species. I also performed linear regressions between forearm length and each one of the seven aforementioned climatic variables for males and females of each species. As expected, elevation was highly related to MAT (). The conformity of Bergmann’s rule is supported when the slope (β) in the elevation-forearm length and temperature-forearm length relationships are greater than zero (β > 0) [Citation23] and lesser than zero (β < 0), respectively. The reverse pattern for both elevation (β < 0) and temperature (β > 0), however, shows the converse to Bergmann’s rule [Citation20]. Forearm length was standardized by subtracting the mean to each data (xi–x). Considering the marked differentiation in altitude established between lowland habitats (<1000 m) and Neotropical montane environments (>1000 m) (Sensu Castaño et al. [Citation40]), I compared individuals between two elevation categories (below 1000 m vs above 1000 m) for each species and sex by using U Mann Whitney test (U). For quantifying the effect size, Glass rank biserial correlation (rrb) was obtained as well as 95% confidence interval (CI). All the analyses were performed in Rwizard 4.3 [Citation41] and JASP 0.13.1.0 [Citation42]. In all the tests, P < 0.05 defined the level of statistically significant difference.
Results
Patterns in species
Overall, forearm length in C. perspicillata varied from 35.29 mm to 47.31 mm and for A. lituratus values ranged from 56.2 mm to 79.58 mm. Means and standard deviations of each locality are described in . Significant relationships were detected between temperature and size for both species (). Size in C. perspicillata increased with increasing elevation (R2 = 0.063; β = 0.0007; P < 0.001; Std. error = 0.0002; t = 3.571; n = 191) and decreasing temperature (R2 = 0.061; β = −0.1559; P < 0.001; Std. error = 0.044; t = −3.52; n = 191), whereas in A. lituratus size decreased with increasing elevation (R2 = 0.031; β = −0.0009; P = 0.0139; Std. error = 0.0003; t = −2.497; n = 193) and decreasing temperature (R2 = 0.044; β = 0.238; P = 0.0031; Std. error = 0.0795; t = 2.995; n = 193). The comparisons between elevation categories showed differences for both species, but C. perspicillata was larger above 1000 m elevation (U = 3080.5; P < 0.001; df = 189; rrb = 0.311; CI = 0.154, 0.452), while A. lituratus was larger below 1000 m elevation (U = 6131; P < 0.001; df = 191; rrb = −0.392; CI = −0.525, −0.242) ().
Figure 3. Relationships of standardized length of forearm and (a) elevation and (b) mean annual temperature. Red color corresponds to Carollia perspicillata and aquamarine corresponds to Artibeus lituratus.
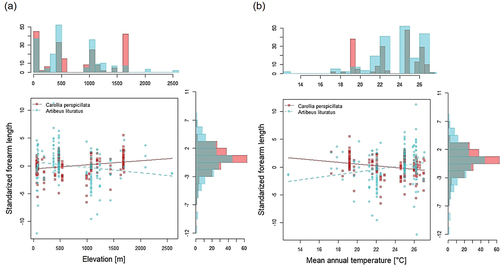
Figure 4. Comparisons of forearm length (mm) between below 1000 and above 1000 m elevation in (a) Carollia perspicillata as species (b) Carollia perspicillata males (c) Carollia perspicillata females (d) Artibeus lituratus as species (e) Artibeus lituratus males and (f) Artibeus lituratus females.
Table 2. Forearm length of specimens examined from Carollia perspicillata and Artibeus lituratus for each study site. Values of mean are in mm
Patterns in sexes
In C. perspicillata all climatic variables, excluding TAR, showed significant relationships with males’ size, but none of them correlated with females’ size (). In the case of A. lituratus females’ size presented significant relationships with three variables (MDR, MTWM, TAR, ), whereas males’ size displayed significant relationships with four variables (MAT, ISO, TS, MTWM, ). Surprisingly, for both species, the females did not differ between the elevation categories (C. perspicillata, U = 812; P = 0.213; df = 87; rrb = 0.156; CI = −0.087, 0.382 and A. lituratus U = 995; P = 0.160; df = 87; rrb = −0.189; CI = −0.425, 0.071), contrary to males; that is, in C. perspicillata males were larger above 1000 m (U = 719.5; P < 0.001; df = 100; rrb = 0.439; CI = 0.239, 0.603), while males of A. lituratus showed the inverse pattern (U = 704; P < 0.001; df = 102; rrb = −0.474; CI = −0.629, −0.284) ().
Figure 5. Relationships of standardized length of forearm length and environmental variables including: (a) Elevation, (b) Mean Annual Temperature, (c) Isothermality, (d) Temperature Seasonality, (e) Mean Diurnal Range, (f) Max Temperature of Warmest Month, (g) Min Temperature of Coldest Month, and (h) Temperature annual range. For both species, “m” and “f” represent males and females, respectively.
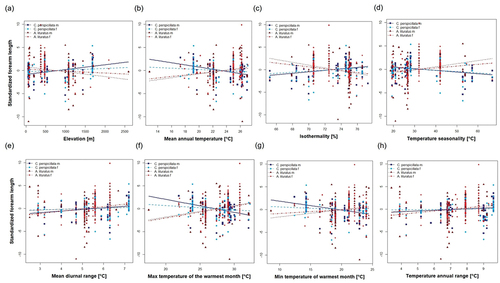
Table 3. Linear regressions between forearm length and climatic variables for each sex of Carollia perspicillata and Artibeus lituratus. Bold represents significative values (P < 0.05). Mean Annual Temperature (MAT), Mean Diurnal Range (MDR), Isothermality (ISO), Temperature Seasonality (TS), Max Temperature of Warmest Month (MTWM), Min Temperature of Coldest Month (MTCM) and Temperature annual range (TAR)
Discussion
The conformity of Bergmann’s rule differs depending on the size and sex of the frugivorous bat analyzed. From a heat transfer perspective, it has been argued that small species should compensate for low temperatures with increasing body size because they have little leeway for changing fur depth or hair density, thus following Bergmann’s rule [Citation12,Citation43,Citation44]. In stark contrast, larger species may increase fur densities rather than body size to increase thermal insulation in cold environments and hence Bergmann’s rule should be weak [Citation43,Citation44]. However, other studies have posed that larger species are more likely to follow Bergmann’s rule than smaller ones [Citation45] or that there is no special tendency for body size when analyze this pattern [Citation19]. My results suggest that size matters when analyzing the strength of Bergmann’s rule on Neotropical frugivorous bats. Size is related to body temperature, which means that large bats can better regulate their temperature than medium-small bats [Citation46], but ecological mechanisms other than thermoregulation may explain these results (see more discussions below).
In C. perspicillata, size increased slightly in low-temperature regions at higher elevations contrary to my hypothesis (). Same results have been found not only for this species but also for closely related taxa such as C. brevicauda, C. subrufa, and C. castanea [Citation28] and other frugivorous Old World pteropodids [Citation24]. Nonetheless, these results are contrary to the study of Barros et al. [Citation20] conducted in Brazil where the size of C. perspicillata showed a decrease toward higher latitudes and an increase with increasing temperature. However, neither temperature was directly related to size nor did the assessed latitudinal gradient encompass a broad variation of temperature (0.2469 N; MAT = 27°C–23.0578 S; MAT = 23°C, Barros et al. [Citation20]), in contrast to the elevational transect analyzed here where measured individuals were obtained from low elevation sites (51 m; MAT = 26.6 °C) to upper Andean montane forests (2594 m; MAT = 12.8 °C), which represents a suitable environmental gradient with a more accurate climate data acquisition (). Some studies suggest that latitude is a crude proxy for environmental conditions [Citation8,Citation19,Citation22,Citation45] and therefore the usage of environmental variables obtained from global climatic databases may be more appropriate to test Bergmann’s rule.
Bearing in mind that in the upper Andean mountains where the MTCM can reach 8.6 °C () and that wing membranes constitute an extreme exposure to the environment, it is counterintuitive to explain the size increase in C. perspicillata by conservation heat hypothesis as has been traditionally suggested for other mammals [Citation13,Citation15,Citation19,Citation45]. Although the increase in size entails a decrease in mass-specific metabolic rate, total metabolic rate and wing area tend to increase, which may be energetically detrimental in resource-limited habitats [Citation3,Citation43]. Other physiological, ecological, behavioural and/or evolutionary mechanisms may offer alternative explanations to this pattern.
In the case of the large fruit bat A. lituratus, size increased in warmer sites at lowlands and decreased in colder environments of mountainous ecosystems (), following the converse to Bergmann’s rule [Citation20], which is in agreement with my hypothesis (). To the best of my knowledge, this is the first study assessing Bergmann’s rule in Artibeus. As mentioned before, probably in large bats with wide naked and highly vascularized wings [Citation38,Citation47,Citation48], the increase in size in colder environments may represent a metabolic disadvantage because of the increment in wing surface that increases energy loss to surrounding air by convection. Wings are important for thermoregulation by easily releasing heat [Citation48] but are not able to retain heat contrary to birds whose wings are covered by feathers [Citation23]. In this sense, large bats tend to be bigger in warmer sites where having a high wing area with greater vasodilation aids for dissipating excess heat during flights [Citation47], whereas in colder regions they require to store energy by reducing the wing exposure with a decreasing in size. Alternatively, since species consumed by A. lituratus such as Cecropia and Ficus are more abundant in the lowlands but decrease in upper mountain forests [Citation40], bat size may also be explained by the resource availability of the ecosystems they inhabit [Citation49].
In general, there are few evidences about the application of Bergmann’s rule in bats, nevertheless its conformity depends on the scale analysis. At the order level, bats do not follow the rule [Citation8,Citation22], neither at the family level [Citation23]. However, at inter- and intraspecific level it is possible to find contrasting patterns as the results of my study suggest (). This emphasizes the relevance of including multiscale analysis when studying ecogeographical rules. Besides the distinctive patterns between species outlined above, I found differences between the sexes for each species as expected (, ). Even though the magnitude and direction of sexual dimorphism are often mirrored in the interplay between sexual selection on males and fecundity selection on females [Citation24,Citation25], I found that in a monomorphic species such as C. perspicillata [Citation28,Citation30,Citation50], males’ size is related with most of the climatic variables (), whereas in a species where females are larger than males like A. lituratus [Citation50,Citation51], the relationship with temperature depend on the variable analyzed but most of them are related with males’ size (). These results highlight that males are more sensitive to changes in temperature for both species, while females showed to be more resilient. Hence, in cold environments for C. perspicillata smaller males are filtered out and larger males are favoured, whereas for A. lituratus larger males are excluded and smaller males are selected. This is important considering that males must compete for mates as a consequence of strong sexual selection in both species [Citation28,Citation34]. Nevertheless, further studies should test the mechanisms by which this tendency occurs. For instance, since in both species males require higher energetic demands to harem maintenance [Citation33,Citation34,Citation52], changes of temperature may select for specific sizes that enable a better energetic efficiency in each environment. In addition, considering the sharp difference of diet between sexes as has been reported in C. perspicillata [Citation35], changes in fruit resources along environmental gradients may be reflected in size of males and females according to food availability hypothesis [Citation12,Citation15,Citation16,Citation49].
In spite of the significant relationships found between forearm length and temperature, the effect size was low (). It is likely that other environmental variables explain the variation of bat size as has been proposed in several studies with mammals and birds species [Citation1,Citation8,Citation10,Citation11,Citation16,Citation23]. Furthermore, it is important to mention that behavioural strategies and habitat use may influence thermoregulation in bats, especially in very common frugivorous species as the ones analyzed in this study. For example, the establishment of groups improves social thermoregulation [Citation53], and the selection of several roosts such as caves, hollow trees, fallen trees, culverts, tunnels, foliage, among others [Citation54], isolates bats from external conditions of the environment. Moreover, the posture can affect surface area exposed to the environment [Citation44] and fur characteristics may also contribute to thermal insulation [Citation43], yet these two features are far from being well understood in Neotropical bats and could help explain the potential mechanisms associated to thermoregulation and size variation. Intra- and interspecific competition has also been proposed as a potential mechanism that explains body size, since individuals with reduced competition tend to be greater in size [Citation16,Citation19]. Thus, the influence of temperature on body size may have a lesser effect, which underlines the potential role of other abiotic and biotic factors that should be further explored [Citation23,Citation55].
In conclusion, C. perspicillata followed Bergmann’s rule but A. lituratus conformed to the reverse pattern. Bearing in mind that wide naked and highly vascularized wings can dissipate the excess of heat in warmer environments, it is very likely to find a positive relationship between size and temperature in A. lituratus as my results showed. However, this is less clear for C. perspicillata, and mechanisms other than heat conservation hypothesis should be explored to explain the pattern found. Notably, males were more sensitive to changes in temperature for both species but with contrasting patterns, while females showed no consistent relations with temperature variation. That is, in C. perspicillata larger males were selected in cold environments, whereas in A. lituratus larger males were selected in warm environments. Other phylogenetically related species with a wide distribution along temperature gradients such as Sturnira, Dermanura, or Glossophaga are suitable biological models for testing the rule in further studies. Importantly, temperature explain little of size variance, which suggest that many other features including ecological (e.g. habitat use, diet, intra- and interspecific competition), behavioural (e.g. posture, social thermoregulation), morphological (e.g. fur depth, hair density), and evolutionary mechanisms (phylogenetic constraints) should be examined to better understand Bergmann’s rule in Neotropical bats.
Acknowledgments
I am very grateful to Jairo Pérez-Torres, the curator of the Mammalian Collection of Museo Javeriano de Historia Natural from Pontificia Universidad Javeriana (Bogotá, Colombia), for allowed me to access the specimens of the Collection. All my gratitude also goes to Laura L. Garzón-Salamanca for the elaboration of the map () and to Diego Soler for his help with the obtention of environmental variables and for his comments and insightful ideas in data analysis and discussion. Finally, I want to thank to the two reviewers and the editor for the comments and suggestions that improved the quality of this manuscript.
Disclosure statement
No potential conflict of interest was reported by the author(s).
Additional information
Funding
Notes
1. Data availability statement: All data associated with this study are available from the Open Science Framework (OSF) repository: https://osf.io/y6ct7/
References
- Mori E, Ancillotto L, Lovari S, et al. Skull shape and bergmann’s rule in mammals: hints from old world porcupines. J Zool. 2019;308(1):47–55.
- Rodriguez MA, Lopez-Sanudo IL, Hawkins BA. The geographic distribution of mammal body size in Europe. Glob Ecol Biogeogr. 2006;15(2):173–181.
- McNab B. On the ecological significance of bergmann’s rule. Ecology. 1971;52(5):845–854.
- Körner C, Paulsen J, Spehn EMA. definition of mountains and their bioclimatic belts for global comparisons of biodiversity data. Alp Botany. 2011;121(2):73–78.
- Moser G, Leuschner C, Hertel D, et al. Elevation effects on the carbon budget of tropical mountain forests (S Ecuador): the role of the belowground compartment. Global Chang Biol. 2011;17(6):2211–2226.
- Körner C, Spehn E. A humboldtian view of mountains. Science. 2019;365(6458):1061.
- Körner C. The use of ‘altitude’ in ecological research. Trends Ecol Evol. 2007;22(11):569–574.
- Riemer K, Guralnick RP, White EP. No general relationship between mass and temperature in endothermic species. Elife. 2018;9(7):e27166.
- Bergmann C. Ueber die verha¨ ltnisse der wa¨rmeo¨ konomie der thiere zu ihrer gro¨ sse. Gottinger studien. 1847;3:595–708.
- Mayr E. Geographical character gradients and climatic adaptation. Evolution. 1956;10(1):105–108.
- James FC. Geographic size variation in birds and its relationship to climate. Ecology. 1970;51(3):365–390.
- Watt C, Mitchell S, Salewski V. Bergmann’s rule; a concept cluster? Oikos. 2010;119(1):89–100.
- Meiri S, Dayan T. On the validity of bergmann’s rule. J Biogeogr. 2003;30:331–351.
- Fan L, Cai T, Xiong Y, et al. Bergmann’s rule and Allen’s rule in two passerine birds in China. Avian Res. 2019;10(1):34.
- Blackburn TM, Gaston KJ, Loder N. Geographic gradients in body size: a clarification of bergmann’s rule. Diversity & Distributions. 1999;5(4):165–174.
- Meiri S, Yom-Tov Y, Geffen E. What determines conformity to bergmann’srule? Global Ecol Biogeogr. 2007;16(6):788–794.
- Geist V. Bergmann’s rule is invalid. Can J Zool. 1987;65(4):1035–1038.
- Rodriguez MA, Olalla-Tarraga MA, Hawkins BA. Bergmann’s rule and the geography of mammal body size in the Western Hemisphere. Glob Ecol Biogeogr. 2008;15:173–181.
- Ashton KG, Tracy MC, Queiroz A. Is bergmann’s rule valid for mammals? Am Nat. 2000;156(4):390–415.
- Barros LA, Fortes R, Lorini ML. The application of bergmann’s rule to carollia perspicillata linnaeus 1758 (Mammalia, Chiroptera). Chiroptera Neotropical. 2014;20:1243–1251.
- Instituto de Hidrología Meteorología y Estudios Ambientales (IDEAM). Atlas climatológico de Colombia. Bogotá: IDEAM; 2005.
- Safi K, Meiri S, Jones KE. Body mass evolution in bats. In: Smith FA, Lyons SK, editors. Animal body size: linking pattern and process across space, time, and taxonomic group. Chicago: Chicago University Press; 2013. p. 95–151.
- Gohli J, Voje KL. An interspecific assessment of Bergmann’s rule in 22 mammalian families. BMC Evol Biol. 2016;16(1):222.
- Storz JF, Balasingh J, Bhat HR, et al. Clinal variation in body size and sexual dimorphism in an Indian fruit bat, Cynopterus sphinx (Chiroptera: pteropodidae). Biol J Linn Soc Lond. 2001;72(1):17–31.
- Wu H, Jiang T, Huang X, et al. A test of rensch’s rule in greater horseshoe bat (rhinolophus ferrumequinum) with female-biased sexual size dimorphism. PLoS ONE. 2014;9(1):e86085.
- Stevens R, Johnson M, McCulloch E. Absolute and relative secondary-sexual dimorphism in wing morphology: a multivariate test of the ‘big mother’ hypothesis. Acta Chiropt. 2013;15(1):163–170.
- Mammal Diversity Database [Internet]. Version 1.6. cited 2021 Oct 23. Available from: https://www.mammaldiversity.org/taxa.html
- McLellan LJ. A morphometric analysis of Carollia (Chiroptera, Phyllostomidae). Am Mus Novit. 1984;2791:1–35.
- Owen JG, Schmidly DJ, Davis WB. A morphometric analysis of three species of Carollia (Chiroptera, Glossophaginae) from Middle America. Mammalia. 1984;48(1):85–93.
- Cloutier D, Thomas DW. Carollia perspicillata. Mamm Species. 1992;417:1–9.
- Gardner AL, ed. Mammals of South America. Volume 1: marsupials, xenarthrans, shrews, and bats. Chicago: The University of Chicago Press; 2007.
- Muñoz J. Los murciélagos de Colombia: sistemática, distribución, descripción, historia natural y ecología. Medellín: Editorial Universidad de Antioquia; 2001.
- Altringham JD. Bats: biology and behaviour. United Kingdom: Oxford University Press; 1996.
- Ortega J, Guerrero JA, Maldonado JE. Aggression and tolerance by dominant males of Artibeus jamaicensis: strategies to maximize fitness in harem groups. J Mammal. 2008;89(6):1372–1378.
- Alviz A, Pérez-Torres J. A difference between sexes: temporal variation in the diet of carollia perspicillata (chiroptera, phyllostomidae) at the macaregua cave, santander (Colombia). Anim Biodivers Conserv. 2020;43(1):27–35.
- QGIS.org, 2021. QGIS geographic information system. QGIS Association. Cited 2021 May 12]. Available from 2021 May 12: http://www.qgis.org
- Dietz C, Dietz I, Siemers BM. Wing measurement variations in the five European horseshoe bat species (Chiroptera: rhinolophidae). J Mammal. 2006;87(6):1241–1251.
- Castillo-Figueroa D. Ecological morphology of neotropical bat wing structures. Zool Stud. 2020;59:60.
- Castillo-Figueroa D, Pérez-Torres J. On the development of a trait-based approach for studying neotropical bats. Pap Avulsos Zool. 2021;61:e20216124.
- Castaño JH, Carranza JA, Pérez-Torres J. Diet and trophic structure in assemblages of montane frugivorous phyllostomid bats. Acta Oecol. 2018;91:81–90.
- Guisande C, Heine J, González-DaCosta J, et al. 2014. RWizard Software. [Cited 2021 May 23]. Available from: http://www.ipez.es/rwizard.
- JASP Team (2020). JASP (Version 0.14.1). Cited 2021 May 12]. Available from 2021 May 12: https://jasp-stats.org/
- Steudel KW, Porter P, Sher D. The biophysics of bergmann’s rule: a comparison of the effects of pelage and body size variation on metabolic rate. Can J Zool. 1994;72(1):70–77.
- Porter WP, Munger JC, Stewart WE, et al. Endotherm energetics: from a scalable individual-based model to ecological applications. Aust J Zool. 1994;42(1):125–162.
- Freckleton RP, Harvey PH, Pagel M. Bergmann’s rule and body size in mammals. Am Nat. 2003;161(5):821–825.
- Soriano P. Functional structure of bat communities in tropical rainforests and Andean cloud forests. Ecotropicos. 2000;13(1):1–20.
- Kluger MJ, Heath JE. Vasomotion in the bat wing: a thermoregulatory response to internal heating. Comp Biochem Physiol. 1970;32(2):219–226.
- Makanya A, Mortola J. The structural design of the bat wing web and its possible role in gas exchange. J Anat. 2007;211(6):687–697.
- Rosenzweig ML. The strategy of body size in mammalian carnivores. Am Midl Nat. 1968;80(2):299–315.
- Hurtado N, Sepúlveda R, Pacheco V. Sexual size dimorphism of a sensory structure in a monomorphic bat. Acta Chiropt. 2015;17(1):75–83.
- Castillo-Figueroa D. Fluctuating asymmetry of three bat species in extensive livestock systems of córdoba department, Colombia. Rev Colomb Cienc Anim. 2018;10(2):143–153.
- McCracken GF, Wilkinson GS. Bat mating systems. In: Krutzsch PH, editor. Reproductive biology of bats. San Diego United States: Academic Press, A Harcourt Science and Technology Company; 2000. p. 321–357.
- Kerth G. Causes and consequences of sociality in bats. Bioscience. 2008;58(8):737–746.
- Voss RS, Fleck DW, Strauss RE, et al. Roosting ecology of Amazonian bats: evidence for guild structure in hyperdiverse mammalian communities. Am Mus Novit. 2016;3870(3870):1–44.
- Hendges CD, Patterson B, Cáceres NC. Big in the tropics: ecogeographical clines in peccary size reveal the converse of bergmann’s rule. J Biogeogr. 2021;48(5):1228–1239.