
ABSTRACT
The Swietenia macrophylla King (Meliaceae) mahogany tree is widely spread in the neotropics. In Ecuador, it has a wide distribution range from the coastal zone to the Amazon. The mahogany tree is an endangered species due the overexploitation of the high commercial value of its wood. This study is aimed to characterize the Simple Sequence Repeat (SSR) variability of 123 trees selected from six provinces of Ecuador. The results showed that the natural mahogany population had a low level of genetic diversity (A = 6.9; Ho = 0.39; He = 0.43) and a significant heterozygous deficit inbreeding coefficient (F = 0.16). The probability of identity (PI) of the 12 microsatellite markers was low 4.3 × 10⁻⁹ and the cumulative exclusion probability of 99.99%. Additionally, the relatedness coefficient among individuals was −0.010 (se = 0.004). The genetic diversity among populations was moderate (ΦST = 8%). In addition, the structure analysis showed two genetic groups; however, it was possible to distinguish admixture within the entire range evaluated. These results show the need to establish strategies that allow the recovery and increase of the genetic diversity in natural populations, especially with the selection of trees to harvest seeds, as well as crossing the tree genetic pool to recombine their diversity.
Introduction
Swietenia macrophylla King belongs to the family Meliaceae, commonly known as mahogany, aguano, and caoba; it is native to the neotropical region of America, and it is spread from southern Mexico to the North of Brazil [Citation1]. In Ecuador, the tree is spread along the Coast and Amazon regions at a height of less than 1000 m.a.s.l. (meters above sea level).
The mahogany tree can reach 40 m in height, with an open compact and rounded crown composed of thick, ascending, and twisted branches, fissured and exfoliated bark in small plates, and persistent leaves monoecious, self-incompatible, and insect-pollinated trees [Citation2].
Worldwide, the species has significant commercial value due to the color, high density, and durability of its wood, qualities that allow them to have a competitive advantage in local and international markets. However, these same qualities become disadvantages because they have increased in the extraction and over-exploitation of mahogany, which has had an enormous impact on its natural populations and genetic variability throughout its habitat [Citation3]. The mahogany population is suffering constant pressure to extract valuable wood in different regions of Mesoamerica. Currently, individuals are isolated or small forest fragments with reduced populations at local and regional scales. Ecuador is not an exception, even if some provinces have more individuals because there are still forest remnants, and the agro-ecosystem can still maintain adult trees. In such a condition, the mahogany tree forest provides shade to crops such as coffee and cocoa in low-input agricultural models. In Ecuador coastal provinces, the mahogany forest has a high degree of disturbance by anthropogenic activity. In this regard, socioeconomic conditions have forced a change in land use, increasing the deforestation rate.
Additionally, poor regeneration of the mahogany tree is the leading cause of the low densities of this species. This scenario is similar in other countries where S. macrophylla densities have gradually decreased. This dynamic is consistent with that reported by [Citation3], who points out that low tree densities (0.1–2.5 ha-1) are frequent in some Central American countries.
In Ecuador, mahogany trees have been in the endangered category since 2003, at it is listed in Appendix II of the Convention on International Trade in Endangered Species of Wild Fauna and Flora (CITES). Due to its current condition, it is necessary to consider studies on its management and ecology [Citation4], even establishing rapid tracking mechanisms of mahogany wood through near-infrared spectroscopy [Citation5].
Similarly, other species in this genus, such as S. humilis and S. mahagony, are undergoing the same detriment process to their natural populations [Citation3,Citation6]. With reducing the natural populations resulting from deforestation and habitat deterioration, every year will be more challenging to recover and maintain the genetic diversity of this species in Ecuador through conservation or improvement strategies [Citation7]. In this regard, tropical ecosystems in Ecuador have been heavily disturbed, having a strong impact on provinces as Guayas, Manabí, Los Ríos, El Oro, Loja, and Napo, where mahogany densities are constantly decreasing, a similar tendency has been reported in Central America [Citation3,Citation8] and in the Brazilian Amazon [Citation9,Citation10].
Considering the situation of S. macrophylla in the tropical areas of Ecuador, it is important to carry out genetic studies to characterize its natural population. In this respect, biotechnological tools such as the molecular markers, Simple Sequence Repeats (SSRs) are useful for identifying crop varieties, evolutionary studies, construction of genetic maps, and studies of genetic diversity and breeding [Citation11]. These SSR markers are codominant, multi-allelic, and highly heterozygous [Citation12] and therefore ideal for genetic diversity studies in S. macrophylla [Citation10,Citation13]. Currently, single-nucleotide polymorphisms (SNPs) technology is available for the genus Swietenia spp. [Citation14]. RAPDs were the first molecular markers used to investigate the genetic structure of natural mahogany tree populations from Panama, Guatemala, Costa Rica, Nicaragua, Honduras, and México. Later, specific SSRs have contributed enormously to develop strategic conservation plans [Citation3,Citation10,Citation13,Citation15,Citation16]. For Ecuatorian S. macrophylla, only in vitro propagation tools are used as a conservation strategy [Citation7]; no further information has been reported about genetic diversity patterns of mahogany populations. For this reason, this study aimed to determine the genetic diversity of S. macrophylla in tropical forest remnants and agro-ecosystems in Ecuador.
Materials and methods
Vegetative material
Leaves from 123 trees of S. macrophylla were collected in six provinces of Ecuador: Guayas (GY), Manabí (MN), Los Ríos (LR), El Oro (EO), Loja (LJ), and Napo (NP) (). The trees sampled were located on farms and natural populations and georeferenced with Global Positioning System (GPS). Tree selection was based on diameters at breast height (DBH) greater than 90 cm, and on the basis of their size, it was estimated these trees to be more than 15 years old. The leaves were taken from new shoots and stored in a cooler at 4°C during sampling and later frozen at −80°C in the Laboratorio de Biotecnología, of Instituto Nacional de Investigaciones Agropecuarias INIAP, Estación Experimental Santa Catalina.
Table 1. Location of the sites where S. macrophylla was sampled in Ecuador
DNA extraction and PCR amplification
DNA extraction followed the methodology described by Mariac et al. [Citation17] and [Citation18]. Dry tissue (10 mg) was grinded with liquid nitrogen, 50 mg of sodium metabisulfite, and 1 mL of extraction buffer CTAB 4% (cetyltrimethylammonium bromide), and incubated in a water bath for 2 h at 65°C and shaken every 30 min. Then, 700 μL of Chloroform: Isoamylic Alcohol (CIA; 24:1) was added, homogenized, and centrifuged for 5 min at 13,000 rpm. The supernatant was extracted, and 700 μL of CIA was added, and the centrifugation step was repeated, later 700 μL of isopropanol was added to the supernatant. Centrifugation was performed for 3 min at 10.000 rpm, and two DNA washes were performed with 250 μL of 70% ethanol; finally, the DNA was resuspended in TE. The markers used were sm01, sm31, sm32, sm34, sm40, sm45, sm46, sm47, sm51 developed for genetic analysis of Mahogany [Citation10]. The sm22 marker did not amplify; therefore, was excluded from this study. Polymerase Chain Reaction (PCR) was carried out with an initial denaturation step at 94°C for 2 min followed by 25 cycles of denaturation at 95°C for 1 min, annealing temperature at 72 °C for 2 min and extension at 72 °C for 10 min, and a final extension at 72 °C for 10 min. The mix for PCR was composed of 0.19 μL of ultrapure water, 1 μL of 10X PCR buffer, 2.5 mM MgCl2, 0.16 mM M13 700/800, 0.2 mM dNTPs, 0.01 mM SSR-M13/F primer, 0.16 mM SSR/R primer, 0.05 U/μL Taq polymerase and 2.0 ng/μL sample. PCR products were separated by capillary electrophoresis in an ABI 3130xl Prism Genetic Analyzer with POP-7 polymer (Life Technologies. Foster City. CA). The allele’s size for each SSR loci was estimated using the software Saga GT (LI-COR).
Statistical analysis
The genetic diversity index was estimated for each microsatellite loci and each sample. POPGENE v 1.31 [Citation19] and GenAlex v.6 [Citation20] were used to calculate the observed number of alleles (Na), observed heterozygosity (Ho), and the expected heterozygosity (He). The inbreeding coefficients for each locus were estimated by GenAlex v.6 according to a frequency-based methodology [Citation20,Citation21] and FSTAT v 2.9.3 [Citation22]. Deviation from the Hardy–Weinberg equilibrium (HWE) was determined with GenePop v 4.2 [Citation23]. The molecular analysis of variance (AMOVA) was applied to estimate the variance components of individuals among and within the sample’s sites using GenAlex v.6 [Citation20]. Cluster analysis was carried out through the Bayesian method implemented by STRUCTURE 2.3.3 software [Citation24]. Different population clusters (K = 1–10) were evaluated with 10 runs per K value for each analysis. The initial burn-in period was set to 100.000 with 1.000.000 MCMC iterations under the admixture model for each run. The ΔK measure obtained with STRUCTURE HARVESTER software [Citation25] was used to detect the best value of K. The probability of Identity (PI) was used to estimate the average probability that two independent individuals will have the same multilocus genotype [Citation26], where PI is the allele frequency by locus (PI = 2 (Σpi2)2 -Σ pi4). Additionally, the discrimination power (D) was estimated according to D = (1-PI) N(N−1)/2, where PI is the probability of identity, and N is the number of analyzed individuals (123). 1-PI is the exclusion power, and [N × (N-1)]/2 is the different pairs of individuals that can be produced in the sample [Citation27]. D allows calculating the percentage of two genetically different individuals. If D is superior to 95% will indicate those individuals are genetically different [Citation28,Citation29]. Also, the coefficient relatedness (r) among individuals was estimated according to [Citation30]. The PI, D, and r were estimated using the software GenAlex 6.5 [Citation31].
Results
Genetic diversity analysis
Nine polymorphic microsatellite markers were used to analyze 123 S. macrophylla samples. The locus sm01 had the highest number of alleles (Na = 10). In contrast, the loci sm31, sm32, sm34, sm46, sm47 showed the lowest values (Na = 6). The SSR loci sm40 and sm45, showed 7 alleles each, while the locus sm51, showed 8 alleles (). The range of observed heterozygosity for every SSR loci was from 0.08 (sm31) to 0.55 (sm51). Meanwhile, the expected heterozygosity ranged from 0.16 (sm31) to 0.84 (sm01). The average inbreeding coefficient (Fis) was 0.162 (se = 0.09), indicating a heterozygous deficit. However, the sm34 and sm 45 loci showed negative values indicating an excess of heterozygotes.
Table 2. Estimates of genetic diversity in 123 S. macrophylla based on nine SSR loci according to Ref. [Citation20]
The population’s genetic analysis showed that 62 alleles within 123 studied individuals. Manabí presented the highest alleles numbers with 5.8 alleles, followed by Guayas with 4.44, while Los Ríos and El Oro showed equal and low alleles numbers (Na = 1.33). The number of private alleles (exclusive to each province) was highest for the provinces of Manabí with five alleles, Guayas and Napo with four, while in Loja only one allele was present, and the provinces of Los Ríos and El Oro did not present any private alleles (). The observed heterozygosity (Ho) ranged from 0.24 in Manabí to 0.60 in Guayas. However, the lowest expected heterozygosity (He) value was found in Los Rios and El Oro provinces with 0.17 and the highest in the Guayas and Manabí where showed 0.64 and 0.63, respectively. The mean values of observed heterozygosity (Ho = 0.39) were less than the expected heterozygosity (He = 0.44) ().
Table 3. Descriptive statistics overall loci for each population according to Ref. [Citation20]
The average relatedness coefficient (r) among individuals was −0.010 (se = 0.004), and only 12.2% of pair combinations show r values superior to 0.125 (third degree of relatives). The probability of identity was low for increasing SSR locus combinations (PI = 4.3 × 10⁻⁹), indicating a chance of 1/4,300,000,000 to find two individuals with identical genotypes. Similarly, the discriminant power (D) among individuals was 99.99%.
Population structure
The analysis of molecular variance (AMOVA) showed that a high proportion of the genetic variation was distributed within (92%) than among (8%) populations ().
Table 4. Analyses of Molecular Variance (AMOVA) in six provinces of Ecuador, located on farm and natural populations of S. macrophylla.
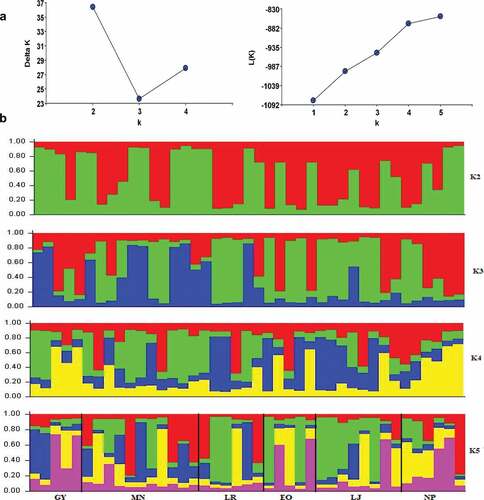
The Bayesian model-based clustering indicated the maximal ΔK for K = 2 (). The K = 3 and 5 gave complex admixtures that did not fit the criteria to be considered as a genetic group (). The two identified genetic groups clustered individually from all population collecting points except Napo province. Guayas, Manabí, and Loja showed a high admixture (Q values <0.8).
Figure 1. Genetic cluster identified by Bayesian analysis using Structure and Harvester software. (a) ∆K estimates of the posterior probability distribution of the data for a given K. Ln (K) obtained are a Structure analysis and an ad hoc quantity distribution. (b) Estimated population structure and the genetic clusters of the six provinces of Ecuador and 123 individuals of S. macrophylla. Guayas (GY), Manabí (MN), Los Ríos (LR), El Oro (EO), Loja (LJ) and Napo (NP).
Discussion
Forest degradation is one of the leading causes of reducing genetic diversity, so much so that the coastal forests of Ecuador are considered a priority area for their conservation [Citation32].
In the present research, nine specific SSR loci were used to study the genetic variability and structure of remnants of natural populations of S. macrophylla still present in Ecuador. The SSR loci showed a total of 62 alleles with an average of 6.8 alleles but a low number of alleles by population (Na = 3.02). This result corresponds to the most inferior allelic richness reported for mahogany in the American continent, indicating a severe low genetic variability in Ecuadorian populations. Lemes et al. [Citation10] analyzed 10 SSR loci were identified 158 alleles in 121 individuals, with 12–25 alleles per locus. Those authors reported the locus sm31 with the highest number of alleles, identifying 25 alleles. Lemes et al. [Citation9] reported 147 alleles in 194 individuals, with 13 to 27 alleles per locus. In the most extensive study published to date, Degen et al. [Citation33] report 145 alleles in 1971 individuals from nine countries in North America, Central America, and South America; unfortunately, that investigation did not include samples from Ecuador. At the population and loci level, the observed heterozygosity was inferior to expected heterozygosity, indicating a departure of Hardy–Weinberg equilibrium toward a heterozygous deficit. Only two loci showed an excess of heterozygous (sm32 and sm45) which can be explained by selection and genetic drift associated with human activities.
This level of heterozygosity was inferior to those published in Southwestern Amazon in tree S. macrophylla adults (Ho = 0.767 and He = 0.806) and juveniles (Ho = 0.763 and He = 0.831) [Citation34]. In Brazilian (Ho = 0.749 and He = 0.851), American populations (He = 0.61–0.85) and Mexican populations (Ho = 0.4 and He = 0.6) [Citation9,Citation33,Citation35]. The heterozygous deficit was a common trait for all those investigations, undoubtedly, the low heterozygosity highlights the fragility of this species, and the little variability becomes a factor that will affect the conservation of mahogany trees.
In the Ecuadorian tropics, S. macrophylla has a wide distribution, which is reflected in its higher genetic variability within populations (92%) and 8% between populations. The gene flow could explain the high intrapopulation genetic variability caused by the dispersal of seeds caused by man to establish new plantations of the species or by the movement of pollinating insects such as bees, butterflies, even thrips [Citation36,Citation37].
Furthermore, the current fragmentation generated by overexploitation may not be appreciated in genetic differences between populations; the results show that S. macrophylla still behaves as a continuous population and maintains the most genetic variability within the populations. Studies in Central American countries using RAPD techniques reported around 4% of genetic differentiation among populations [Citation3]. They suggest a strong gene movement of the species influenced by humans, who have been dispersing the species through its entire range of natural distribution. The intentional dispersion of the trees is due to the morphological characteristics that they have presented, these traits are very important to determine the genetic variability of this and other species, as in Brazil, where they evaluated the morphometric characteristics in fruits and mahogany seeds, with high potentials for their conservation and use [Citation38–40].
Other studies carried out at a regional scale using microsatellite markers revealed significant genetic variation within populations and a moderate to a high level of genetic differentiation between populations [Citation8–16].
On the other hand, tropical forest species that share similar habitats with S. macrophylla seem to present a different trend. For example, in Cedrela odorata, there have been higher levels of variation reported between populations (35%) [Citation3]. Private alleles’ presence is one factor that affects the genetic differentiation between populations [Citation41]. In this regard, out of the six Ecuadorian populations analyzed in this investigation, four of them showed private alleles, in Manabí (PA = 5.0), Guayas, and Napo (PA = 4.0), and Loja (PA = 1.0). Similarly [Citation8], found 0-4 privative alleles. However, the clustering-based in the Bayesian analysis showed only two genetic groups (k = 2), indicating a high similarity and admixtures between populations from six Ecuadorian mahogany tree populations. The outcrossing can explain the moderate genetics differentiation [Citation42,Citation43]. The low value of PI (4.3 × 10⁻⁹) for nine SSR locus combinations indicates no mahogany trees with identical multilocus genotypes.
Additionally, the discriminant power (D = 99.99%) was superior to the critical value (95%), indicating that the nine loci analyzed allowed 123 mahogany trees to be distinguished from each other. Most of the analyzed trees had a low relatedness coefficient (r); only a few of them showed a third-degree of relatives (with 12.5% shared loci). Similarly [Citation10], using 10 SSR loci, identified 121 mahogany with a combined probability of genetic identity of 7.0 × 10⁻¹⁵. Those results support that most of the genetic variability is distributed within populations of mahogany. The results reported in this study indicate the dramatic loss of genetic variation suffered by the natural mahogany population from Ecuador as a consequence of habitat disturbance and massive cutting down of the trees. Then, it is critical to develop a reforestation plan throughout the natural distribution of the Ecuadorian mahogany. These strategies should consider selecting trees from populations with the highest SSR variability (Guayas, Manabí, and Loja) to harvest seeds and produce seedlings to restore the natural population.
Conclusions
The study shows that genetic diversity is found in individuals from Guayas and Manabí. The individuals from Manabí and Loja are genetically similar despite the geographical distance, which can be attributed to an anthropic dispersion rather than a natural one. Individuals from the Napo are genetically different from the rest of the provinces. However, the genetic pattern that is starting to be distinguished in the Ecuadorian Litoral presents the need to establish strategies that allow recovering and increasing the genetic variability, and gives the possibility that S. macrophylla may again be a species that can be exploited in the short term.
Author contributions
RL and JPM led this investigation and analyzed the raw data as well administered the funds of this research; MP, BN, and RL performed all the sampling and fieldwork; JPM, EM, and BC contributed with the statistical and genetical analysis; EM, JB, and SM performed the laboratory work and sampling processes. All authors read and approved the final manuscript.
Acknowledgments
We would like to thank Petty Officer First Class (PO1) Mauricio Zambrano Pinoargote, Virginia Beach, USA; to Ezio Zambrano Limongi M.A. American Studies from the Universita degli studi di Torino, Italy and Mr David Trojniar for English proofreading the manuscript.
Disclosure statement
No potential conflict of interest was reported by the author(s).
Additional information
Funding
References
- Gentry A. A field guide to the families and genera of woody plants of northwest South America (Colombia, Ecuador, Peru), with supplementary notes on herbaceous taxa. University of Chicago Press; 1996. p. 920.
- Jiménez Q, Estrada A, Rodríguez A, Arroyo, P. Manual dendrológico de Costa Rica. 2nd 306 ed. 1999.
- Gillies ACM, Cornelius JP, Newton AC, et al. Genetic variation in costa Rican populations of the tropical timber species Cedrela odorata L., assessed using RAPDs. Mol Ecol. 1997;6(12):1133–1145.
- Gullison RE, Panfil S, Strouse J, et al. Ecology and management of mahogany (Swietenia macrophylla king) in the chimanes forest, beni, Bolivia. Bot J Linn Soc. 1996;122:9–34.
- Silva DC, Pastore TCM, Soares LF, et al. Determination of the country of origin of true mahogany (Swietenia macrophylla king) wood in five Latin American countries using handheld NIR devices and multivariate data analysis. Holzforschung. 2018;72(7):521–530.
- Rodan BD, Campbell FT. CITES and the sustainable management of Swietenia macrophylla king. Bot J Linn Soc. 1996;122(1):83–87.
- Carranza Patiño MS, Reyes Morán H, Mora Silva WF, et al. Propagación clonal in vitro de Swietenia macrophylla King (Caoba). Cienc y Tecnol. 2013;6(2):1–8.
- Novick RR, Dick CW, Lemes MR, et al. Genetic structure of Mesoamerican populations of big-leaf mahogany (Swietenia macrophylla) inferred from microsatellite analysis. Mol Ecol. 2003;12(11):2885–2893.
- Lemes MR, Gribel R, Proctor J, et al. Population genetic structure of mahogany (Swietenia macrophylla King, Meliaceae) across the Brazilian Amazon, based on variation at microsatellite loci: implications for conservation. Mol Ecol. 2003;12(11):2875–2883.
- Lemes MR, Brondani RPV, Grattapaglia D. Multiplexed systems of microsatellite markers for genetic analysis of mahogany, Swietenia macrophylla King (Meliaceae), a threatened neotropical timber species. J Hered. 2002;93(4):287–291.
- Alcalá RE, Salazar H, Gutiérrez-Granados G, et al. Genetic structure and genetic diversity of Swietenia macrophylla (Meliaceae): implications for sustainable forest management in Mexico. J Trop For Sci. 2014;26(1):142–152.
- Garcia-Gonzales R, Pico-Mendoza J, Quiroz K, et al. Development and characterization of microsatellite markers in gaultheria pumila Lf. (Ericaceae). Biol Res [Internet]. 2018;51(1):42.
- Lemes MR, Esashika T, Gaoue OG. Microsatellites for mahoganies: twelve new loci for Swietenia macrophylla and its high transferability to khaya senegalensis. Am J Bot. 2011;98(8):e207–e209.
- Pakull B, Schindler L, Mader M, et al. Development of nuclear SNP markers for mahogany (Swietenia spp.). Conserv Genet Resour [Internet]. 2020; (0123456789) 343:8–10.
- Céspedes M, Gutierrez MV, Holbrook NM, et al. Restoration of genetic diversity in the dry forest tree Swietenia macrophylla (Meliaceae) after pasture abandonment in Costa Rica. Mol Ecol. 2003;12(12):3201–3212.
- Lowe AJ, Jourde B, Breyne P, et al. Fine-scale genetic structure and gene flow within Costa Rican populations of mahogany (Swietenia macrophylla). Heredity (Edinb). 2003;90(3):268–275.
- Mariac C, Trouslot P, Poteaux C, et al. Chloroplast DNA extraction from herbaceous and woody plants for direct restriction fragment length polymorphism analysis. Biorechniques. 2000;28(1):110 3.
- Morillo Velasteguí E, Miño Castro G. Marcadores moleculares en biotecnología agrícola: manual de técnicas y procedimientos en INIAP. Quito: Instituto Nacional Autónomo de Investigaciones Agropecuarias, Estación Experimental Santa Catalina; 2011. p. 121.
- Yeh FC, Boyle T, Rongcai Y, et al. POPGENE, version 1.31. A Microsoft window based freeware for population genetic analysis. 1999;(August).
- Peakall R, Smouse PE. GENALEX 6: genetic analysis 364 in excel. Population genetic software for teaching and research. Mol Ecol Notes. 2006;6(1):288–295.
- Weir B, Cockerham C. Estimating F-Statistics for the analysis of population structure. Evolution (N Y). 1984;38(6):1358–1370.
- Goudet J. FSTAT (Version 1.2): a computer program to calculate F-statistics. J Hered. 1995;86(6):485–486.
- Raymond M, Rousset F. Genpop 1.2 population genetics software for exact test and ecumenicism. Comput notes. 1995;248–249.
- Pritchard JK, Stephens M, Donnelly P. Inference of population structure using multilocus genotype data. Genetics. 2000;155(2):945–959.
- Earl DA, vonHoldt BM. STRUCTURE HARVESTER: a website and program for visualizing STRUCTURE output and implementing the Evanno method. Conserv Genet Resour. 2012;4(2):359–361.
- Peakall R, Ebert D, Cunningham R, et al. Mark-recapture by genetic tagging reveals restricted movements by bush rats (Rattus fuscipes) in a fragmented landscape. J Zool. 2006;268(2):207–216.
- Wu B, Zhong GY, Yue JQ, et al. Identification of pummelo cultivars by using a panel of 25 selected SNPs and 12 DNA segments. PLoS One. 2014;9(4): 1–17.
- Tessier C, David J, This P, et al. Optimization of the choice of molecular markers for varietal identification in Vitis vinifera L. Theor Appl Genet. 1999;98(1):171–177.
- Guzmán FA, Moore S, de Vicente MC, et al. Microsatellites to enhance characterization, conservation and breeding value of capsicum germplasm. Genet Resour Crop Evol. 2020;67(3):569–585.
- Lynch M, Ritland K. Estimation of pairwise relatedness with molecular markers. Genetics. 1999;152(4):1753–1766.
- Peakall R, Smouse PE. GenALEx 6.5: genetic analysis in excel. Population genetic software for teaching and 385 research-an updates. Bioinformatics. 2012;28(19):2537–2539.
- Cuesta F, Peralvo M, Merino-Viteri A, et al. Priority areas for biodiversity conservation in mainland Ecuador. Neotrop Biodivers [Internet]. 2017;3(1):93–106.
- Degen B, Ward SE, Lemes MR, et al. Verifying the geographic origin of mahogany (Swietenia macrophylla King) with DNA-fingerprints. Forensic Sci Int Genet [Internet]. 2013;7(1):55–62.
- de Oliveira SS, Campos T, Sebbenn AM, et al. Using spatial genetic structure of a population of Swietenia macrophylla King to integrate genetic diversity into management strategies in Southwestern Amazon. For Ecol Manage [Internet]. 2020;464(February):118040.
- Trujillo-Sierra JE, Delgado-Valerio P, Ramírez-Morillo I, et al. Variación genética en poblaciones mexicanas de Swietenia macrophylla King, una especie tropical en expansión geográfica reciente. Bot Sci [Internet]. 2013;91(3):307–317.
- Leão NVM, Felipe SHS, Emídio-Silva C, et al. Morphometric diversity between fruits and seeds of mahogany trees (Swietenia macrophylla King.) from parakanã indigenous land, Pará State, Brazil. Aust J Crop Sci. 2018;12(3):435–443. 406
- Gillies ACM, Navarro C, Lowe AJ, et al. Genetic diversity in Mesoamerican populations of mahogany (Swietenia macrophylla), assessed using RAPDs. Heredity (Edinb). 1999;83(6):722–732.
- Basu A, Ghosh A, Pal S, et al. Pollination if the mahogany trees (Swietenia mahagoni) by an ovipositing thysanopteran insect (Priesneriola). Bionotes. 2013;15:88–89.
- Larekeng SH, Restu M, Arsyad MA. Observation of morphological and physiological characteristics on abangares mahogany (Swietenia macrophylla King.) in South Sulawesi. IOP Conf Ser Earth Environ Sci. 2019;270(1):012022. Mutia.
- Pramono AA, Syamsuwida D, Putri KP. Variation of seed sizes and its effect on germination and seedling growth of mahogany (Swietenia macrophylla). Biodiversitas. 2019;20(9):2576–2582.
- Szpiech ZA, Rosenberg NA. On the size distribution of private microsatellite alleles. Theor Popul Biol [Internet]. 2011;80(2):100–113.
- Lemes MR, Grattapaglia D, Grogan J, et al. Flexible mating system in a logged population of Swietenia macrophylla king (Meliaceae): implications for the management of a threatened neotropical tree species. Plant Ecol. 2007;192(2):169–179.
- Breed MF, Gardner MG, Ottewell KM, et al. Shifts in reproductive assurance strategies and inbreeding costs associated with habitat fragmentation in Central American mahogany. Ecol Lett. 2012;15(5):444–452.