
 ?Mathematical formulae have been encoded as MathML and are displayed in this HTML version using MathJax in order to improve their display. Uncheck the box to turn MathJax off. This feature requires Javascript. Click on a formula to zoom.
ABSTRACT
There is a need for robust methodological approaches to improve our capacity to automatically detect plant species from seed samples tohelp support plant management strategies. In this study, we tested different neural network techniques to automatically detect native species from seeds from the Andean páramo region based on optic RGB images. Specifically, we compared i) simple feed-forward networks (SNNs), consisting of feed-forward nets with error back-propagation, holding one hidden layer with different number of neurons; and ii) deep convolutional neural networks (CNNs), which have their convolutional layers-built form multiple 3x3 kernels. First, we sampled 50 seeds from four common plant species in the La Rusia Páramo (Colombia): Espeletia congestiflora, Bucquetia glutinosa, Calamagrostis effusa and Puya santosii. We took RGB images of individual seeds for each species on contrasted white and black backgrounds, and then classified all images under both SNNs and CNNs. Under a double cross-validation scheme, the SNN approach with 14 neurons approached 88% of test accuracy, while CNN achieved 93%. Moreover, when increasing the image sample in the training dataset fed to models, CNN performed with 100% accuracy when used on testing and validation datasets. Overall, the neural network approach explored here suggests a promising methodology for species prediction from seeds based on optical RGB images, with potential for automatic seed recognition and counting on the field.
Introduction
The Andean páramo, hereafter referred to as páramo, is a neotropical mountain region that encompasses the high-elevation ecosystems found above the montane treeline in the northern Andes of Peru, Ecuador, Colombia and Venezuela [Citation1]. The páramo harbours one of the richest mountain flora in the world, estimated at around 4,000 vascular plant species of which between 60% and 80% could be endemic [Citation1–3]. However, environmental threats related to human activities, i.e. agriculture, pasture, and climate change challenge the páramo’s ecological integrity and critically impact its unique flora, ecosystems and ecosystem services [Citation4–6]. For example, agriculture leads to the expansion of invasive plant species, whose competitive nature affects local species and their interactions [Citation7,Citation8]. Moreover, páramo plant species are highly vulnerable to climate change and drastic changes are expected for plant communities and ecosystems on the mid-term[Citation9].
There is a need to increase our knowledge on the páramo biology and ecology, as well as promote conservation practices in the region, in the form of both in-situ (e.g. protected areas) and ex-situ (e.g. seed banks) initiatives. Seed banks prove useful tools that offer protection for millions of plant species worldwide and help maintain their genetic information and viability for rehabilitation over long periods of time, sometimes centuries [Citation10,Citation11]. Selecting which species should be prioritary for ex-situ conservation constitutes a challenge, and most conservationists usually base their selection on either red-listed species, emblematic and endemic species, or management opportunities [Citation12]. However, we stress that in geographic areas where important knowledge gaps remain, such as the páramo, ex-situ initiatives should be established according to the species’ ecological contribution to its ecosystem(s), as well as their a-priori representativity in the soil seed pool. Consequently, a useful method to help conservationists quickly identify species within a specific seed pool is the use of optical, multi-spectral or hyper-spectral images taken from soil-cleaned seed samples. Such a method relies on the classification of images by a previously identified model, able to detect which species are present in the sample based on their visual attributes or their spectral signature. Promising applications of this approach include i) running the model to estimate the frequency of each species within a sample; and ii) transferring the model to different lab/field conditions. Hence, developing methods that allow automatic seed identification and counting through fast and non-destructive detection is receiving increasing attention from the scientific community today.
Revising the existing literature, different studies have explored the use of multi-spectral and hyper-spectral images (containing information on ultraviolet and near infrared wavelengths) for species prediction from seeds [Citation13–15]. Here, it is conjectured that the availability of hyper-spectral images allows using traditional and popular techniques such as PCA-SVM, but studies based only on optic (RGB) images could require more general and powerful statistical techniques for arriving at possibly satisfactory results. In this sense, focusing on optical images, a study on the prediction of seedling species was developed on 5,000 RGB images with 960 unique plants belonging to 12 species. The method for extracting the desired knowledge relied on Convolutional Neural Networks (CNNs), achieving a test accuracy of 99.48% [Citation16]. Because of the wide use and relative reduced costs of obtaining optic images, it is therefore a challenge to test if CNN algorithms are able to precisely detect native plant species from seeds, especially small seeds from tropical mountain environments such as the páramo.
The overarching goal of our study was to develop a proof-of-concept and evaluate the performance of neural network-based models in identifying plant species from páramo seeds by the means of optic RGB images. To do so, we selected four representative plant species of the La Rusia páramo (Colombia) with different seed shapes, sizes and appendices, as study cases: Bucquetia glutinosa (L.f.) DC., Calamagrostis effusa (Kunth) Steud., Espeletia congestiflora Cuatrec. and Puya santosii Cuatrec. Employing simple (linear) to more complex (non-linear) classifiers, we explored one hidden-layer feed forward neural networks, holding from 1 to 15 neurons, and Convolutional Neural Nets, holding a few convolutional layers made up of multiple 3×3 kernels to distinguish between the four species. If this optic-based approach is efficient, it will have promising applications for more complex seed segmentation and counting in mixed-seed images.
Study area and study species
Study area
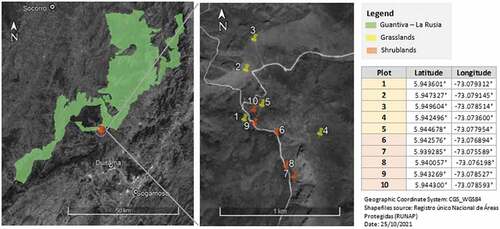
The La Rusia páramo belongs to the Guantiva-La Rusia mountain complex in the Colombian eastern cordillera (Lat. N 6.17; Long. W 73.01) (). It covers around 1,269 km2 and ranges from 3,100 to 4,280 m in elevation [Citation17,Citation18]. The La Rusia climate can be characterized as Temperate Oceanic climate (Cfb) according to the Köppen-Geiger classification, with a mean temperature of 10ºC and 1,000 mm of annual rainfall approximately (semi-humid páramo). Its climatic regime is bimodal, alternating two wet seasons in March–May and October–November, and two dry seasons [Citation19]. The páramo soils are mostly fertile Entisols and Inceptisols, developed on Mesozoic sedimentary rockbeds. The La Rusia páramo also harbours more than 10 different rivers and over 70 lakes, constituting one of the main sources for water supply to the surrounding rural areas and larger cities such as Duitama (Boyacá) [Citation17]. In terms of ecosystems, the páramo is dominated by grasslands and shrublands that often count with abundant giant stem rosette and basal rosette plant species [Citation20]. Other ecosystems, such as forest relicts, swamps and marshes and rocky habitats are also present in lesser extent [Citation6]. The La Rusia páramo hosts a rich flora of more than 300 plant species [Citation18,Citation20], including 21 species of giant stem rosette plants [Citation21]. Finally, most of the páramo is included in the 126,933 km2 the Guantiva-La Rusia Regional Integral Management District (IUCN Protected Area category VI) established in 2008 and under the joint authority of the Corporación Autónoma Regional de Santander and Corpoboyacá.
Figure 1. Location of the La Rusia páramo in the Colombian eastern cordillera, and precise geolocation of thevegetation plots, divided into grassland and shrubland plots, established for this study, .
Species of interest
We selected four plant species that are usually found in the lower páramo altitudinal range (~3,000–4,000 m) of the La Rusia páramo and are representative of the dominant grasslands and shrublands (). Bucquetia glutinosa is a Colombian endemic and a tall shrub-tree species (~2–3 m) often found at the montane treeline and in ecotonal shrublands with the páramo. It is usually referred to as Coloradito (i.e. Coloured) and locally planted in farms for fences and esthetic purposes due to its beautiful purple flowers and shedding lustrous bark [Citation22]. Calamagrostis effusa is a widely distributed species in the northern Andes and the dominant tussock grass species in most Colombian páramo grasslands [Citation23]. It is usually found in open vegetation and can prevail in páramo landscapes along with shrubs and understorey small plants. In terms of uses, Calamagrostis effusa is generically referred to as Paja (i.e. Tussock) and it is employed in rural areas to i) provide house isolation, and ii) as a palatable grass for livestock. Espeletia congestiflora is a Colombian endemic and one of the 21 giant stem rosettes species present in the La Rusia páramo, where, it is distributed in grasslands and at shrubland ecotones. Espeletia species receive the common name of Frailejon (i.e. Tall monk) and they are often used for several medicinal purposes, e.g. for treating rheumatic fever [Citation24], and for house and surface isolation, i.e. the hairy leaves help stopping moisture propagation. Puya santosii, is a giant basal rosette species that usually occurs in grasslands but can also be found near shrublands where many of its dispersers are found, i.e. mammals and birds. Puya plant species are often called Cardón (i.e. Thistle) because of their spiny leaves, and their cormus can be used for food and construction materials, given their strong monocarpous rachis and important fiber amounts [Citation25].
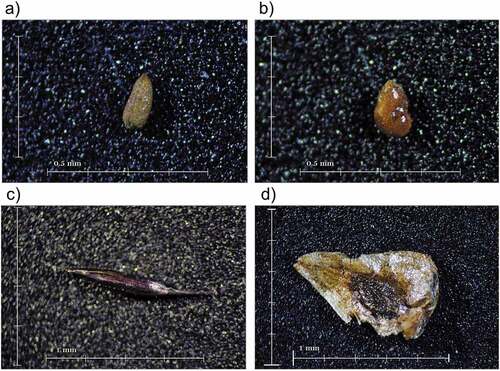
Figure 2. RGB pictures of the four species of interest (a) Espeletia congestiflora, (b) Bucquetia glutinosa, (c) Calamagrostis effusa and (d) Puya santosii on black background.
Methods
Fieldwork and seed processing
The seeds used in this study were obtained from fructiferous plant samples collected at the La Rusia páramo. The fieldwork took place in February 2019, as we established 10 temporal 25 m2 vegetation plots in grasslands (5) and shrubland (5) ecosystems based on physiognomy, i.e dominated by grasses or dominated by shrubs respectively . In each plot, we estimated total plant cover as well as species’ cover using the phytosociological scale. We collected plant material, in the form of reproductive branches for shrubs or entire individuals for grasses and small plants, for subsequent species taxonomic determinations. We also collected fructiferous samples of reproducing plants for seeds, including our species of interest. Finally, we extracted 1kg soil within the first 30cm deep at the center and corners of the plot for future imaging analyses on soil seed banks. All samples were preserved in labeled Ziploc bags and immediately transported to the Lab of Environmental Engineering at the University of the Andes where they were processed. Soils and plant macro-samples were dried and processed, while seeds were extracted from their fructiferous plant sample and separated into two groups: i) Sample A: a few seeds were kept in their fruit structure with their appendages apparent (e.g. pappus) so to deduce their dispersal mechanism, and ii) Sample B: the remaining seeds were extracted from their fruit, after careful removal of all layers down to the endocarp. The seeds from sample B were stored in small packages per species and dried at 60 ºC for 48 hours, and the ones corresponding to our four species of interest were separated for further analysis. Each of the four species had at least 50 seeds in Sample B.
Following this procedure, we characterized the seeds of our species of interest according to their anatomy and morphology, reporting the following information: length and width, weight, shape, texture and presence of appendages. We observed and measured 10 randomly selected seeds per species, a process that was repeated twice for size and weight followed by results averaging. Shape and type of epidermic structure were observed under the Zeiss Stemi 508 stereoscope, and characterized according to The Atlas Of Seeds Of Central And East-European Flora [Citation26] Seed size was measured under the binocular lens thanks to the micrometrical ocular ruler and accounting for the species-specific lens augmentation for optimal observation. Finally, seed weight was measured for 10 seeds at a time with a Ohaus Discovery analytical balance with a 10-microgram precision.
As a preliminary result of our study, we characterized the four species of interest according to their seed features (). Moreover, we classified them according to their main dispersal mode by combining the previously obtain characterization results and observations from Sample A. As a result, Calamagrostis effusa and Puya santosii were classified as wind-dispersed, with flying aid, Espeletia congestiflora was classified as wind-dispersed without flying aid, and Bucquetia glutinosa was classified as animal dispersed using endozoochory. We confirmed these findings with genus-level characterizations made by Frantzen & Bouman [Citation27] and Peyre et al. [Citation9].
Table 1. Characteristics of the four species of interest in terms of seed shape, length and width, weight, texture and the presence of appendages.
Image capturing and processing
For each species, we proceeded to capturing images of the seeds using the NIKON D-3000 optic camera mounted on the Zeiss Stemi 508 stereoscope and with a 35× lens augmentation. This camera is equipped with a charge-coupled device (CCD) sensor, allowing breaking the image elements into pixels, having a 10.2-megapixel resolution. Consequently, this camera should have no significant impact on the results with respect to any other optical cameras making use of a CCD sensor (even more, its image quality should be comparable to more expensive 10 megapixel cameras). Seeds were displayed first on i) a clean-white background to achieve higher contrast and therefore better collect their structural information, and second on ii) a black background to emulate natural soil conditions and complement the previous data (see for some examples of the images used in this study). The former background (i) sets the most favorable conditions, while the latter (ii) suggests a more realistic scenario for the classification task, resembling the conditions under which a seed can be expected to be found in páramo field conditions. For each species, we captured the image of 50 randomly selected seeds. For each seed, there is at least one image on a white background, and another image on a soil-black background. For some seeds, a third image was taken changing its angle (on its semi-opposite side) repeating the same background. In total, we obtained 150 images for each one of the species considered in this study: Bucquetia glutinosa, Calamagrostis effusa, Espeletia congestiflora, and Puya santosii.
Model building
Taking the four categories for the different species considered in this study, two different architectures for neural network models were examined, i) Single hidden layer feed forward Neural Nets (SNN), also known as universal approximators [Citation28]; and ii) Convolutional Neural Nets (CNNs), following the building philosophy of taking many small 3×3 filters in the convolutional layers [Citation29]. The code was all developed in the open-source programming language Python 3.0 and the Keras framework.
The statistical experiments for the development of the SNN and CNN followed a double cross-validation scheme, i.e. repeating multiple times the training, validation and test of the same network architectures with different partitions of the data [Citation30]. This procedure allowed addressing the difficulty of having a small amount of data for training complex models while controlling the risk of over-fitting and reducing the bias of our prediction error. As a result, the development of the network models followed two scenarios for the double cross-validation scheme. The first scenario randomly took 70% of the images for training and 15–15% for validation-test, while the second one took 80% for training and 10–10% for validation-test. All random partitions were repeated 10 times in a stratified fashion, i.e. maintaining the balance of the classes. The experiments for building the CNN models were extended by exploring the augmentation of the available images, applying common transformations such as image rotation and cropping (detailed below).
Single hidden-layer neural networks (SNN)
For the feed-forward and error retro-propagation architecture of the single-hidden layer network, the activation function of each neuron in the hidden layer was defined as a sigmoid function . Then, the feed forward linear combination was computed by
where W is a matrix of weights associated to the
neurons and the
features or rows of the matrix X. Hence, X has dimensions
, containing the m images, each one represented as a (flattended) column-vector with all the pixel values for its RGB decomposition, and b is the bias term.
The loss function corresponded with the categorical cross-entropy, defined for binary encoded labels and elements
of matrix A, as in
In our experiments, we tried from 1 to 15 neurons in the hidden layer. Parameters were randomly initialized once, under a Normal distribution with zero-mean and standard deviation of 0.05. The early-stopping technique was used under a double cross-validation scheme in order to identify the best epoch according to the error in validation, arriving at the minimum error by means of a gradient descent search with batches of size 64, under a fixed error rate of 0.01. Finally, the best model was selected according to the number of neurons and epochs that minimized the loss and exhibits the maximum accuracy on validation, according to
where TP is the number of true positives, TN the true negatives, FN the false negatives and FP the false positives.
Convolutional Neural Nets (CNN)
CNN examine the information contained in the images according to the spatial correlations among neighboring pixels, through convolutional filters which extract attributes on low-level characteristics such as borders or contours [Citation31]. Such a deep-convolutional architecture allow automatically tuning the filters’ parameters, leading to a possibly greater performance for classification. Here the images were not transformed to column-vectors, as they were passed to the network under their three-dimensional RGB representation. The architecture for the CNN had a first hidden layer containing 32 units, each one equipped with a 3×3 filter for each of the RGB components. Then, the filters’ output activated neurons with the hyperbolic tangent function and the dimensionality of the neuron’s output was reduced by means of a max-pooling layer.
The configuration for the first layer was replicated for the second layer, and a third layer was added but this time containing 64 units and activating neurons by the scaled exponential linear unit (SELU) function, which helped controlling the vanishing gradient problem, setting its activation parameters to and
[Citation32]. Finally, the output of the third layer was flattened into a one-column vector, obtaining a vector that is then fed into a fully connected layer with 64 neurons, which are activated by a ReLU function. We also tried dropping out 20% of the 64 neurons in each epoch during training, aiming at improving the generalization of the net. The resulting output was finally passed to the last softmax layer consisting in four neurons with a sigmoid activation function. We continued to use the categorical cross entropy loss function, and the Adam algorithm [Citation33] was implemented for searching the optimal set of parameter estimators with random batches of size 64, with a learning rate of 0.001 and the
and
coefficients being set at 0.9 and 0.999, respectively, [Citation33].
The CNNs were built under a double cross-validation scheme. Apart from the CNNs that were built from the original data, we compared the performance of such a convolutional architecture on augmented data, as such an augmentation has shown potential for achieving good results in image classification tasks [Citation34,Citation35]. Five seeds were taken out for each class for testing the models, and on the images used for training, data augmentation was performed by rotating them on different degrees, in a range of 30 to 160 degrees, also shifting the width and height, and zooming in and out by a rate of 0.1. After the augmentation, we obtained 1,000 images for each of the species Espeletia congestiflora, Bucquetia glutinosa, Calamagrostis effusa and Puya santosii.
Model performance and validation
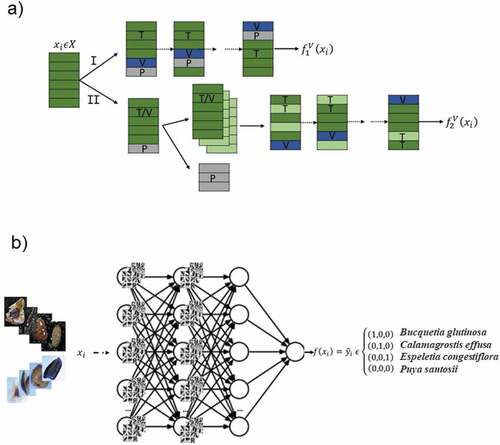
After implementing the double cross-validation simulations for the different neural network architectures, as described above (see path-I in ), the best models were identified for seed species prediction. Regarding the single-layer networks, the search for the optimal number of neurons in the hidden layer tried from 1 to 15 neurons, running the optimization algorithm for up to 200 epochs. Concerning CNNs, the search for identifying the best convolutional architecture used the Adam optimization algorithm, leaving it for up to 20 epochs. In addition, the best CNN architecture was trained and cross-validated on an augmented image data set (as shown in path-II of ). For all of them, the mean loss and the mean accuracy for the training, the validation and the test sets were measured, and the best models were chosen according to the minimum loss and maximum accuracy in validation. Once the parameters are estimated for the CNN, it is ready to be used for predicting new images of seeds coming from any of the four species considered in this study ().
Figure 3. Complete scheme for the construction and selection of models. The first path (I) shows the double cross-validation scheme, iteratively partitioning the data set into train (T), validation (V) and test (P) sets, identifying the best model on validation (). On the other hand, the second path (II) illustrates the separate identification of a training/validation (T/V) and an out-of-sample (P) set of images, the former being artificially augmented to train and cross-validate the CNN model (
), and the latter being used to test such a model.
Results and Discussion
The best results for the single hidden-layer network were obtained with 14 neurons, achieving 86% and 90% accuracy for validation and test, respectively, with a 70-15-15% random partition, while obtaining an 88% accuracy for both validation and test under the 80-10-10% partitioning of the data ). Moreover, the best result for the CNN achieved 93% accuracy in validation and test under the 70-15-15% random partition (). In terms of classification performance per species and according to both validation and testing datasets (), Calamagrostis effusa was the most correctly classified by the SNN and CNN techniques, at 93.8% and 96.9%, respectively. In contrast, Puya santosii was the most mis-classified, being correctly identified 90.5% and 86.3% of the time by the SNN and CNN techniques. Espeletia congestiflora was most often misclassified as Puya santosii (5.9% of the time), and Bucquetia glutinosa as Espeletia congestiflora (6.1% of the time) by both SNN and CNN. Calamagrostis effusa was not mismatched by CNN and evenly so by SNN. Finally, Puya santosii was most often misclassified as Calamagrostis effusa according to SNN (6.2% of the time) and as Espeletia grandiflora according to CNN (6.1% of the time).
Table 2. Results for the single hidden layer and the convolutional network architectures with the accuracy (Acc) scores for Validation (V) and Test (P).
Table 3. Confusion matrix for the best models: single hidden-layer (SNN) with 14 neurons (14-NN), the CNN (CNN) and the CNN with data augmentation (CNNa) in Validation and Test. Species of interest: E1 – Espeletia grandiflora, E2 – Bucquetia glutinosa, E3 – Calamagrostis effusa, E4 – Puya santosii.
Overall, the results revealed stable performances among the different partitions for train, validation and test sets. This is due to the fact that, following the double cross-validation scheme, the performance on both validation and test sets is consistent. Besides, the stability of the methodology is also backed up by the results of the single hidden-layer network, which achieved a maximal accuracy with 14 neurons for the different train-validation-test partitions used in this study. As mentioned above, together with these experiments on double cross validation, and after the promising results of the CNN network, another CNN was built after augmenting the image data base. Controlling the risk of over-fitting was achieved by training on a big sample and leaving out five seeds for each species for testing. The results for the first 10 learning epochs are shown in , and the respective learning-loss behavior of this CNN can be seen in . The validation-loss is minimized at 16 epochs, followed very closely by the result at 9 epochs as shown by the CNN results in the confusion matrix (). Hence, with these extra synthetic examples, the model was able to adequately generalize the different attributes of the four species, achieving perfect results.
Figure 4. The chosen CNN model, which makes use of the optimal-frozen parameters. FIGURE 5: Loss behavior on training (“o”) and validation (“*”*“*”) for the best (a) single-layer, (b) CNN and (c) the CNN with data augmentation.
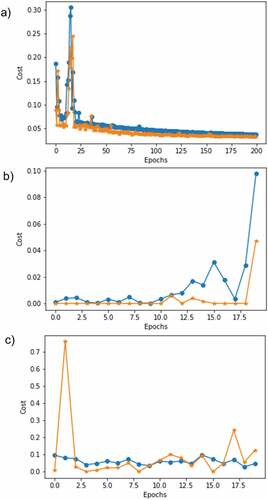
Table 4. Results for the CNN architecture after data augmentation, with the accuracy scores for Training (T), Validation (V) and Test (P) for up to 10 epochs.
The neural network approach presented in this study for seed species prediction achieved a high performance overall, suggesting a promising methodology based on optical RGB images. On the one hand, under a double cross-validation scheme, a 14-neuron SNN obtained a 88% test accuracy, while CNN achieved 93%. On the other hand, after exploring data augmentation techniques by rotation, CNN obtained 100% accuracy on validation and the small control-test set. The statistical experiments following a double cross-validation scheme allowed controlling the risk of over-fitting with a small data set, also reducing the bias estimation for the loss in prediction. The reported performance also demonstrated a stable behavior through the different train-validation-test partitions, where the single hidden-layer network achieved a maximal accuracy always consisted in holding 14 neurons. Moreover, the superior performance of CNN was confirmed after the data-augmented techniques, achieving a perfect ability to discriminate between the four species. This result suggests that image-augmentation in fact helps boosting the performance of the networks, regarding the estimation of its many free parameters, while learning the most relevant patterns from the training examples.
Overall, Calamagrostis effusa was the best classified species according to both SNN and CNN techniques, which can be due to its characteristic elongated shape. Even though the classification results proved very satisfactory overall, there was certain difficulty to discern i) Espeletia congestiflora, and Puya santosii, this possible due to their similar color ranges with overlapping tones; as well as ii) Espeletia congestiflora and Bucquetia glutinosa, seeming to have similar obovate shapes. Botanist experts are able to identify these species based on their visual attributes, and our results show that CNN can achieve a comparable performance when trained with augmented images. In consequence, the proposed methodology offers promising results for the automatic detection of native seeds species from the páramo ecosystem based on optic RGB images and neural networks. For future research, the models should be tested on seed with diverse traits and a wide range of species. Beyond seed-recognition in lab conditions, the practical purpose of these models consists in detecting seeds in field conditions, on soil and rock surfaces. Therefore, a next generation of models should be trained on field-images and be able to undergo the detection, segmentation and classification tasks for effective seed recognition despite light/shade and substrate variations. Upon success, the models could become crucial tools to estimate species’ population and automate actions for plant recollection, conservation and planting in the field.
Acknowledgements
The authors declare none
Disclosure statement
No potential conflict of interest was reported by the authors.
References
- Luteyn JL. Páramos: a checklist of plant diversity, geographical distribution, and botanical literature. New York: The New York Botanical Garden Press; 1999.
- Londono C, Cleef A, Madriñán S. Angiosperm flora and biogeography of the páramo region of Colombia, Northern Andes. Flora-Morphology, Distribution. Functional Ecology of Plants. 2014;09(2):81–87.
- Sklenar P, Hedberg I, Cleef AM. Island biogeography of tropical alpine floras. J of biogeogr. 2014;41(2):287–329.
- Buytaert W, Cuesta-Camacho F, Tobón C. Potential impacts of climate change on the environmental services of humid tropical alpine regions. Glob Ecology and Biogeogr. 2011;20(1):19–33.
- Hofstede R, Segarra P, Vásconez PM. Los páramos del mundo: Proyecto Atlas Mundial de los Páramos [The Paramos of the World: World Atlas of Paramos Project]. Quito, Ecuador: Quito: UICN Global Peatland Initiative, Ecociencia, 2003.
- Peyre G, Osorio D, Francois R, et al. Mapping the páramo land-cover in the northern Andes. Int J of Remote Sens. 2021;42(20):7777–7797.
- Llambí LD, Hupp N, Saez A, et al. Reciprocal interactions between a facilitator, natives, and exotics in tropical alpine plant communities. Perspect in Plant Ecology, Evolution and Systematics. 2018;30:82–88.
- Sarmiento L, LD L, Escalona A, et al. Vegetation patterns, regeneration rates and divergence in an old-field succession of the high tropical Andes. Plant Ecology. 2003;166(1):145–156.
- Peyre G, Lenoir J, Karger D, et al. The fate of páramo plant assemblages in the sky islands of the northern Andes. J of Vegetation Science. 2020;31(6):967–980. DOI:10.1111/jvs.12898
- Cochrane JA, Crawford AD, Monks LT. The significance of ex situ seed conservation to reintroduction of threatened plants. Australian J of Bot. 2007;55(3):356–361.
- Li DZ, Pritchard HW. The science and economics of ex situ plant conservation. Trends Plant Sci. 2009;14(11):614–621.
- Dalrymple SE, Abeli T. Ex situ seed banks and the IUCN Red List. Nat Plants. 2019;5(2):122–123.
- Yang X, Hong H, You Z, et al. Spectral and image integrated analysis of hyperspectral data for waxy corn seed variety classification. Sens. 2015;15(7):15578–15594.
- Zhang X, Liu F, He Y, et al. Application of hyperspectral imaging and chemometric calibrations for variety discrimination of maize seeds. Sens. 2012;12(12):17234–17246.
- Zhao Y, Zhang C, Zhu S, et al. Non-destructive and rapid variety discrimination and visualization of single grape seed using near-infrared hyperspectral imaging technique and multivariate analysis. Molecules. 2018;23(6):1352. DOI:10.3390/molecules23061352
- Ashqar B, Abu-Nasser B, Abu-Naser S. Plant seedlings classification using deep learning. Int J of Acad Inf Syst Res. 2019;3(1):7–14.
- Morales M, Otero J, Hammen TVD, et al. Atlas de páramos de Colombia [Atlas of paramos from Colombia]. Bogotá: Instituto de Investigación de Recursos Biológicos Alexander von Humboldt; 2007. Spanish.
- Olaya-Angarita JA, Diaz-Pérez CN, Morales-Puentes ME. Composition and structure of the forest-páramo transition in the Guantiva-La Rusia corridor (Colombia). Revista de Biología Tropical. 2019;67(4):755–768.
- Guzmán D, Ruiz JF, Cadena M. Regionalización de Colombia según la estacionalidad de la precipitación media mensual, a través análisis de componentes principales (ACP) [Regionalization of Colombia according to the seasonality of the monthly average precipitation, through principal component analysis (PCA)]. Spanish. Bogotá: Instituto de Hidrología, Meteorología y Estudios Ambientales; 2014.
- Valencia J, Lassaletta L, Velázquez E, et al. Factors controlling compositional changes in a Northern Andean Páramo (La Rusia, Colombia). Biotropica. 2013;45(1):18–26. DOI:10.1111/j.1744-7429.2012.00895.x
- Mavarez J. A Taxonomic Revision of Espeletia (Asteraceae). II. Updated List of Taxa, Nomenclature, and Conservation Status in the Colombian Radiation. Harvard Pap in Bot. 2021;26(1):131–157.
- Cárdenas-Burgos C, Araque-Barrera J, Bohorquez-Quintero M, et al. Propagación in vitro de Bucquetia glutinosa, especie endémica de los Paramos colombianos [In vitro propagation of Bucquetia glutinosa, endemic species of the Colombian Paramos]. Brasil: Scielo; 2019. Spanish.
- Peyre G, Balslev H, Font X. Phytoregionalisation of the Andean páramo. PeerJ. 2018;6:4786.
- Galvis Rueda M, Torres Torres M. Ethnobotanical and uses of the plants of the rural community of Sogamoso, Boyacá, Colombia. Revista de Investigación Agraria y Ambiental. 2017;8(2):187–206.
- Hornung-Leoni CT, Sosa V. Uses of the giant Bromeliad, Puya raimondii. J of the Bromeliad Soc. 2004;54:3–8.
- Bojnanský V, Fargasová A. Atlas of Seeds and Fruits of Central and East-European Flora: the Carpathian Mountains Region. Dordrecht: Springer; 2007.
- NMLHF F, Bouman F. Dispersal and growth form patterns of some zonal páramo vegetation types. Acta Botanica Neerlandica. 1989;38(4):449–465.
- Hornik K, Stinchcombe M, White H. Multilayer Feedforward networks are universal approximators. Neural Netw. 1989;2(5):359–366.
- Ciresan D, Masci J, Gambardella L, et al. Flexible, high performance convolutional neural network for image classification. Proceedings of the 22th International Joint Conference on Artificial Intelligence, IJCAI. 2011 Jul 16-22;2011(2):1237–1242. Barcelona, Spain. cAAAI Press.
- Filzmoser P, Libmann B, Varmuza K. Repeated double cross validation. Chemometrics. 2009;23(4):160–171.
- Goodfellow I, Bengio Y, Courville A. Deep learning. Cambridge (MA): MIT press; 2016.
- Klambauer G, Unterthiner T, Mayr A, et al. Self-Normalizing Neural Networks. Advances in Neural Information Processing Systems. 2017; 30:1–10. Curran Assoc, Inc.
- Kingma D, Ba J. Adam: a method for stochastic optimization. Published as a conference paper at the 3rd International Conference for Learning Representations; 2015 May 7-9; San Diego, CA. Cornell University. Online Available at arXiv:1412.6980.
- Wang J, Perez L. The effectiveness of data augmentation in image classification using deep learning. Cornell Univ. 2017; Online Available at: arXiv:1712.04621v1
- Wong S, Gatt A, Stamatescu V, et al. Understanding data augmentation for classification: when to warp? Proceedings of the International Conference on Digital Image Computing: Techniques and Applications (DICTA); 2016 Nov 30 Dec 2; Gold Coast, Australia. Gold Coast: IEEE Xplore; 2016. p. 1–6.