
 ?Mathematical formulae have been encoded as MathML and are displayed in this HTML version using MathJax in order to improve their display. Uncheck the box to turn MathJax off. This feature requires Javascript. Click on a formula to zoom.
ABSTRACT
Testing the critical chloride content (Ccrit) in laboratory samples or in samples retrieved from structures enhances the understanding of rebar corrosion initiation in concrete and can result in a significant improvement of predicting the residual service life of ageing structures. A possible drawback of test methods for Ccrit is that they can be time-consuming. In this work, different accelerated methods for Ccrit testing are studied and compared. It is found that the acceleration method influences the test results. The results are discussed with respect to evaluation of existing structures and service life modelling.
1. Introduction
Chloride-induced corrosion of reinforcement in concrete is known to be the most frequent deterioration mechanism for infrastructure objects (British Cement Association, Citation1997; fib – task group 5.8, Citation2011) and causes therefore high costs (Koch, Citation2017, Citation2002; Yilmaz & Angst, Citation2020). Typically, condition assessment of existing engineering structures includes measuring chloride profiles and comparing the results with the so-called critical chloride content Ccrit, which is given in standards and textbooks (fib, Citation2006; SIA, Citation2011). More refined approaches to estimate the residual service life include chloride transport modelling (e.g., (fib, Citation2006; Tang et al., Citation2012)) to predict the chloride content in the future until the threshold Ccrit is reached. The general concept is that initiation of corrosion is assumed to be likely once the chloride content at level of reinforcement is higher than Ccrit. Therefore, knowledge of the Ccrit is crucial.
Due to the large scatter of measured Ccrit in laboratory specimens and field exposure tests (Angst et al., Citation2009a) conservative values of Ccrit are generally assumed. It is commonly accepted that Ccrit depends on many different parameters, mainly properties of the steel-concrete interface, including steel microstructure, steel surface conditions, concrete mix proportions, and concrete moisture (Angst et al., Citation2019, Citation2017b). The variability of Ccrit has formerly been addressed by, e.g., (Alonso & Sanchez, Citation2009; Angst & Elsener, Citation2017; Arup, Citation1993; Nilsson et al., Citation1997). Despite the literature variability and the acknowledged effect of many parameters, it is often assumed that Ccrit is a value applicable to structures independently of their properties. Examples are the fib model code for service life design (fib, Citation2006) or the Swiss standard SIA 269/2 (SIA, Citation2011), where Ccrit is described as a statistical distribution or a constant threshold value, respectively, independently of the concrete and steel properties. Some sources allow for adjustments, such as to consider changing moisture conditions of the concrete (SIA, Citation2011).
Methods to determine the Ccrit for a specific structure (or part of it) are therefore highly required, as condition assessment and maintenance planning can reliably only be based on site-specific data. A wide range of different test methods for Ccrit have been proposed over the last decades (for reviews, the reader is referred to (Angst et al., Citation2009a; Cao et al., Citation2019; Tang et al., Citation2018)), but still no general agreement on a method could be reached. Most test methods generally used are based on samples manufactured in the laboratory. While these methods allow determining Ccrit under controlled conditions, the applicability of the results to engineering practice may be questionable, because lab-made samples are not representative the conditions at the steel-concrete interface found in engineering structures (Angst et al., Citation2017b).
A test method utilising samples retrieved from structures has been developed at ETH Zurich (Angst et al., Citation2017a). This allows civil engineers working on condition assessment of a structure to determine the structure-dependent Ccrit and utilise the data for estimations of the residual service life. A compilation of data obtained with this method so far can be found in Refs. (Boschmann Käthler et al., Citation2019a, Citation2019b). Depending on the concrete properties of the structure, this method for determining Ccrit can be time-consuming (up to 1–2 years), as the chloride ingress is primarily diffusion-controlled. Acceleration of the chloride ingress is thus a general challenge in test results. The objective generally is to avoid long test times, while not affecting the mechanism of natural corrosion initiation, nor the Ccrit. Several techniques to accelerate chloride ingress are possible, including application of an electrical field and wetting/drying cycles (Andrade & Rebolledo, Citation2012; Bertolini et al., Citation2013; Castellote et al., Citation2002; Polder et al., Citation2017; Poulsen & Sørensen, Citation2019; Yang et al., Citation2017). Wetting/drying cycles might be more close to realistic exposure than the application of an electrical field. In contrast, the application of an electrical field might be faster and less tedious than wetting/drying cycles. Currently, there is little documentation in the literature with respect to the effect of different chloride ingress acceleration techniques on the obtained Ccrit.
This paper presents and compares results from laboratory investigations of a series of different experimental approaches utilising accelerated chloride ingress for determination of Ccrit. The presented work was carried out at laboratories at ETH in Switzerland and DTI in Denmark.
2. Material and methods
2.1. Experiments at ETH
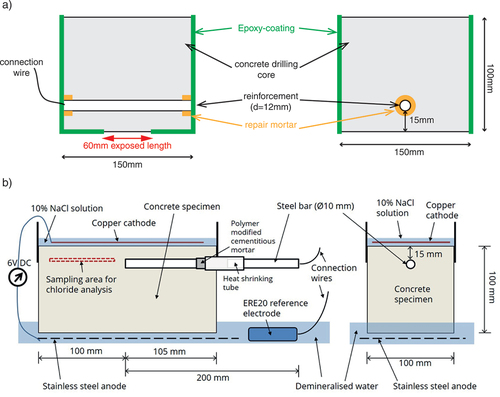
Specimens containing a centrally located, ribbed-reinforcing steel (, rebar in as-received conditions) were cast with the mix proportions given in . During casting, the rebar was in horizontal position. Curing took 28 d in a climatic chamber (RH: 95%, T: 20°C). A cable connection to the reinforcement was established and the steel bar ends were protected with a cement mortar layer and Epoxy-coating (details described in (Angst et al., Citation2017a)). The exposed rebar length was 60 mm. Additionally, all lateral faces were Epoxy-coated to avoid chloride ingress from the end parts of the rebars.
Table 1. Mix proportions.
Figure 1. Schematic illustrations of the specimen designs used at ETH (a) and DTI (b).
The steel potential was continuously measured against an external Ag/AgClsat-reference electrode placed in the exposure solution to record initiation of corrosion. The specimens were tested with the following four exposure conditions ()):
Figure 2. Different exposure methods tested: a) diffusion D b) wetting/drying WD, c) migration 1 M1, d) migration 2 M2, and e) migration M3 and M4. gives an overview of the tested methods for chloride ingress.
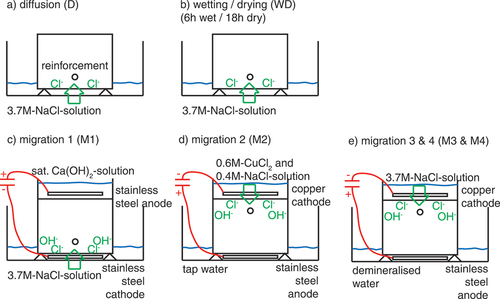
Table 2. Summary of applied techniques for chloride ingress.
The first method for chloride ingress is the reference method for this investigation, named diffusion D, () and it is similar to the ETH test method for Ccrit (Angst et al., Citation2017a). The exposure side of the specimens were continuously placed in a 3.7 M-NaCl-solution (10%-NaCl-solution according to (Angst et al., Citation2017a)). The chloride ingress was primarily by diffusion.
The second method consists of wetting/drying cycles () and is named WD. The exposure solution was the same as for method D (3.7 M-NaCl-solution) but included daily wetting/drying cycles (6 h wet, 18 h dry). The chloride ingress was mainly by capillary suction and diffusion. Every month, the exposed concrete surface was cleaned from possible scales by a steel brush.
For the third method, named M1 (), the chloride ingress was accelerated by the application of an electrical field. A stainless-steel cathode was placed below the specimen also in a 3.7 M-NaCl-solution and a stainless-steel anode on top of the specimen in a pond containing saturated Ca(OH)2-solution. A constant current density with respect to the exposed concrete surface was applied between the two stainless-steel electrodes. The current density was stepwise increased, starting from 0.05 to 0.52 A/m2 (, the needed DC voltage was maximum 6 V). Once per day, the current was switched off for 3 h to measure the rebar potentials in the absence of the electrical field. In this method M1, the chloride ingress was primarily by migration.
Figure 3. Current densities used for M1 and M2.
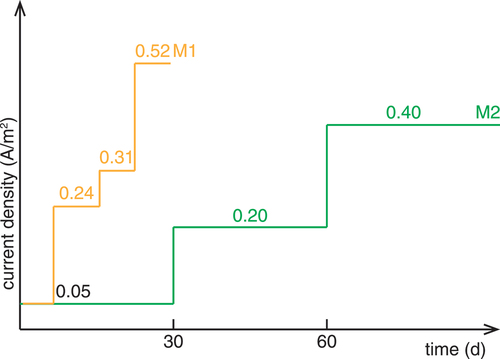
The fourth method, named M2 (), was suggested by Polder et al. (Polder et al., Citation2017), where the specimens were turned upside down and the chloride ingress took place from the top. There, the copper cathode was placed in a 0.6 M-CuCl2 and 0.4 M-NaCl-solution. The stainless-steel anode was placed below the specimen in tap water. A constant current density of increasing values from 0.05 to 0.4 A/m2 (, the needed DC voltage was maximum 6 V) was applied. Once a day, the current was switched off for 3 h to measure the potentials. In this method M2, the chloride ingress was primarily by migration.
2.2. Experiments at DTI
The experimental work carried out at DTI was based on a slightly modified version of the method for determination of Ccrit suggested by (Polder et al., Citation2017). For the experiments, a total of six concrete specimens (205 100
100 mm3), each with a single bar of reinforcing steel (Ø10 mm S235JR – EN 10,025) without ribs, were produced using the concrete mix design given in . Three of the specimens were produced with a concrete cover of 10 mm above the steel bar (specimens labelled as ‘2_10 mm’, ‘3_10 mm’, and ‘5_10 mm’) and the remaining three specimens were produced with a concrete cover of 15 mm (specimens labelled as ‘6_15 mm’, ‘7_15 mm’, and ‘8_15 mm’). The design of the specimens is shown in . The casting was performed with the steel bar in vertical position.
Before casting of the specimens, all steel bars were chemically cleaned by immersion in a chemical cleaner solution (HCl:H2O = 1:1 + 3 g/L urotropine) for 5 minutes and subsequent treatment in an ultrasonic water bath for 3 minutes.
To ensure one-sided chloride ingress an epoxy coating was applied to all sides of the specimens except the top and bottom surfaces prior to testing. Also, a rubber sheet was applied around the top surface to form a pond on each specimen.
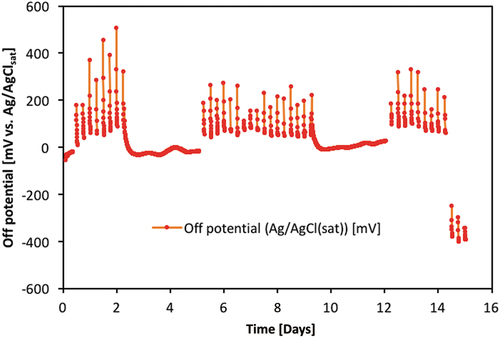
Four of the specimens were tested using a method (M3), where the chloride ingress was accelerated by applying a low DC voltage (6 V) across the specimen. This was obtained with a copper cathode in a pond of 10% NaCl solution on top of the specimen and a stainless-steel anode placed in demineralised water on the opposite of the specimen (). A reference electrode (ERE20 electrode based on Mn/MnO2) was placed in the demineralised water to monitor the potential of the steel bar in the concrete specimen. At regular intervals (four times a day) the DC voltage was switched off for 1 h to observe the ‘off’ potential of the steel. The steel potential was continually monitored, i.e., both when the DC voltage was turned on and off. Also, the DC voltage was switched off manually for all weekends and holiday to avoid a situation, where a specimen could not be removed from the experimental setup immediately after initiation of corrosion. An example for the measured steel potentials for one of the tested specimens is shown in .
Figure 4. Example of measured steel potentials vs. time in experiments at DTI with method M3. Only ‘off’ potentials are shown in the figure, i.e. potentials measured during the periods with applied DC voltage (6 V) has been filtered out. The potential drop observed after about 14 days indicates the onset of corrosion in this particular specimen (‘7_15 mm’). The potentials are measured with an Mn/MnO2 reference electrode but corrected to mV vs. Ag/AgClsat by addition of 222 mV.
For the remaining two of the six DTI specimens a slightly modified version of M3 was used, here labelled as method M4. The only difference between M3 and M4 is that in M4 the periods with DC voltage were terminated shortly before initiation of corrosion was expected to occur and subsequently subjected to continued chloride exposure with the DC voltage in ‘off’ mode until initiation of corrosion was detected. In this way, the chloride ingress would be due to a slower diffusion process rather than fast migration in the last period before initiation of corrosion. For comparison of method M3 and M4, and give an overview of the performed experiments in terms of the duration of the periods, where the applied DC voltage was only interrupted at regular intervals (1 h four times a day), and the periods where the DC voltage was switched off manually. The motivation for applying the M4 procedure was to (a) investigate the influence on the measured Ccrit of using migration vs. diffusion as the final transport mechanism before initiation of corrosion and (b) to avoid a situation where the measured Ccrit would become too high due to unwanted fast chloride ingress after initiation of corrosion in case the specimen is not removed from the test setup immediately after detection of corrosion initiation.
Figure 5. Schematic illustration showing the duration of periods, where the DC voltage (6 V) was only switched off at regular intervals (four times a day) for 1 hour to observe the ‘off’ potential of the steel (continuous, red lines), and periods where the DC voltage was switched off manually (dotted, blue lines). This is shown for both method M3 (a) and M4 (b). A summary of the total time for each DTI specimen, where the DC voltage was turned on and off during the experiments is given in . For interpretation of the references to color in this figure legend, the reader is referred to the web version of this article.
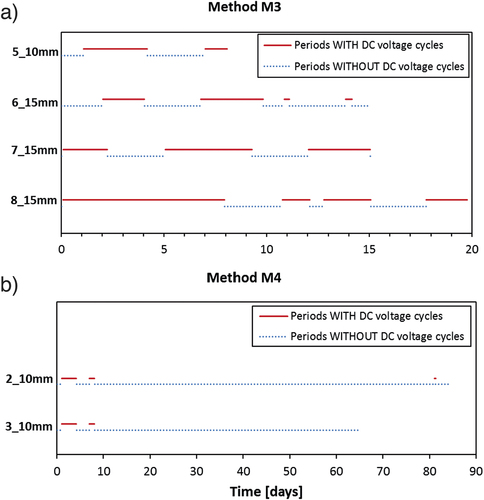
Table 3. Overview of total time with and without applied DC voltage in the experiments with method M3 and M4.
2.3. Detection of corrosion initiation
For the ETH specimens, initiation of corrosion was detected when the steel potential dropped by at least 150 mV. Note that for series M1 and M2 the potential was measured during the 3 hours during which the electrical field was interrupted. This was done in order to avoid a disturbing effect of the electrical field on the measured potential. Once initiation of corrosion occurred, the specimens were split by cutting close to reinforcement from the rear part and using a chisel in the so formed crevice. This is more explicitly described in (Angst et al., Citation2017a). Subsequently, the Ccrit at the level of reinforcement (total chloride content according to (SIA, Citation2007)) was measured.
For all the DTI specimens, either a drop of >200 mV between two consecutive periods of ‘off’ potential measurements in periods with the DC voltage turned on or a drop of >200 mV in periods with the DC voltage turned off was interpreted as an indication of corrosion initiation. After registration of corrosion initiation, the specimen was removed from the test setup as soon as possible. Subsequently, Ccrit was determined by measuring the chloride concentration around the depth of the steel bar by means of profile grinding, i.e., material was grinded off in 0.5 mm thick layers parallel to the chloride-exposed surface at depths going from 1.5 mm above the steel bar to 1.5 mm below the steel bar. The chloride content in each layer was determined according to the procedure given in DS 423.28, which is similar to NT Build 208 (NT Build 208, Citation1996). However, potentiometric titration, rather than the specified Volhard titration, was used to measure the chloride contents. Finally, Ccrit was determined by linear interpolation between the two points in the resulting chloride profile being closest to the outmost surface of the steel bar. Furthermore, the position of the corrosion pit was examined by visual inspection of the steel bar after removing it from the split sample.
3. Results
3.1. Acceleration factor
and show the observed time to corrosion initiation for the different testing conditions. details all the individual values for the different samples as well as the mean value and the standard deviation for both the time to corrosion initiation as well as Ccrit. displays the results as cumulative probability curves. Note the pronounced difference in mean values and standard deviation between the method based on diffusion (D) and the different accelerated procedures. Concerning the samples produced at ETH, on average, the methods WD, M1, and M2, were between 3 and 6 times faster than the bulk diffusion method (D). Another observation is that the scatter of the time to corrosion initiation is also strongly reduced in the accelerated test methods compared to the bulk diffusion test.
Figure 6. Time to corrosion initiation for the different testing conditions (note that for reasons of comparison, only samples with equal cover depth (15 mm) are shown here). For interpretation of the references to color in this figure legend, the reader is referred to the web version of this article.
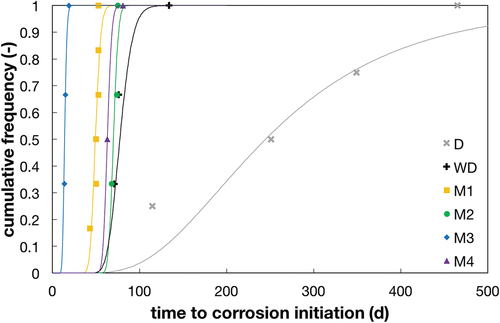
Table 4. Time to corrosion initiation and Ccrit for different accelerating methods. (µ = mean value, = standard deviation).
The time to corrosion initiation for method M3 (DTI) is more than 4 times faster than the almost similar method M2 (ETH), which might be explained by a) the lower chloride concentration in the exposure reservoir for M2 than for M3, and b) the DC voltage applied in method M2 being lower than the 6 V used in method M3. For identical samples produced at DTI with 10 mm cover, method M3 was approximately 9 times faster than method M4.
3.2. Influence on Ccrit
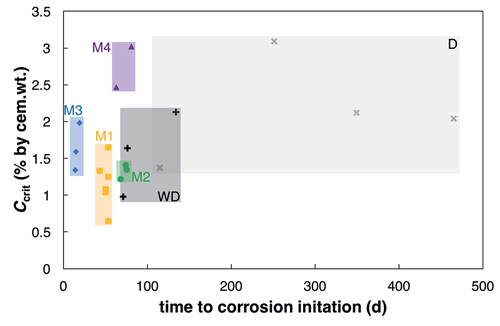
As and show, the Ccrit-values obtained from the migration tests (M1, M2, and M3) and from the wetting/drying test (WD) were generally lower than Ccrit obtained from the bulk diffusion test (D). However, the Ccrit-values obtained with the combined migration/diffusion test M4 were comparable to the highest values from the bulk diffusion test (D). The standard deviation of Ccrit was generally smaller for the accelerated specimens than for the bulk diffusion exposure (). This is explained by the much shorter and more similar time to corrosion initiation for the accelerated specimens. shows the relationship between observed Ccrit and the needed time to corrosion initiation for each method. It can be seen that the diffusion method leads to high scatter in Ccrit and time to corrosion initiation, whereas the scatter of the migration-controlled methods (M1-M4) is much lower.
Figure 7. Box Plots of the Ccrit values for the different methods. The horizontal lines of the boxes represent the 25%, 50%, and 75%-quantiles. The whiskers are the extreme values. Number of specimens per series is D: 4, WD:3, M1: 6, M2: 3, M3: 4 (both cover layers were combined), and M4: 2 (according to ).
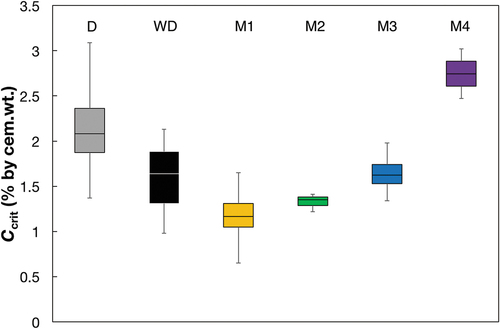
Figure 8. Ccrit vs. time to corrosion initiation, distinguished by acceleration techniques. (note that for reasons of comparison, only samples with equal cover depth (15 mm) are shown here).
4. Discussion
4.1. Influence of acceleration method on corrosion initiation mechanism
Long immersion times can lead to oxygen depletion at the steel surface in concrete (associated with a more negative steel potential) and are claimed therefore to prevent or delay initiation of corrosion (Bertolini et al., Citation2013). Comparing the steel potentials before initiation of corrosion (), no lower potentials were found for the method D, even after continuous immersion times of up to 1.5 y. These potentials indicate that a comparable amount of oxygen was present at the steel surface in all series. Thus, no related modification of the conditions for initiation of corrosion was expected on this basis. The fact that oxygen concentrations were similar in all series is not surprising as there was no relevant oxygen consumer in the system (the steel was passive) and because under such conditions, it takes much longer time to remove the oxygen captured in the porous system ((Angst et al., Citation2017b) and refs. cited in this publication).
Figure 9. Box plots of potentials before (a) and after (b) initiation of corrosion. The horizontal lines of the boxes represent the 25%, 50%, and 75%-quantiles. The whiskers are the extreme values. Number of specimens per series is D: 4, WD:3, M1: 6, M2: 3, M3: 4 (both cover layers were combined), and M4: 2 (according to ).
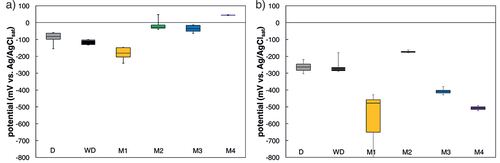
The steel potentials measured after initiation of corrosion () are similar at a level around −200 mV to −300 mV vs. Ag/AgClsat for the method D, WD, and M2. Steel potentials for method M3 and M4, respectively, were around −400 mV and −500 mV vs. Ag/AgClsat. Samples where chloride ingress was accelerated with method M1 (chloride ingress by migration from the bottom of the sample) had initially very low potentials around −600 mV to −700 mV vs. Ag/AgClsat (). In contrast to the other electrical field accelerated methods, the steel potential in method M1 drops to very low values and later recovers to values similar to method M3 and method M4 (). This behaviour may be explained by the introduction of diffusion potentials and their disturbing effect on potential measurements (Angst et al., Citation2009b). Diffusion potentials arise in the presence of concentration gradients, in particular, pH gradients, which are expected to occur in setups using migration, due to the anodic and cathodic reactions occurring at the electrodes used to apply the migration current. After switching off, the current, concentration gradients will relax over time, which may have led to the potential-time behaviour mentioned above and shown in .
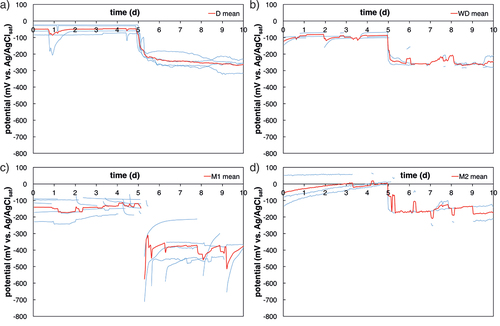
Figure 10. Potential vs. time, 5 days before and 5 days after initiation of corrosion (potential drop > 150 mV). a) is method D, b) method WD, c) method M1, and d) method M2. The red line depicts the mean value, the thin blue lines depict each sample. For interpretation of the references to color in this figure legend, the reader is referred to the web version of this article.
Different acceleration techniques may influence the ratio between free and bound chlorides. The free chlorides are recognised to lead to depassivation the reinforcement, whereas the bound chlorides will act as a reservoir for sustaining stable pit growth and later corrosion processes (Glass & Buenfeld, Citation1997; Glass et al., Citation2000). When chlorides migrate into the specimens by an electrical field the amount of bound chlorides at the relatively fast-moving migration front is expected to be significantly less than for chloride ingress by diffusion. This is because the comparatively slow diffusion process allows for more time for chloride binding to occur. The kinetics of chloride binding under the effect of interrupted electrical fields was documented, e.g., in (Elsener & Angst, Citation2007). Further observations on the effect of electrical fields on chloride binding can be found in (Chu et al., Citation2019). The resulting difference in ratio of free and bound chlorides between the different methods may explain the lower Ccrit-values obtained from the extensive migration tests (M1, M2, and M3) compared to the tests with more time for diffusion (D and M4) (as shown in ).
Different acceleration techniques may influence the chemical composition of the pore solution in the concrete, especially pH, and thereby affect initiation of corrosion. Due to the applied electrical field all negatively charged ions migrate towards the anode. Therefore, also the hydroxide ions migrate, which could lead to an alteration of the OH–concentration. For this reason, the method M2 with the copper cathode was developed in (Polder et al., Citation2017). The cathodic reaction does not produce hydroxide ions (although the removal of hydrolysed Cu2+ ions from the electrolyte may increase the pH), whereas the method M1 produces hydroxide ions at the cathode. This would lead to an increase of pH. Nevertheless, for both methods, the ionic current will partially be transported by the hydroxide ions that are readily and in large quantity available within the cementitious media. Many studies (Glass & Buenfeld, Citation1997; Kayyali & Haque, Citation1995; Page et al., Citation1992) showed that a lower OH–concentration leads to a lower Ccrit. A small decrease of the pH due to the migration of the hydroxide ions could also contribute to decreasing Ccrit for specimens accelerated by an electrical field.
For the wetting/drying method, the lower Ccrit could possibly be explained by the longer exposure to air. As discussed in (Angst et al., Citation2019), wetting and cycles tend to lead to lower Ccrit than continuous submersion (Sandberg & Pettersson, Citation1997; Sandberg & Sørensen, Citation1999).
The large standard deviation for Ccrit of the method D () could be explained by the large scatter of time to corrosion initiation, which is depicted also in .
4.2. Considerations for practical application for determination of Ccrit
From the obtained results, it is apparent that the variability in Ccrit decreases when the test method employs stronger acceleration (). The low scatter in the accelerated methods WD, M1, M2, M3, and M4, as compared to the diffusion method D, may be considered as a desirable property of a laboratory test. However, this low variability in strongly accelerated testing may not be representative for site conditions. For example, Ccrit tested on structures by Vassie (Vassie, Citation1984) (Ccrit: 0.25–1.5% by cem.wt.), revealed much higher scatter than the laboratory experiments from Breit (Breit, Citation2001) (smooth rebars, potentiostatically controlled, Ccrit: 0.25–0.75% by cem.wt.). Other studies analysing the differences between laboratory and field testing led to similar conclusions (Angst, Citation2019; Angst & Elsener, Citation2017; Angst et al., Citation2016; Boschmann Käthler et al., Citation2019b). Note that the diffusion method D itself may be viewed as an accelerated method, as it employs a high chloride exposure concentration. The ‘true’ Ccrit in field exposure might therefore also differ from the Ccrit obtained with the diffusion method D.
It is interesting that Ccrit measured on anode ladders in field exposed submerged samples showed values similar to those obtained by the fast M3 method and the relatively fast WD method (Sørensen et al., Citation2016). For this experiments, the same binder as in M3 and M4 is used, but with ribbed steel in ‘as received’ condition. The Ccrit did not reach the high levels obtained by the more diffusion-related methods D and M4. Furthermore, the exposure conditions relevant for chloride-induced corrosion on-site are often more cyclic than constant conditions, e.g., tidal zone or splash zone conditions (marine structures, road salt exposure). However, continuously wet exposure conditions can be relevant for the submerged part of marine structures. One could thus argue that in order to deliver practice-related Ccrit-values, test method WD is expected to deliver results applicable for cyclic conditions (road salt exposure, marine splash/tidal zone), while the pure diffusion test D delivers results applicable for continuously wet exposure (marine structures). The values of the D series should in this case be considered too optimistic for cyclic exposure conditions, namely overestimating the Ccrit.
In summary, methods M3 and WD are expected to yield the most practice-related test results for road salt exposure, marine splash/tidal zone. At the same time, these two methods are comparatively fast and the required test times (a few weeks to max. 100 days) may be acceptable for a laboratory test method. Nevertheless, both tests are more complex (migration setup for M3) or laborious (wetting drying cycles for WD) than a bulk diffusion test (D). For continuously wet conditions (marine immersed exposure), test method D is expected to yield the most practice-related test results.
A fact which has to be considered for ‘old’ samples from structures: the here tested specimens consisted of young concrete (4 weeks curing) showing high and homogeneous pH distribution over the cross-section. The transport of OH–ions therefore slowly changes the pH at the level of reinforcement. In contrast, the pH distribution in samples from structures is generally unknown. Depending on the level of the carbonation front, the pH may be lower and more heterogeneous over the cross-section than in laboratory made samples (Angst et al., Citation2019, Citation2017b). Further transport of the OH–ions is therefore unfavourable and should be avoided during Ccrit testing, as it might change the local pH at the reinforcement, leading to different conditions (lower OH–concentration) for initiation of corrosion.
In general, it is still an unanswered question how the results from laboratory tests of Ccrit can be applied to engineering practice. More observations from controlled field exposure could help to better understand the controlling factors for Ccrit in structures and serve as calibration data for a commonly accepted, fast and reliable accelerated laboratory standard test method, which still needs to be identified. Several of the laboratory methods presented here may be good candidates for further development into such a standard method.
5. Conclusions
This study compared different techniques to accelerate the chloride ingress into concrete specimens to reduce the time to corrosion initiation, and thus to reduce the testing time for a laboratory method to determine Ccrit. The following major conclusions are drawn:
Continuously wet exposure (diffusion method, D) may lead to much longer times to corrosion initiation (up to approx. 1.5 years) than wetting/drying cycles (method WD, max. 3 months) or migration-controlled chloride ingress (methods M1-M4, a few days or weeks).
Test methods that involve a diffusion component before initiation of corrosion (methods D and M4) were found to yield higher Ccrit values than methods based on wetting/drying or migration.
Methods M3 and WD are expected to yield the most practice-related test results for road salt exposure and marine splash/tidal zone exposure situations. For continuously wet conditions (marine immersed exposure), test method D is expected to yield the most practice-related test results.
The variability in obtained Ccrit values is relatively low for migration-based methods, and higher for the wetting/drying and bulk diffusion methods. Low variability may be preferred for laboratory to be used tests as fast ‘durability indicators’ (methods M2 and M3). For probabilistic service life modelling, however, the low variability may not be representative for site conditions, where the variability in Ccrit is known to be relatively large.
Acknowledgments
The authors want to express their sincere appreciation to the Federal Road Administration of Switzerland for the funding parts of this project. For their enthusiasm during the experimental work, the authors want to thank Nicole Felder and Benjamin Weber.
Furthermore, the experimental work at DTI was carried out with much appreciated financial support from the Danish Agency for Institutions and Educational Grants.
Disclosure statement
No potential conflict of interest was reported by the authors.
Additional information
Funding
Notes on contributors
Carolina Boschmann Käthler
Carolina Boschmann Käthler obtained her MSc in civil engineering and PhD at the ETH Zurich (Switzerland). The PhD project comprises different aspects of chloride-induced reinforcement corrosion, including initiation mechanisms, testing methods, and application to engineering structures. Her research interests are mainly the effect of cracks on reinforcement corrosion, the chloride-induced corrosion initiation, and the influence on service life modelling.
Søren L. Poulsen
Søren Lundsted Poulsen is a consultant at the Concrete Centre at Danish Technological Institute, Denmark. He received his MSc degree in geology and PhD degree in natural sciences from Aarhus University, Denmark. His main research interests lie within concrete durability, especially issues related to chloride-induced corrosion initiation and modelling of service life for reinforced concrete structures.
Henrik E. Sørensen
Henrik Erndahl Sørensen is product manager at the Concrete Centre at Danish Technological Institute, Denmark. Henrik received his MSc in Chemical Engineering followed by a PhD in Chloride Penetration into Concrete from the Technical University of Denmark. His research interests and major work fields are durability of concrete structures with extended competences in chloride ingress, reinforcement corrosion, monitoring, field exposure stations, condition assessment, non-destructive testing and modelling.
Ueli M. Angst
Ueli Michael Angst is an assistant professor at the Department of Civil, Environmental and Geomatic Engineering at ETH Zurich, Switzerland. He received his degrees in civil engineering from ETH Zurich (MSc degree) and the Norwegian University of Science and Technology, Trondheim, Norway (PhD degree). His research interests include all aspects related to corrosion and durability of metal-based infrastructures, including sensors, monitoring, NDT, predictive modeling, and corrosion protection methods.
References
- Alonso, M. C., & Sanchez, M. (2009). Analysis of the variability of chloride threshold values in the literature. Materials and Corrosion, 60, 631–637. doi:10.1002/maco.200905296
- Andrade, C., & Rebolledo, N. (2012). Accelerated evaluation of corrosion inhibition by means of the integral corrosion test. In M. Alexander, H.-D. Beushausen, F. Dehn, & P. Moyo (Eds.), ICCRRR - concrete repair, rehabilitation and retrofitting III, pp. 132–133. Cape Town: Taylor & Francis Group.
- Angst, U., Elsener, B., Larsen, C. K., & Vennesland, Ø. (2009a). Critical chloride content in reinforced concrete - A review. Cement and Concrete Research, 39, 1122–1138. doi:10.1016/j.cemconres.2009.08.006
- Angst, U., Vennesland, Ø., & Myrdal, R. (2009b). Diffusion potentials as source of error in electrochemical measurements in concrete. Materials and Structures, 42, 365–375. doi:10.1617/s11527-008-9387-5
- Angst, U., Wagner, M., Elsener, B., Leemann, A., & Van Nygaard, P. (2016). Schlussbericht ASTRA AGB 2012/010: Methode zur Bestimmung des kritischen Chloridgehalts an bestehenden Stahlbetonbauwerken. ASTRA.
- Angst, U. M. (2019). Predicting the time to corrosion initiation in reinforced concrete structures exposed to chlorides. Cement and Concrete Research, 115, 559–567. doi:10.1016/j.cemconres.2018.08.007
- Angst, U. M., Boschmann, C., Wagner, M., & Elsener, B. (2017a). Experimental protocol to determine the chloride threshold value for corrosion in samples taken from reinforced concrete structures. J Vis. Exp, 126.
- Angst, U. M., & Elsener, B. (2017). The size effect in corrosion greatly influences the predicted life span of concrete infrastructures. Science Advances, 3.
- Angst, U. M., Geiker, M. R., Alonso, M. C., Polder, R., Isgor, O. B., Elsener, B., Wong, H., Michel, A., Hornbostel, K., Gehlen, C., François, R., Sanchez, M., Criado, M., Sørensen, H., Hansson, C., Pillai, R., Mundra, S., Gulikers, J., Raupach, M., Pacheco, J., & Sagüés, A. (2019). The effect of the steel-concrete interface on chloride-induced corrosion initiation in concrete – A critical review. Materials and Structures, 52.
- Angst, U. M., Geiker, M. R., Michel, A., Gehlen, C., Wong, H., Isgor, O. B., Elsener, B., Hansson, C. M., François, R., Hornbostel, K., Polder, R., Alonso, M. C., Sanchez, M., Correia, M. J., Criado, M., Sagüés, A., & Buenfeld, N. (2017b). The steel–concrete interface. Materials and Structures, 50.
- Arup, H. (1993). Determination of chloride threshold values (in Danish). Service Life of Marine Concrete Structures (in Swedish). Cementa AB.
- Bertolini, L., Elsener, B., Pedeferri, P., Redaelli, E., & Polder, R. (2013). Corrosion of steel in concrete - Prevention, diagnosis, repair. Weinheim: Wiley-VCH.
- Boschmann Käthler, C., Angst, U. M., Aguilar Sanchez, A. M., & Elsener, B. (2019a). A novel approach to systematically collect critical chloride contents in concrete in an open access data base. Data in Brief, 27.
- Boschmann Käthler, C., Angst, U. M., Aguilar Sanchez, A. M., & Elsener, B. (2019b). A systematic data collection on chloride-induced steel corrosion in concrete reveals the mechanism of corrosion initiation and improves service life modelling. Corrosion Science, 157, 331–336. doi:10.1016/j.corsci.2019.06.008
- Breit, W. (2001). Critical corrosion inducing chloride content - State of the art and new investigation results. Betontechnische Berichte 1998-2000. Düsseldorf, Germany.
- British Cement Association. (1997). Development of an holistic approach to ensure the durability of new concrete construction. Crowthorne, UK: British Cement Association.
- Cao, Y., Gehlen, C., Angst, U., Wang, L., Wang, Z. D., & Yao, Y. (2019). Critical chloride content in reinforced concrete - an updated review considering Chinese experience. Cement and Concrete Research, 117, 58–68. doi:10.1016/j.cemconres.2018.11.020
- Castellote, M., Andrade, C., & Alonso, C. (2002). Accelerated simultaneous determination of the chloride depassivation threshold and of the non-stationary diffusion coefficient values. Corrosion Science, 44, 2409–2424. doi:10.1016/S0010-938X(02)00060-4
- Chu, H., Wang, T., Guo, M.-Z., Zhu, Z., Jiang, L., Pan, C., & Liu, T. (2019). Effect of stray current on stability of bound chlorides in chloride and sulfate coexistence environment. Construction and Building Materials, 194, 247–256. doi:10.1016/j.conbuildmat.2018.11.010
- Elsener, B., & Angst, U. (2007). Mechanism of electrochemical chloride removal. Corrosion Science, 49, 4504–4522. doi:10.1016/j.corsci.2007.05.019
- fib. (2006). Model code for service life design. Lausanne: International Federation for Structural Concrete (fib).
- fib - task group 5.8. (2011). Condition control and assessment of reinforced concrete structures: Exposed to corrosive environments (carbonation/chlorides). Lausanne: Fédération Internationale du Béton fib/International Federation for Structural Concrete.
- Glass, G. K., & Buenfeld, N. R. (1997). The presentation of the chloride threshold level for corrosion of steel in concrete. Corrosion Science, 39(5), 1001–1013. doi:10.1016/S0010-938X(97)00009-7
- Glass, G. K., Reddy, B., & Buenfeld, N. R. (2000). The participation of bound chloride in passive film breakdown on steel in concrete. Corrosion Science, 42, 2013–2021. doi:10.1016/S0010-938X(00)00040-8
- Kayyali, O. A., & Haque, M. N. (1995). The Cl-/OH- ratio in chloride-contaminated concrete - a most important criterion. Magazine of Concrete Research, 47(172), 235–242. doi:10.1680/macr.1995.47.172.235
- Koch, G. (2017). Cost of corrosion. In A.M. El-Sherik (Ed.), Trends in oil and gas corrosion research and technologies, pp. 3–30. Boston: Woodhead Publishing.
- Koch, G. H. (2002). Corrosion cost and preventive strategies in the United States. Springfield: Turner-Fairbank Highway Research Center.
- Nilsson, L. O., Sandberg, P., Poulsen, E., Luping, T., Andersen, A., & Frederiksen, J. M. (1997) A system for estimation of chloride ingress into concrete. HETEK Report.
- NT Build 208 (1996) Hardened concrete: Chloride content by Volhard titration. edition 3. Nordtest, http://www.nordtest.info/.
- Page, C. L., Lambert, P., & Vassie, P. R. W. (1992). Investigations of reinforcement corrosion. 1. The pore electrolyte phase in chloride-contaminated concrete. Materials and Structures, 24, 243–252. doi:10.1007/BF02472078
- Polder, R. B., Van Put, M., & Peelen, W. H. A. (2017). Accelerated testing for chloride threshold of reinforcing steel in concrete. fib Symposium - High Tech Concrete: Where technology and engineering meet! Maastricht, The Netherlands.
- Poulsen, S. L., & Sørensen, H. E. (2019). Testing of new accelerated method for determination of chloride threshold values for corrosion initiation in reinforced concrete. Proc. Int. Conf. on Sustainable Materials, Systems and Structures (SMSS2019) - Novel Methods for Characterization of Materials and Structures. Rovinj (HR).
- Sandberg, P., & Pettersson, K. (1997). Chloride penetration into concrete. (L. O. Nilsson & J. P. Ollivier, Eds.). France: RILEM Publications.
- Sandberg, P., & Sørensen, H. (1999). Factors affecting the chloride thresholds for uncracked reinforced concrete exposed in a marine environment. Part II: Laboratory and field exposure of corrosion cells. Corros Eng Sci Technol, 1, 99–109.
- SIA (2007). SIA EN 14629 - Produkte und Systeme für den Schutz und die Instandsetzung von Betontragwerken - Prüfverfahren - Bestimmung des Chloridgehalts von Festbeton. SIA. Zürich, SIA.
- SIA (2011). SIA 269/2: Erhaltung von Tragwerken - Betonbau. Zürich, Schweizerischer Ingenieur- und Architektenverein.
- Sørensen, H. E., Poulsen, S. L., & Jönsson, U. (2016). Chloride threshold values from concrete blocks exposed at Rødbyhavn field exposure site. Fib Symposium 2016 on Performance-Based Approaches for Concrete Structures. Cape Town.
- Tang, L., Frederiksen, J. M., Angst, U., Polder, R., Alonso, M. C., Elsener, B., Hooton, R. D., & Pacheco, J. (2018). Experiences from RILEM TC 235-CTC in recommending a test method for chloride threshold values in concrete. RILEM Technical Letters, 3, 25–31. doi:10.21809/rilemtechlett.2018.55
- Tang, L., Nilsson, L. O., & Basheer, M. P. A. (2012). Resistance of concrete to chloride ingress: Testing and modelling. Boca Raton: CRC Press.
- Vassie, P. (1984). Reinforcement corrosion and the durability of concrete bridges. Proceedings of the Institution of Civil Engineers. London.
- Yang, Z., Polder, R., Mol, J. M. C., & Andrade, C. (2017). The effect of two types of modified Mg-Al hydrotalcites on reinforcement corrosion in cement mortar. Cement and Concrete Research, 100, 186–202. doi:10.1016/j.cemconres.2017.06.004
- Yilmaz, D., & Angst, U. (2020). Korrosionsbedingte Kosten an Ingenieurbauwerken im Schweizer Straßennetz. Beton- und Stahlbetonbau, 115, 448–458. doi:10.1002/best.202000004