
 ?Mathematical formulae have been encoded as MathML and are displayed in this HTML version using MathJax in order to improve their display. Uncheck the box to turn MathJax off. This feature requires Javascript. Click on a formula to zoom.
ABSTRACT
Resilient bridge infrastructure is a fundamental component of an uninterrupted transportation system. Thus, assessing the resilience of bridge infrastructure against natural hazards is crucial for transportation agencies. Therefore, the main objective of this study is to develop an integrated framework for analyzing the bridge infrastructure resilience against seismic hazards. The Dempster-Shafer method has been incorporated with the Best Worst Method to achieve this objective and accommodate uncertainty. At first, various resilience criteria have been identified based on an extensive literature review. The weights of the resilience criteria have been determined using the Best Worth Method based on the response provided by the experts. After that, the Dempster-Shafer rule of combination has been used to assess the seismic resilience of a highway bridge by proposing a Bridge Resilience Index. This proposed resilience framework can support transportation agencies in taking effective strategies against seismic hazards.
1. Introduction
Although the resilience perception was introduced in the 1970s (Minaie et al., Citation2017), according to Bocchini et al. (Citation2014), it became a widespread and critical concern of world politics in the late 1980s. Nowadays, the ‘resilience’ and ‘sustainability’ terms are the two prominent research topics and pragmatic considerations in civil infrastructure engineering. Bocchini et al. (Citation2014) defined ‘resilience’ as a measure that evaluates a system’s capacity to encounter an abnormal incident and the ability to recover the damage that happened due to that unexpected event. The development of society is measured by evaluating the performance of the components of two key indicators: (i) Social and (ii) Physical Infrastructure. In contrast, Sierra et al. (Citation2018) considered the people, economic condition, and literacy ratio of the community and other factors as Social Infrastructure. Cimellaro et al. (Citation2016) identified the transportation system, buildings, and power water cyber network as physical infrastructure. As per Mcallister et al. (Citation2016), community resilience can be determined by the built infrastructure’s ability to sustain acceptable levels of functioning during and after natural disasters, as well as to regain basic functionalities within a specific timeframe, depending on the requirements of each facility or service in the society.
Bridges are an elementary component of transportation infrastructure systems and play a crucial role in providing uninterrupted and smooth communication. Dong and Frangopol (Citation2015) recognized that bridge’s failure due to natural mishaps, like earthquakes, significantly impacts socio-economic development. Zhang and Wang (Citation2016) stated that bridges are commonly the most susceptible connections in road transportation networks, necessitating appropriate risk management methods targeted at enhancing transportation infrastructures’ overall resilience against natural catastrophes. Kilanitis and Sextos (Citation2018) determined that the rupture in the bridge’s structural parts and damages in the foundation due to natural disasters triggered significant direct and indirect loss, for instance, the loss in conducting recovery procedure and the prolonged traffic disruption in the influenced region.
Several reports paint a bleak picture of the condition of North America’s bridge infrastructure. The 2019 Canadian Infrastructure Report Card stated that 39% of the bridges and tunnels are in fair, poor, or very poor condition (CIRC, Citation2019). The replacement value of the bridges alone was estimated to be over CAD 21 billion. According to ASCE’s 2021 Infrastructure Report Card, bridges in the United States received a grade of ‘C’ with 231,000 bridges requiring repair and preservation work worth $125 billion (ASCE, Citation2021). As bridge infrastructures around the world continue to grow old and deteriorate with time, transportation agencies are slowly evolving from building new bridges to maintaining existing ones (Sharma et al., Citation2018). However, a proper maintenance plan within a limited budget would require resilience quantification under various natural hazards. Several recent extreme natural hazard events took a heavy toll on the transportation infrastructure, causing significant economic loss. Recently, extreme rainfall resulted in severe mudslides, floods and devastation in British Columbia, Canada and damaged road and rail links connecting Vancouver’s port to the rest of Canada. The estimated loss could be as high as 450 million dollars(Insurance Bureau of Canada, Citation2021).
According to Bruneau et al. (Citation2003), even though natural disasters are inevitable, a robust defensive scheme should be produced by adopting a resilience principle that identifies the infrastructure’s capacity to resist the effect of any hazard and recover to its previous condition as quickly as possible. Hence, bridge infrastructure resilience analysis is critical to ensure a sustainable transportation system. Typically, risk management approaches aim to mitigate the effects of potentially detrimental incidents and their probable repercussions in an endeavored way. Risk management strategies frequently emphasized response strategies, including control and protection and the development of mechanisms to minimize or absorb potential hazards. The objective of a prevention measure is to detect risk early on and persist against it long enough for an appropriate action to be implemented (Hosseini et al., Citation2016).
According to Sun et al. (Citation2020), the principle of infrastructure interdependence is straightforward. Still, if too many interactions between transportation infrastructure and other infrastructures are incorporated, the intricacy of these approaches escalates. As a result, engineers and researchers are focusing their efforts on evaluating infrastructure resilience. Based on available research, Patel et al. (Citation2020) glimpsed that evaluating bridge resilience required careful consideration of several aspects that produce various sorts of uncertainty. Earlier research primarily focused solely on the technical aspects of the problem, ignoring the institutional, environmental, and economic aspects of bridge resilience. Typically, evaluating all these complementary components of resilience entails a variety of criteria with varying units of measurement, which can inject complications and ambiguities into the evaluation process. A qualitative method based on multicriteria decision-making (MCDM) approaches might be used to circumvent this constraint. The comprehensive literature search that shown in the following highlighted that only a few studies have addressed establishing a framework for the bridge Resilience Index using MCDM methodologies.
Hence, the primary purposes of this study can be stated as follows:
To establish a hierarchical model by identifying the parameters for bridge infrastructure resilience against the seismic hazard.
To measure the weighs of said resilience parameters in the hierarchical model and quantify bridge infrastructure resilience.
To evaluate the sensitivity of the developed resilience model by applying actual bridge data in the proposed model.
The remainder of the article has five other sections. In section 2, an extensive review of available and relevant literature was performed to identify the factors of bridge infrastructure resilience against the earthquake, concentrating on the multicriteria assessment approach. The study method initiated in the present study is to prioritize the elements using the best-worst approach and determine the bridge Resilience Index incorporating the Dempster-Shafer theory explained in Section 3. The following section contains the results and discussion. Again, the description of the Case Study is mentioned in the subsequent section, and finally, in section 6, the conclusions, constraints, and scope of future study are articulated.
2. Literature review
2.1. Identifying research gap
Articles from the two prominent databases have been investigated to identify the research gap between the proposed study and available literature. In this regard, at first, a systematic review of the available literature was performed based on the Web of Science database to get a bibliographic picture of the earlier research on bridge infrastructure resilience. The (flow-chart: 4 steps) was followed to perform the VOSviewer bibliographic analysis.
Figure 1. Flowchart of the bibliometric analysis by using VOSviewer.
Here, as the study’s primary aim was to analyze the bridge infrastructure resilience using the multicriteria decision analysis tools, three relevant topic words were picked up to get the maximum number of literature on the Web of Science database. Hence, using the selected topic words ‘infrastructure resilience,’ ‘multicriteria decision analysis tools,’ and ‘bridge infrastructure resilience,’ only seventeen articles were found in the Web of Science database. It is mentionable that the publication years of those articles were between 2016 and 2021. About 99 keywords were obtained by observing those ‘articles’ titles and abstracts. After getting the keywords from the related articles, the bibliometric data of those articles were captured to develop a bibliographic map in the VOSviewer (Van Eck & Waltman, Citation2010). The bibliographic map shows the keywords that can provide a clear picture of to what extent the existing studies have been conducted. The bibliographic map is produced in the VOSviewer platform using those keywords as shown in ).
Figure 2. The bibliographic map generated using VOSviewer on bridge infrastructure resilience.
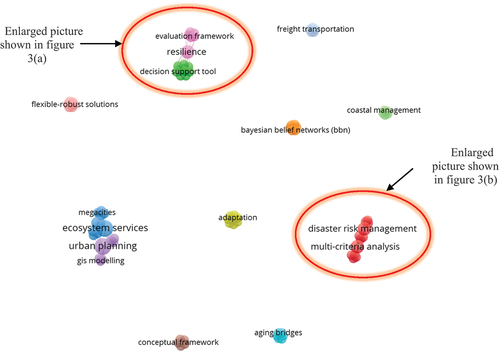
It is notable that all the keywords were not unique, and many of those common keywords were alienated while producing a VOSviewer bibliographic map. The keywords that are shown in have varying font sizes. The font size of these words fluctuated on the basis of these ‘words’ presence in the repetitive papers, i.e., the larger the font size of the topic words indicates the more recurrences of those words among the selected papers. Here, in , it can be observed that there are ten clusters of the network here, and not all the keywords are inter-connected in this network The inter-linked keywords fell under the articles with a similar or common topic; no connection with the keywords indicates that those were obtained from separate studies. Among the ten clusters, we can see only two groups with the multicriteria decision analysis (MCDA) keywords, which indicates very few works done on infrastructure resilience analysis using MCDA tools. To see a closer look at the two clusters where the keywords are inter-connected with each other, ) are presented.
Figure 3. The bibliographic map on bridge infrastructure resilience using decision-making tools.
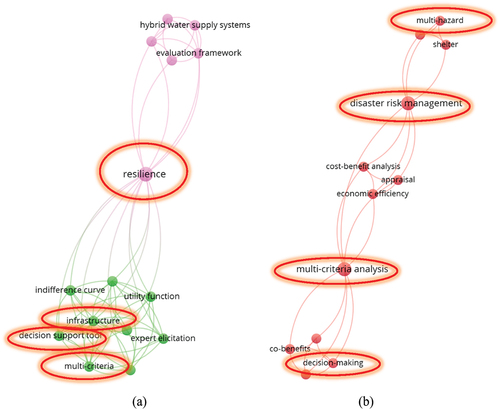
From ), it is visible that a limited study was done on resilience assessment using MCDA tools. Based on the bibliometric analysis using the Web of Science database, it can be deduced that there was no study conducted on bridge infrastructure resilience against seismic hazards through decision-making tools.
As this research proposed a new approach to develop a framework for determining bridge infrastructure Resilience Index, to get a closer picture of the research gap in this regard, another organized review was conducted based on Scopus indexed articles. Using the keywords Bridge infrastructure Resilience Index by searching in the Scopus indexed articles database, only 20 articles were found based on the papers between 2012 and 2021.
By going through the 20 Scopus indexed and some other articles on various infrastructure Resilience Index the following was formulated.
Table 1. Different infrastructure resilience index.
In our study, bridge resilience is considered a combination of reliability of the existing structure and potential recovery facility after effect. So, the Resilience Index of our research is computed based on the condition and uncertainty of each of the parameters under reliability and recovery individually and combinedly. As several articles presented here are regarded as different infrastructure systems, they may have different philosophies for the Infrastructure Resilience Index. But, the general concept of resilience is an infrastructure or system’s ability to withstand potential natural hazards and how fast a recovery process is after a hazardous incident. The above discussion clearly reveals that a limited study is available in assessing bridge infrastructure resilience against seismic hazards. So far, only one article has been found where the flood hazard was considered to develop a framework for bridge Resilience Index by using MCDA tools. Therefore, the proposed framework for determining Bridge Resilience Index against seismic hazards using MCDA tools is the novel contribution of this research work.
2.2. Identifying the appropriate Multi-Criteria decision making (MCDM) tools for resilience analytics
As natural hazards are unavoidable, it is essential to integrate the resilience principle for bridge infrastructures to make the mass transit system more resilient to potential natural hazards. However, the previous section indicated that resilience in infrastructure asset management is a relatively new topic. On the other hand, based on the opinions of Azevedo et al. (Citation2013), Cimellaro et al. (Citation2016), Ernst et al. (Citation2016) & Kammouh et al. (Citation2020), infrastructure resilience evaluation requires quantitative and qualitative data, expert’s judgment, data from various resources, and missing data management.
Sen et al. (Citation2021b) found that determining infrastructure resilience is not straightforward, and it requires the collection of a wide range of qualitative and quantitative information from multiple sources. As a result, there is a risk of involving ambiguous and insufficient information, and it is tough to assess the ultimate objective in a single representation in the event of a multi-criteria decision-making (MCDM) dilemma. According to Sierra et al. (Citation2018), multicriteria evaluation approaches enable decision-making among several substitutes while considering the realistic environment’s various aspects. Multicriteria decision-making (MCDM) methods are used to describe these methodologies. Beheshtian et al. (Citation2017) and Mahmoud and Chulahwat (Citation2017) introduced different tactics to evaluate resilience. González et al. (Citation2020) discovered that several strategies could be employed to lessen the complexity that triggered the impediment due to interconnections among the infrastructure. Though the probability model is suitable to omit the above-discussed complications by demonstrating evidence-based degrees of belief, the drawback of the theory is the incapability of considering the uncertainty issues. Here, the degree of belief describes the extent to which we believe the truth of particular assertions. The greater a person’s degree of belief in a specific proposition indicates, the greater his confidence in its integrity.
Many multicriteria decision-making tools can be found in the available literature for decision-making. Liu (Citation2016) found Analytic Hierarchy Process (AHP) and Fuzzy AHP are very prominent tools among those MCDM techniques. Sen et al. (Citation2021a) conducted a comparative study on different MCDM tools such as AHP, Fuzzy AHP, Technique for Order Performance by Similarity to Ideal Solution (TOPSIS), Multicriteria Optimization and Compromise Solution (VIKOR), and Best Worth Method (BWM) by analyzing various published articles. From that comprehensive analysis, Sen et al. (Citation2021a) highlighted that BWM is a great tool to compute the weights of each criterion of a model” In addition, they employed the Hierarchical Evidential Reasoning (HER) technique to accommodate the ambiguity of the criteria they assessed. Their study’essentially used the Dempster-Shafer (D-S) method to estimate a combined flood Resilience Index for residential infrastructure. Therefore, this study considered an integrated modeling approach for bridge resilience assessment against seismic hazard by combining the BWM and D-S theory for computing the weights of the parameters responsible for bridge infrastructure’s resilience, followed by determining the Resilience Index of bridges.
2.3. Identifying the bridge infrastructure resilience parameters
Bruneau et al. (Citation2007) and Cimellaro and Reinhorn (Citation2010) defined the physical and social systems resilience by four ‘R,’ that is Robustness, Redundancy, Resourcefulness, and Rapidity. To develop the framework for developing an index of bridge resilience against the seismic hazard, significant factors, and the subsequent parameters are required to be selected in the first place. Thus, the authors initially chose the following well-known infrastructure life cycle diagram (ChienKuo et al., Citation2020; Dong & Frangopol, Citation2015; Sen et al., Citation2021b) to identify the significant factors and understand the resilience of bridge infrastructure against the seismic hazard (). The figure describes the infrastructure’s operation during its service life if it undergoes any substantial disaster.
Figure 4. Infrastructure’s performance during its service life (modified after Sen et al., Citation2021bb).
Sen et al. (Citation2021b) demonstrated that generally, the level of service of an infrastructure deteriorates moderately over time. From , it can be noticed that the performance of infrastructure sharply drops when it experiences a disaster. From the damage path, the damage of infrastructure due to hazards can be measured, and it is termed as ‘Loss due to Disaster.’ The remaining level of service of infrastructure after a disastrous incident is called the reliability of that infrastructure. Therefore, the amount of damage due to hazards is contingent on the ‘ ‘infrastructure’s reliability. However, the recovery path and recovery period show how an infrastructure regains functionality to its regular status.
To get some more insight on the resilience factors, has been compiled, which was obtained based on the available literature in our earlier study (Khan, Kabir et al., Citation2022), to find out the critical resilience factors for physical infrastructure against natural hazards:
Table 2. Key resilience factors of civil infrastructure against natural hazards (Khan et al., Citation2022).
On the basis of the above discussion, this study considered reliability and recovery as the two crucial elements of the resilience of bridge infrastructure. Under these two equally weighted key factors of bridge infrastructure resilience, for appraising the resilience of bridge infrastructure against the seismic hazard, the authors selected a total of 15 parameters. and present the description of the resilience parameters under the reliability and recovery factors. After that, a hierarchical bridge infrastructure resilient system against seismic hazards is developed ().
Figure 5. Bridge infrastructure resilient hierarchy system against seismic hazard (Khan et al., Citation2022).
Table 3. Bridge infrastructure resilience parameters under reliability factor (Khan et al., Citation2022).
Table 4. Bridge infrastructure resilience parameters under-recovery factor (Khan et al., Citation2022).
3. Methodology
The major steps of the proposed resilience assessment framework are shown in . The BWM is used in this study to determine the weight of the bridge infrastructure resilience parameters. Then, the D-S theory is used to quantify the bridge infrastructure Resilience Index. The details of BWM and D-S theory used in this analysis are described thereafter.
Figure 6. Stages of framework for seismic resilience of bridge infrastructure.
3.1. Best worst method
Recently, BWM has been widely used as an MCDM tool, as it requires fewer pairwise analogies than other methods in this category and generates reliable results. As per Rezaei (Citation2016), the following steps were undertaken to use linear BWM methods:
Step 1: At first, the decision-making parameters required to achieve the purpose of the study should be determined. The importance of the parameters under reliability and recovery clusters of resilience is mentioned in and .
Step 2: The bridge experts select the best (the most significant) parameter and the worst (the least important) parameter in the second step. If there are more than nine decision-making parameters, they should be divided into several clusters (sub-group) to make the evaluation process more straightforward.
Step 3: In the third step, the preference of the best parameter compared to other parameters needs to be evaluated on a scale of 1 to 9. Here, 1 implies equal emphasis, and 9 denotes the greatest priority over the other parameters.
The outcome of the best-to-others vector would be:
where, N, an integer, is the number of the parameters, j can be any parameter between 1 and n, pBj denotes the inclination of the best parameter B over other parameter j,
Step 4: In this step, the preference of the other parameters compared to the worst parameter needs to be determined. The scale in this regard should be similar, i.e., 1 to 9. Likewise, 1 implies equal priority over the worst, and 9 indicates another vector’s significant importance over the worst.
The outcome of the others-to-worst vector would be:
where, where, pWj denotes the inclination of the other parameter j over the worst parameter W.
Step 5: In these final steps, optimum weights ( for all parameters should be calculated through satisfying for every single set of wB/wj and wj/wW states. The most probable result is wB/wj =
and wj/wW =
. The solutions can be achieved by lessening the maximum of the set of {|wB-
×wj| and |wj-
×wW|} as shown in Equationequation (3)
(3)
(3) :
Contingent on,
The above condition can be transformed into a linear equation as mentioned under:
min,
Contingent on,
|wB – ×wj| ≤
for each and every j
|wj – ×wW| ≤
for each and every j
Here, the consistency ratio is expressed by the symbol ξL*. The lower value of ξL* indicates the greater the degree of reliability.
3.2. Dempster-Shafer Theory
According to Sen et al. (Citation2021a), a variety of data needs to be collected from various sources to quantify the Resilience Index. Thus, uncertainty could be incorporated as a result of the collection of data from several sources. According to Dempster (Citation1967) and Shafer (Citation1976), the D-S theory can handle this uncertainty, primarily by normalization, which is achieved by taking the weightage of each parameter. As the different parameters have a distinct influence on determining the Resilience Index, weights of each parameter are assessed by BWM tool to get a more reliable outcome. The steps of D-S theory can be described as under (Lasker et al., Citation2021; Sen et al., Citation2021aa):
Step 1: At the beginning, the power set is defined. In this approach, the dataset of each feature is referred to as the Frame of Discernment (Θ). It is mentionable that the Frame of Discernment (Θ) is the collection of all feasible hypotheses relating to the given dataset that determines the classes to which the data must be allocated. (Chen et al., Citation2014)
Step 2: After determining the power set, basic probability assignment (BPA) needs to be allocated to every focal component ranging from 0 to 1. It is mentionable that, here, 0 indicates no belief, and 1 indicates complete belief. The properties of BPA can be expressed as follows:
Here, m(A) is called the masses, i.e., direct support of evidence A.
Step 3: A variety of data from different sources is incorporated in this step by using the D-S ‘theory’s rule of combination to get the final result. For instance, if and
are considered as the BPAs of two different proof of evidence in Θ, and A is a subset, i.e.,
. Therefore, according to the D-S theory’s rule of combination, the associated probability assignment can be expressed as equation (8):
The contradiction between the subsets X and Y is denoted by, and
, where
indicates the empty (void) set. The
is computed by adding all the products of
from all subsets, where A =
. According to the features of D-S theory, there is no fixed or definitive rule for progression of the ‘parameters’ combination; Nair et al. (Citation2015) proposed the aggregate rule of this theory as per the following equation (9),
depicts a generic HER framework for resilience, here, denotes the general parameter tier,
denotes the elementary aspect tier, and
denotes the framework inputs for allocating BPA on various aspects. As indicated in equation (10), the evaluation of general attributes can be computed:
Figure 7. Resilience Framework of a Generic HER model.
Here, the number of aspects is expressed by n. The BPA is indicated by m, the weight of the parameters is expressed by , and the appraisal of the parameter is depicted as S in . Likewise, the ultimate resilience value can be calculated by adding the E1 and E2.
4. Bridge infrastructure resilience framework
4.1. Determination of weights of the parameters of bridge resilience clusters using BWM
The parameters for bridge infrastructure resilience are presented in . The weights of each parameter are calculated using the BWM method. This study obtained opinions and judgments from the five bridge engineers working in a government agency, private and consultancy firms responsible for bridge design and maintenance work. Their current designation and work experience are shown in . This group of experts represents a broad focus on bridge resilience as all experts had expertise and experience in the relevant areas. It is mentionable here that the weights of the bridge infrastructure resilience parameters against seismic hazard using BWM were taken from our already published conference paper. To better understand the details, calculations were provided hereunder.
Table 5. Details of experts.
According to the BWM procedures mentioned above, the experts choose the best and the worst parameter under the reliability and recovery factors that are shown below in . After choosing the best and worst criteria each of expert rated the best parameter over the other parameters under the two clusters of bridge infrastructure resilience are depicted in and .
Table 6. The best and worst parameters according to different experts’ opinion (Khan et al., Citation2022).
Table 7. The rating of the best parameter over other parameters under reliability (Khan et al., Citation2022).
Table 8. The rating of the best parameter over other parameters under recovery (Khan et al., Citation2022).
After rating the best parameter over other parameters, the experts prioritized all the other parameters over the worst parameter under two factors of resilience are shown in and .
Table 9. The other parameters’ priority over the worst parameter under reliability (Khan et al., Citation2022).
Table 10. The other parameters’ priority over the worst parameter under recovery (Khan et al., Citation2022).
Finally, using the BWM step 5, the optimal weight for each parameter under reliability and recovery factors were calculated and shown in and , respectively. also highlight the consistency ratio of the analysis, which represents very consistent and reliable results (Rezaei, Citation2016).
Table 11. The weights of the parameters as per each expert under reliability.
Table 12. The weights of the parameters as per each expert under recovery.
After that, the geometric mean operation was performed to aggregate the weights of the 15 bridge infrastructure resilience parameters computed based on the five experts’ opinions (). It is mentionable that the geometric mean of the parameters is adjusted equivalent to their weight to get total geometric weight equal to one under each cluster. In this study, equal weights (0.50) are considered for reliability and recovery.
4.2. Determination of bridge resilience index using D-S theory
As in the D-S method, the parameters are grouped into various frames of discernment; therefore, three frames of discernment are considered for each considered parameter in the hierarchical model for bridge infrastructure resilience, such as Poor (P), Moderate (M), and Excellent (E). detail the discerning frame for each characteristic.
Table 13. Resilience, reliability and recovery and all the parameters’ frame of discernment.
Earlier, the weight of each parameter has already been calculated based on experts’ opinions using BWM. In the case of applying D-S theory, a different Frame of Discernment is denoted by H1,2, … n, and here, the degree of belief is expressed as βn,1. It is mentionable that here, n = 3. Now, for , the first parameter in the aggregation contributing to the first attribute, the S(
), evaluation for parameter
can be represented as per following mathematical expression (11; Bai et al., Citation2008; Sen et al., Citation2021a; Taylor et al., Citation2013)
where, and
,
for complete belief and
for partial belief.
5. Case study
To demonstrate the applicability of the proposed framework, it has been implemented to assess the infrastructure resilience against the seismic hazard of a particular bridge located in the British Columbia province of Canada. In this study, the degree of belief is obtained from the two sets of data for that specific bridge. The details on the bridge and results are discussed in this section.
5.1. Description of the bridge
The bridge considered in this study is located on the Trans-Canada Highway in Vancouver Island, British Columbia, Canada. The studied bridge is a multi-span continuous concrete girder bridge that supports a double carriageway consisting of two traffic lanes in each direction. The bridge carries a 3.2 m wide pedestrian sidewalk on the west side. The total length of the bridge along the control line is 116.0 m. The span lengths from South to North are 45.5 m, 34.0 m, and 36.5 m along the control line, and the total bridge width is 16.12 m. The cast-in-place bridge decks are 240 mm thick, which is supported by five prestressed precast concrete girders. The main carriageway and the pedestrian sidewalk have a cross fall of 2%. The bridge has conventional seat-type abutments at both ends and is supported on pier columns at the interior spans. The bridge has steel diaphragms at abutments and pier. Both abutments and piers are supported on the pile foundation (HP360 ×132). The schematic diagram of the bridge is shown in .
Figure 8. (a) Plan and elevation of the bridge, (b) Typical cross section at pier location, (c) Cross section of the pier cap beam, and (d) Cross section of the concrete pier.
The bridge was designed and constructed in the late to mid-eighties and considered a major route bridge as per the current Canadian Highway Bridge Design Code (CSA-S6-19). The bridge is inspected bi-annually by experienced bridge inspectors to evaluate the existing condition of the bridge. The detailed inspection report obtained from the concerned authority is used in the study for the evaluation grade of the parameters of bridge resilience. Additionally, a detailed finite element model of this bridge was developed, and a vulnerability assessment was performed by Billah and Alam (2021). The details of the bridge was obtained from inspection reports and bridge details provided by the British Columbia Ministry of Transportation and Infrastructure (BCMoTI). These information were not collected from any published literature and hence no specific reference is available. More specific details and the details of the BCMoTI document can not be provided in the paper due to confidentiality agreement between BCMoTI and the authors. However, similar bridges were studied by Billah and Alam (2021).
5.2. Data collection
Based on the detailed vulnerability assessment from finite element analysis and bridge inspection report, the inputs required for the bridge Resilience Index calculation were estimated. Therefore, one set of data is from the bridge inspection report (data set-1), and another set is taken from the results of detailed vulnerability assessment from finite element analysis of that same bridge (data set-2). After getting a value of β, the nine appraisals of reliability and six appraisals of recovery are presented in . An example of the evaluation grade of the parameters of bridge resilience presented in is provided here. For example, the bridge pier is considered the reference element of the bridge. For dataset-1 (form inspection report), the evaluations are based on the bridge condition inspection report. In the inspection report, the bridge inspectors provide percentage condition rating for each bridge component inspected. For dataset-2 (from FE analysis), the evaluations are based on the detailed FE analysis conducted on the same bridge by Billah and Alam (2021). From a detailed seismic vulnerability assessment of this bridge, it was found that the pier has 20% probability of extensive damage, 50% probability of moderate damage and 20% probability of slight damage. The damage probabilities reported here represent the probability of exceedance at peak ground acceleration (PGA) of 0.46 g, which correspond to the design PGA for the 2475-year return period earthquake. Accordingly, the weights of 0.2, 0.5, and 0.2 are assigned for poor, moderate, and excellent evaluation grade, respectively. There are several condition codes such as excellent (E), good (G), fair (F), poor (P), very poor (V), not inspected (X), and not applicable (N). Based on the % condition rating reported in the inspection report, the evaluation grades are listed in . For the bridge pier considered in this study, the inspection report showed P = 30%, G = 50%, and E = 10%. These values are directly reported in for poor, moderate, and excellent evaluation grade, respectively.
Table 14. Evaluation grade of the parameters of bridge resilience.
In the next step, these nine parameters of reliability and six parameters of recovery are combined using the D-S rule of combination to get the reliability and recovery indices of a bridge. Hence, the ultimate Resilience Index of a bridge can be assessed using the same D-S rule by integrating the two computed indexes, and it can be expressed as:
S(Reliability) = S (Foundation Abutment
Bearing
Pier
Girder
Age
Design Period
Bridge Geometry)
S(Recovery) = S (Monitoring Maintenance
Importance of the Structure
Resource Availability
Approachability
Degree of Damage)
S(Resilience) = S (Reliability Recovery)
The D-S theory rule of combination between the recovery parameters for data set-1 is detailed below,
The evaluation grade of the parameters of recovery are S() = {{(P, 0), (M, 0.9), (E, 0)} and S(
) = {(P, 0.1), (M, 0.7), (E, 0}, S(
) = {(P, 0), (M, 0.7), (E, 0.3)}, S(
) = {(P, 0), (M, 0.3), (E, 0.7)}, S(
) = {(P, 0), (M, 0.3), (E, 0.7)} and S(
) = {(P, 0), (M, 0.4), (E, 0.6)}. The corresponding weights for all recovery parameters are:
= {0.095, 0.145, 0.212, 0.131, 0.061, 0.356}. To compute the BPA of basic parameters, the weight and evaluation grade should have to be multiplied with each other, and here the {1-
BPA} is measured as uncertainty or ignorance (H).
The basic parameters of BPA can be expressed as follows:
Table
Combination factor (K = ) should be multiplied with the new BPA for aggregating two parameters; hence, aggregation of
and
can be computed as
= [1 – (0 × 0.102 + 0 × 0 + 0.086 × 0.015 + 0.086 × 0 + 0 × 0.015 + 0 × 0.102)]−1
= 1.001292 ≈ 1.001
Now, the new BPAs can be obtained by aggregating the first two parameters’ BPA of recovery cluster as expressed below:
In the following step, the prior value of BPAs are aggregated with the 3rd parameter’s BPAs; likewise, the resultant BPAs are aggregated with its subsequent parameters’ BPAs, leading to sixth ‘parameters’ BPAs. Hence, the Recovery index (E2) of the bridge data set-1 is determined by integrating each of the six parameters of the Recovery cluster as per the following formula:
Consequently, for the two data set of the bridge, the reliability (E1) and recovery (E2) indices are computed, and finally, the ultimate purpose of this study, Resilience Index, is determined by integrating the reliability and recovery indices, as shown in .
Table 15. Bridge resilience against seismic hazard.
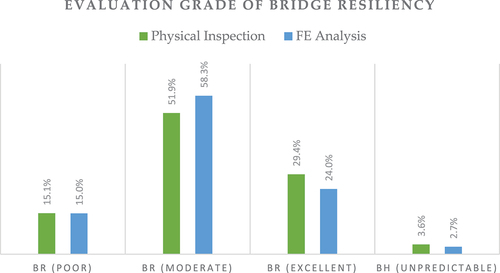
To get an analogous picture of the bridge resilience using two types of data from two different sources, we can get the .
Figure 9. Bridge resilience distribution grade from two different sources of data.
Detail Calculation of Bridge Resilience Index (BRI):
By using the following formula, BRI can be computed:
Therefore, Resilience Index Calculation based on Physical Inspection:
Again, Resilience Index Calculation based on FE Analysis:
5.3. Discussion on the results
The outcome of the analysis has mainly two portions. In the first part, the weights of each parameter under the reliability and recovery factors were computed using the BWM tool based on the opinion of five bridge experts. The summary of the outcome from BWM analysis is depicted in and , where it is understandable that the parameter ‘Design Period’ got the highest weight (0.251) among the nine parameters under the reliability cluster. Hence, based on the experts’ opinion, we can conclude from this part of the study’s analysis that bridge resilience’s reliability parameters mainly depend on the design criteria of the bridge, which indicates that the consideration for seismic hazards in the bridge design philosophy is very crucial. The outcome substantiated the statement of Mitchell et al. (Citation2010), Ramanathan et al. (Citation2015), and Shekhar et al. (Citation2020) that bridge design engineers are getting more concerned about the inclusion of seismic hazard factors in the structural analysis of bridges and the designs of bridges are more resilient against seismic hazards. Six of the nine characteristics of a bridge’s reliability factors comprise the bridge’s primary structural components. Now, it can be seen from the findings that ‘Pier’ ranked second among the nine reliability parameters. As per the findings of this study, we can conclude that among the six fundamental structural components of a bridge, the ‘Pier’ is the most critical structural component that demands special attention.
Again, in getting the most significant parameters under the recovery factor from the analysis, ‘Degree of Damage’ reached the top priority and gained the highest weight (0.356) among all other parameters of bridge infrastructure resilience. That means the recovery factors of bridge infrastructure resilience largely depend on the severity of damage encountered during an earthquake. The second most prominent parameter under the same cluster is the ‘importance of the structure,’ with a weightage of 0.212. As mentioned in , according to the Canadian Highway Bridge Design Code, the bridges are classified into three categories: Lifeline, Major route, and other types of bridges. The bridge’s recovery period will be influenced based on the bridge classification. Hence, this parameter also significantly impacts the recovery cluster of bridge infrastructure resilience.
After getting the BWM analysis outcome, the Bridge Resilience Index evaluation using D-S theory has been started. Then, the outcome of this study, i.e., the Bridge Resilience Index, was obtained using the Bridge infrastructure resilience framework against seismic hazard and depicted in and . From those results, it is clearly visible that the uncertainty or ignorance percentage is 3%. In accordance with the proposed framework, the resilience index for bridge infrastructure is regarded into three categories: poor, moderate, and excellent.
According to the outcome of the proposed bridge resilience model, in case of poor bridge resilience against seismic hazards, the index computed from the vulnerability assessment report’s inputs shows an almost equal value around 15% for both approaches that is by physical inspection report and FE analysis. But, in the case of moderate bridge resilience, based on the vulnerability assessment report, the bridge resilience is showing 7% higher than that of the resilience obtained based on the physical inspection report. On the contrary, in the excellent category, bridge resilience computed by physical inspection is 5% higher than that of the FE analysis report.
However, the range of bridge resilience index between maximum bridge resilience index = 59%), and minimum bridge resilience index
based on physical inspection is around 4%. Whereas the range of bridge resilience index between maximum bridge resilience index
= 55.8%), and minimum bridge resilience index
based on FE analysis is near about 2.7%, which indicates slightly less variation or uncertainty. Overall, based on the bridge resilience index, we can conclude that the said bridge is moderately resilient against seismic hazards. Since both physical inspection and FE analysis resulted in almost similar results, it is found that there is not much variation in the final outcome. Therefore, instead of using the time-consuming, expensive FE analysis, we can determine the bridge resilience against seismic hazard based on the physical inspection report of a bridge, provided it is done by experienced inspectors and reviewed by qualified engineers.
6. Conclusions
This study presents a framework for quantifying bridge infrastructure resilience against seismic hazards by systematically integrating BWM and Dempster-Shafer’s theory. To evaluate the framework, the inspection data from an existing bridge has been obtained. The study’s findings effectively identified the critical criteria according to their order of precedence for the seismic resilience of bridge infrastructure. As the primary approach for assessing a bridge or bridge network’s overall resilience is identifying and indexing the resilience attributes, the study results will allow decision-makers to determine the resilience of an existing bridge or bridge infrastructure system against seismic events.
The outcome from the framework for determining the bridge resilience index provides the belief values of three distinct performance statuses of that bridge. For any given data, the computed belief values of a bridge from the developed framework can demonstrate how much that bridge is potentially resilient against seismic hazards in terms of poor, moderate, and excellent categories. Therefore, from the bridge resilience index value, the current overall performance of the bridge against potential seismic hazards is assessed. This study developed a novel index that incorporates all the factors to calculate a bridge’s total resilience score against the seismic hazard. This index will assist the executing agency in providing a prompt reaction to the critical bridge components by strengthening/repairing those components. As a result, the bridge infrastructure will be offered better resilience. This analyses’ data and numbers will help the authority withstand prospective seismic hazards and recover from the aftermath of such disasters.
The following are some of the significant advances made by this study in the domain of bridge infrastructure resilience against seismic hazards:
Employing the BWM to prioritize the identified parameters by assessing their weightage for developing the framework to determine the resilience index.
Applying the HER technique, i.e., Dempster-Shafer theory, incorporating with the outcome from BWM to create an MCDM framework for evaluating the bridge resilience index.
Using the inputs, taken from actual data of a bridge from two different perspectives, in the framework to determine the bridge resilience index against seismic hazards and to determine the most critical factors that increase the bridge resilience.
A validation of the FE results with the ‘Physical Inspection’ report would be very interesting. Although such validation is beyond the scope of this study and requires more detailed inspection report as well as detailed description of the condition of the bridge components to model those as accurately as possible to mimic the actual site condition. However, those information are not available and can not be performed with the available information. This is one of the limitations of this study and should be considered for future studies. Again, in the future, a more comprehensive framework considering vulnerability, robustness, and recovery, along with more complex dependencies at the indicator level, can be developed. The developed resilient bridge infrastructure framework can be extended to other hazards like floods, landslides, tsunamis. The suggested approach may also be enhanced further by including a real-time information system for updating bridge resilience indicators and generating time-varying resilience assessments.
Acknowledgments
The second author acknowledges the financial support through Natural Science and Engineering Research Council of Canada Discovery Grant Program (RGPIN-2019-04704).
Disclosure statement
The Coalition for Disaster Resilient Infrastructure (CDRI) reviewed the anonymised abstract of the article, but had no role in the peer review process nor the final editorial decision.
Data availability statement
Some or all data, models, or code that support the findings of this study are available from the corresponding author upon reasonable request.
Additional information
Funding
Notes on contributors
Saiful Arif Khan
Md Saiful Arif Khan is a Ph.D. student in Industrial Systems Engineering at the Faculty of Engineering & Science and has been working as a Research Assistant in the Sustainable and Resilient System Analytics Group at the University of Regina (UofR), Canada, since 2020. His research focuses on the resilience analysis of bridge infrastructure. Prior to attending UofR, he earned a Master of Science in Civil Engineering from the University of Alabama at Birmingham in the United States. Mr. Khan graduated from the Bangladesh University of Engineering & Technology in 2008 with a bachelor's degree in civil engineering. He has almost a decade of professional and academic expertise in Transportation Infrastructure Asset Management.
Golam Kabir
Golam Kabir is an Associate Professor in the Industrial Systems Engineering program at the University of Regina, Canada and an Adjunct Professor at the Department of Mechanical, Automotive and Materials Engineering, University of Windsor, Canada. He received his Ph.D. from the University of British Columbia (UBC), Canada. He completed his Masters and Bachelor degrees from the Department of Industrial and Production Engineering, Bangladesh University of Engineering and Technology (BUET), Bangladesh. He has published more than 150 referred journal and conference papers and was involved in multiple NSERC funded projects. His major research interests include system risk, reliability, resilience assessment, interdependent network resilience analytics, sustainable system analytics, and data-driven decision making.
Muntasir Billah
AHM Muntasir Billah is an assistant professor in The Department of Civil Engineering at the University of Calgary, Canada. He received his PhD in structural engineering from the University of British Columbia, Canada. His research is focused towards improving our understanding of the behaviour of civil infrastructures under various extreme load conditions. His research interests include performance-based seismic design and retrofit of bridges, application of high-performance materials, and multi hazard resilience of infrastructure.
Subhrajit Dutta
Subhrajit Dutta is an Assistant Professor in the Department of Civil Engineering at National Institute of Technology Silchar. He completed his Ph.D. in Civil Engineering from Indian Institute of Technology Bombay in 2017. He has received a sponsored research grant amount of around 2.5 crores INR, and is involved in significant consulting work. He has published more than 50 international journal papers till date. Subhrajit’s research group is currently working on areas like, probabilistic structural mechanics, system reliability/risk analysis, uncertainty quantification, structural optimization under uncertainty, structure & infrastructure resilience, AI/ML in structural engineering, to mention a few. He is also serving as an Editor, Guest Editor for various prestigious journals.
References
- Andrić, J. M., & Lu, D. G. (2017). Fuzzy methods for prediction of seismic resilience of bridges. International Journal of Disaster Risk Reduction, 22(December), 458–468. https://doi.org/10.1016/j.ijdrr.2017.01.001
- Argyroudis, S., Hofer, L., Zanini, M. A., & Mitoulis, S. A. (2019). Resilience of critical infrastructure for multiple hazards: Case study on a highway bridge. Proceedings of the International Conference on Natural Hazards and Infrastructure, July.
- Argyroudis, S. A., Mitoulis, S. A., Hofer, L., Zanini, M. A., Tubaldi, E., & Frangopol, D. M. (2020). Resilience assessment framework for critical infrastructure in a multi-hazard environment: Case study on transport assets. Science of the Total Environment, 714, 136854. https://doi.org/10.1016/j.scitotenv.2020.136854
- Argyroudis, S. A., Nasiopoulos, G., Mantadakis, N., & Mitoulis, S. A. (2021). Cost-based resilience assessment of bridges subjected to earthquakes. International Journal of Disaster Resilience in the Built Environment, 12(2), 209–222. https://doi.org/10.1108/IJDRBE-02-2020-0014
- ASCE. (2021). A comprehensive assessment of America’s infrastructure. Asce, 2021(2021 Infrastructure Report Card), 111.
- Attoh-Okine, N. O., Cooper, A. T., & Mensah, S. A. (2009). Formulation of resilience index of urban infrastructure using belief functions. IEEE Systems Journal, 3(2), 147–153. https://doi.org/10.1109/JSYST.2009.2019148
- Azevedo, S. G., Govindan, K., Carvalho, H., & Cruz-machado, V. (2013). Ecosilient index to assess the greenness and resilience of the upstream automotive supply chain. Journal of Cleaner Production, 56, 131–146. https://doi.org/10.1016/j.jclepro.2012.04.011
- Bai, H., Sadiq, R., Najjaran, H., & Rajani, B. (2008). Condition assessment of buried pipes using hierarchical evidential reasoning model. Journal of Computing in Civil Engineering, 22(2), 114–122. https://doi.org/10.1061/(asce)0887-3801(2008)22:2(114)
- Beheshtian, A., Donaghy, K. P., Gao, H. O., Safaie, S., & Geddes, R. (2017). Impacts and implications of climatic extremes for resilience planning of transportation energy : A case study of New York city Impacts and implications of climatic extremes for resilience planning of transportation energy : A case study of New York city. Journal of Cleaner Production, 174(January 2018), 1299–1313. https://doi.org/10.1016/j.jclepro.2017.11.039
- Bocchini, P., Frangopol, D. M., Ummenhofer, T., & Zinke, T. (2014). Resilience and sustainability of civil infrastructure: toward a unified approach. Journal of Infrastructure Systems, 20(2), 04014004. https://doi.org/10.1061/(asce)is.1943-555x.0000177
- Bruneau, M., Chang, S. E., Eguchi, R. T., Lee, G. C., O’Rourke, T. D., Reinhorn, A. M., Shinozuka, M., Tierney, K., Wallace, W. A., & Von Winterfeldt, D. (2003). A framework to quantitatively assess and enhance the seismic resilience of communities. Earthquake Spectra, 19(4), 733–752. https://doi.org/10.1193/1.1623497
- Bruneau, M., Eeri, M., Reinhorn, A., & Eeri, M. 2007. Exploring the concept of seismic resilience for acute care facilities. Earthquake spectra, 23(1): 41–62. https://doi.org/10.1193/1.2431396
- Chang, L., Peng, F., Ouyang, Y., Elnashai, A. S., & Spencer, B. F. (2012). Bridge Seismic Retrofit Program Planning to Maximize Postearthquake Transportation Network Capacity. Journal of Infrastructure Systems, 18(2), 75–88. https://doi.org/10.1061/(asce)is.1943-555x.0000082
- Chen, Q., Whitbrook, A., Aickelin, U., & Roadknight, C. (2014). Data classification using the Dempster-Shafer method. Journal of Experimental and Theoretical Artificial Intelligence, 26(4), 493–517. https://doi.org/10.1080/0952813X.2014.886301
- ChienKuo, C., Eiki, Y., & Santoso, D. (2020). Seismic resilience analysis of a retrofit-required bridge considering moment-based system reliability. Structure and Infrastructure Engineering, 1–22. https://doi.org/10.1080/15732479.2020.1767658
- Cimellaro, G. P., & Reinhorn, A. M. (2010). SEI 2010 Cimellaro Reinhorn Bruneau.pdf. February. https://doi.org/10.1080/15732470802663847
- Cimellaro, G. P., Reinhorn, A. M., & Bruneau, M. (2010b). Seismic resilience of a hospital system. Structure and Infrastructure Engineering, 6(1–2), 127–144. https://doi.org/10.1080/15732470802663847
- Cimellaro, G. P., Renschler, C., Arendt, L., Bruneau, M., & Reinhorn, A. M. (2011). Community resilience index for road network systems. Proceedings of the 8th International Conference on Structural Dynamics, EURODYN 2011, July, 370–376.
- Cimellaro, G. P., Renschler, C., Reinhorn, A. M., & Arendt, L. (2016). PEOPLES: A framework for evaluating resilience. Journal of Structural Engineering, 142(10), 04016063. https://doi.org/10.1061/(asce)st.1943-541x.0001514
- CIRC. (2019). Canada infrastructure report card 2019. Canadian Infrustructure, 1–56. http://canadianinfrastructure.ca/en/about.html
- Dempster, A. P. (1967). Institute of mathematical statistics is collaborating with JSTOR to digitize, preserve, and extend access to The Annals of mathematical statistics, Annals of Mathematical Statistics, 38(2), 325–339. ®. www.jstor.org
- Dong, Y., & Frangopol, D. M. (2015). Risk and resilience assessment of bridges under mainshock and aftershocks incorporating uncertainties. Engineering Structures, 83, 198–208. https://doi.org/10.1016/j.engstruct.2014.10.050
- Ernst, L., Dinther, R. E. D. G., Peek, G. J., & Loorbach, D. A. (2016). Sustainable urban transformation and sustainability transitions ; conceptual framework and case study. Journal of Cleaner Production, 112, 2988–2999. https://doi.org/10.1016/j.jclepro.2015.10.136
- Gay, L. F., & Sinha, S. K. (2013). Resilience of civil infrastructure systems: Literature review for improved asset management. International Journal of Critical Infrastructures, 9(4), 330–350. https://doi.org/10.1504/IJCIS.2013.058172
- González, A. D., Barker, K., & Morshedlou, N. (2020). Protection-interdiction-restoration : Tri-level optimization for enhancing interdependent network resilience. Reliability Engineering & System Safety. Vol. 199 January https://doi.org/10.1016/j.ress.2020.106907
- Hosseini, S., Barker, K., & Ramirez-Marquez, J. E. (2016). A review of definitions and measures of system resilience. Reliability Engineering and System Safety, 145, 47–61. https://doi.org/10.1016/j.ress.2015.08.006
- Insurance Bureau of Canada. (2021). British Columbia floods cause $450 million in insured damage. 2021–2023. http://www.ibc.ca/bc/resources/media-centre/media-releases/british-columbia-floods-cause-450-million-in-insured-damage
- Ishibashi, K., Furuta, H., & Nakatsu, K. (2020). Bridge maintenance scheduling in consideration of resilience against natural disasters. Frontiers in Built Environment, 6, 574467. https://doi.org/10.3389/fbuil.2020.574467
- Kammouh, O., Gardoni, P., & Paolo, G. (2020). Probabilistic framework to evaluate the resilience of engineering systems using Bayesian and dynamic Bayesian networks. Reliability Engineering and System Safety, 198(January), 106813. https://doi.org/10.1016/j.ress.2020.106813
- Kaviani, P., Zareian, F., & Taciroglu, E. (2012). Seismic behavior of reinforced concrete bridges with skew-angled seat-type abutments. Engineering Structures, 45, 137–150. https://doi.org/10.1016/j.engstruct.2012.06.013
- Khan, M. S. A., Etonyeaku, L. C., Kabir, G., Billah, M., & Dutta, S. (2022). Bridge infrastructure resilience assessment against seismic hazard using bayesian best worst method. Canadian Journal of Civil Engineering. https://doi.org/10.1139/cjce-2021-0503
- Khan, M. S. A., Kabir, G., Billah, M., Dutta, S., Neto, L., Barros, R., & Ponte, C. (2022). Bridge infrastructure resilience analysis against seismic hazard using best-worst methods. ARP Rheumatology, 1(1), 95–109. https://doi.org/10.1007/978-3-030-89795-6_8
- Kilanitis, I., & Sextos, A. (2018, December). Impact of earthquake-induced bridge damage and time-evolving traffic demand on the road network resilience ScienceDirect Impact of earthquake-induced bridge damage and time evolving traffic demand on the road network resilience. Journal of Traffic and Transportation Engineering (English Edition), 6(1), 35-48. https://doi.org/10.1016/j.jtte.2018.07.002
- Laskar, J. I., Sen, M. K., Dutta, S., & Laskar, S. A. (2021). A Flood Resilience Analytics Framework for Housing Infrastructure Systems Based on Dempster–Shafer (Evidence) Theory. Journal of Performance of Constructed Facilities, 35(6), 04021073. https://doi.org/10.1061/(ASCE)CF.1943-5509.0001615
- Liu, H. C. (2016). FMEA using uncertainty theories and MCDM methods. FMEA Using Uncertainty Theories and MCDM Methods. Issue May 2016, pp. 13-27. https://doi.org/10.1007/978-981-10-1466-6
- Mahmoud, H., & Chulahwat, A. (2017). Spatial and temporal quantification of community resilience : gotham city under attack, Computer‐Aided Civil and Infrastructure Engineering, 33(5): 1–20. https://doi.org/10.1111/mice.12318
- Mcallister, T., Ph, D., & Asce, F. 2016. Research Needs for Developing a Risk-Informed Methodology for Community Resilience. Journal of Structural Engineering, 142(8): 1–10. https://doi.org/10.1061/(ASCE)ST.1943-541X.0001379
- Mebarki, A., Jerez, S., Prodhomme, G., & Reimeringer, M. (2016). Natural hazards, vulnerability and structural resilience: Tsunamis and industrial tanks. Geomatics, Natural Hazards and Risk, 7, 5–17. https://doi.org/10.1080/19475705.2016.1181458
- Minaie, E., Asce, M., & Moon, F. 2017. Practical and Simplified Approach for Quantifying Bridge Resilience. Journal of Infrastructure Systems, 23(2014): 1–11. https://doi.org/10.1061/(ASCE)IS.1943-555X.0000374
- Mitchell, D., Paultre, P., & Saatcioglu, M. (2010). Evolution of seismic design provisions in the National building code of Canada. September. https://doi.org/10.1139/L10-054
- Nair, S., Walkinshaw, N., Kelly, T., Luis, J., & Vara, D. (2015). An evidential reasoning approach for assessing confidence in safety evidence. 2015 IEEE 26th International Symposium on Software Reliability Engineering (ISSRE), 541–552.
- Nasiopoulos, G., Mantadakis, N., Pitilakis, D., Argyroudis, S., & Mitoulis, S. (2019). Resilience of bridges subjected to earthquakes: A case study on a portfolio of road bridges. Proceedings of the International Conference on Natural Hazards and Infrastructure, June.
- Nielson, B. G., & Desroches, R. (2007). Seismic fragility methodology for highway bridges using a component level approach. November, 823–839. https://doi.org/10.1002/eqe
- Okine, N., & Burden, L. (2005). Multimodal transportation facility resilience index. May, 1–74.
- Ouyang, M., & Wang, Z. (2015). Resilience assessment of interdependent infrastructure systems: With a focus on joint restoration modeling and analysis. Reliability Engineering and System Safety, 141, 74–82. https://doi.org/10.1016/j.ress.2015.03.011
- Patel, D. A., Lad, V. H., Chauhan, K. A., & Patel, K. A. (2020). Development of bridge resilience index using multicriteria decision-making techniques. Journal of Bridge Engineering, 25(10), 04020090. https://doi.org/10.1061/(asce)be.1943-5592.0001622
- Praxedes, C., Yuan, X. X., & He, X. H. C. (2020). A novel robustness index for progressive collapse analysis of structures considering the full risk spectrum of damage evolution. Structure and Infrastructure Engineering, 18(3), 376–394. https://doi.org/10.1080/15732479.2020.1851730
- Pucci, A., Puppio, M. L., Sousa, H. S., Giresini, L., Matos, J. C., & Sassu, M. (2021). Detour-impact index method and traffic gathering algorithm for assessing alternative paths of disrupted roads. Transportation Research Record: Journal of the Transportation Research Board, 2675(12), 717–729. https://doi.org/10.1177/03611981211031237
- Ramanathan, K., Padgett, J. E., & DesRoches, R. (2015). Temporal evolution of seismic fragility curves for concrete box-girder bridges in California. Engineering Structures, 97, 29–46. https://doi.org/10.1016/j.engstruct.2015.03.069
- Rezaei, J. (2016). Best-worst multi-criteria decision-making method : Some properties and a linear model. Omega, 64, 126–130. https://doi.org/10.1016/j.omega.2015.12.001
- Sen, M. K., Dutta, S., & Kabir, G. (2021a). Development of flood resilience framework for housing infrastructure system: Integration of best-worst method with evidence theory. Journal of Cleaner Production, 290(1), 125197. https://doi.org/10.1016/j.jclepro.2020.125197
- Sen, M. K., Dutta, S., & Kabir, G. (2021b). Evaluation of interaction between housing infrastructure resilience factors against flood hazard based on rough DEMATEL approach. International Journal of Disaster Resilience in the Built Environment, 12(5), 555–575. https://doi.org/10.1108/IJDRBE-08-2020-0089
- Sen, M. K., Dutta, S., Kabir, G., Pujari, N. N., & Laskar, S. A. (2021). An integrated approach for modelling and quantifying housing infrastructure resilience against flood hazard. Journal of Cleaner Production, 288, 125526. https://doi.org/10.1016/j.jclepro.2020.125526
- Shafer, G. (1976). Book reviews. A Mathematical Theory of Evidence, 83(4), 667–672.
- Sharma, N., Tabandeh, A., & Gardoni, P. (2018). Resilience analysis: A mathematical formulation to model resilience of engineering systems. Sustainable and Resilient Infrastructure, 3(2), 49–67. https://doi.org/10.1080/23789689.2017.1345257
- Shekhar, S., Ghosh, J., & Ghosh, S. (2020). Impact of design code evolution on failure mechanism and seismic fragility of highway bridge piers. Journal of Bridge Engineering, 25(2), 04019140. https://doi.org/10.1061/(asce)be.1943-5592.0001518
- Sierra, L. A., Yepes, V., & Pellicer, E. (2018). A review of multi-criteria assessment of the social sustainability of infrastructures. Journal of Cleaner Production, 187, 496–513. https://doi.org/10.1016/j.jclepro.2018.03.022
- Sun, W., Bocchini, P., & Davison, B. D. (2020). Resilience metrics and measurement methods for transportation infrastructure: The state of the art. Sustainable and Resilient Infrastructure, 5(3), 168–199. https://doi.org/10.1080/23789689.2018.1448663
- Tang, J., Heinimann, H., Han, K., Luo, H., & Zhong, B. (2020). Evaluating resilience in urban transportation systems for sustainability: A systems-based Bayesian network model. Transportation Research Part C: Emerging Technologies, 121(August 2019), 102840. https://doi.org/10.1016/j.trc.2020.102840
- Tavares, D. H., Padgett, J. E., & Paultre, P. (2012). Fragility curves of typical as-built highway bridges in eastern Canada. Engineering Structures, 40, 107–118. https://doi.org/10.1016/j.engstruct.2012.02.019
- Taylor, P., Bolar, A., Tesfamariam, S., & Sadiq, R. (2013). Structure and infrastructure engineering : maintenance, management, life-cycle design and performance condition assessment for bridges : A hierarchical evidential reasoning (HER) framework. March, 37–41.
- Twumasi-Boakye, R., & Sobanjo, J. O. (2018). Resilience of regional transportation networks subjected to hazard-induced bridge damages. Journal of Transportation Engineering, Part A: Systems, 144(10), 04018062. https://doi.org/10.1061/jtepbs.0000186
- van Eck, N. J., & Waltman, L. (2010). Software survey: VOSviewer, a computer program for bibliometric mapping. Scientometrics, 84(2), 523–538. https://doi.org/10.1007/s11192-009-0146-3
- Vishwanath, B. S., & Banerjee, S. (2019). Life-cycle resilience of aging bridges under earthquakes. Journal of Bridge Engineering, 24(11), 04019106. https://doi.org/10.1061/(asce)be.1943-5592.0001491
- Vishwanath, B. S., & Banerjee, S. (2019). Life-Cycle Resilience of Aging Bridges under Earthquakes. Journal of Bridge Engineering, 24(11), 04019106. https://doi.org/10.1061/(ASCE)BE.1943-5592.0001491
- Zhang, W., & Wang, N. (2016). Resilience-based risk mitigation for road networks. Structural Safety, 62, 57–65. https://doi.org/10.1016/j.strusafe.2016.06.003
- Zhang, Z., & Wei, -H.-H. (2021). Modeling interaction of emergency inspection routing and restoration scheduling for postdisaster resilience of highway–bridge networks. Journal of Infrastructure Systems, 27(1), 04020046. https://doi.org/10.1061/(asce)is.1943-555x.0000592
- Zheng, Y., Dong, Y., & Li, Y. (2018). Resilience and life-cycle performance of smart bridges with shape memory alloy (SMA)-cable-based bearings. Construction and Building Materials, 158, 389–400. https://doi.org/10.1016/j.conbuildmat.2017.10.031