
ABSTRACT
This is the second of two papers that study the economics of long-duration, widespread electric power interruptions (LDWIs) caused by extreme weather events in the U.S.A., and how utilities and regulators are evaluating measures to reduce the vulnerability of electricity infrastructure to such disruptions. In this paper, we review case studies of five jurisdictions in different U.S. states that experienced LDWIs over the past two decades, examining how these events have influenced utilities’ and regulators’ approaches to strengthening electricity infrastructure against potential future interruptions. We find that (i) most of the utilities do not estimate economic benefits of large-scale storm-hardening and other measures in terms of either avoided customer costs or regional economic impacts; (ii) the concept of ‘resilience’ plays little practical role in this type of decision-making; and (iii) institutional factors have a major influence on whether and how the economic benefits of storm-hardening and related measures are evaluated.
1. Introduction
The risks of long-duration, widespread interruptions (LDWIs) in electrical power are a growing concern for U.S. regulators, the electric power industry, and other stakeholders. In order to make sound decisions on potentially large investments to prevent these interruptions or reduce their severity, decision-makers must perform economic analysis of their costs and the outcomes they will provide in terms of risk reduction. This is the second of two papers on how utilities and regulators have dealt with this problem at the electricity distribution system level. This paper addresses the following three questions:
How do utilities or others estimate the costs and benefits of investments to reduce power system vulnerabilities to future extreme weather events?
How do utilities and regulators use the concept of resilience in estimating the economic value of investments to prevent or mitigate the severity of LDWIs?
How do regulatory processes and other institutional factors influence utilities’ economic analysis of power interruptions?
In Part I, we provided a general overview of resilience and reliability considerations related to electricity system infrastructure vulnerabilities to extreme weather. We described cost-effectiveness analysis (CEA) and cost–benefit analysis (CBA) methods for evaluating investments to reduce these vulnerabilities, the types of economic information needed to estimate their value, and gaps in the availability of such information.
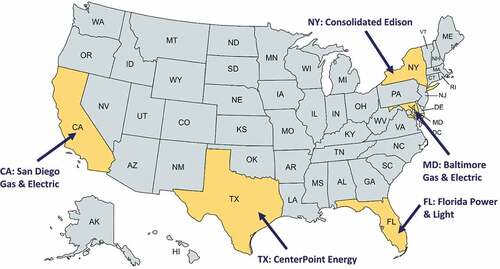
In this paper, we present five case studies of how utilities and regulators have addressed these issues in practice. Specifically, in each case, we describe how LDWIs caused by extreme weather changed regulatory processes and regulations regarding utilities’ preparations and planning for future such events, the economic data and methods used in these activities, and the extent to which the idea of resilience guided or influenced these efforts overall. We investigate whether utilities conduct CEA or CBA when evaluating potential storm-hardening projects, and what units they use to capture benefits (e.g., dollars if true CBA, various reliability metrics if CEA). We aim to identify common barriers to broader application of CBA, related to the availability of suitable methods and data. Each case study examines a particular U.S. state, electric utility, and its regulator, which are listed in .Footnote1 The results of this case study-based analysis are particularly useful for policymakers, utility planners, and other stakeholders. A general lack of economics-related information used to justify future investments in resilience signals to stakeholders that this type of information needs to be developed further and incorporated explicitly into existing decision-making processes. Consider a utility that is proposing a major initiative to underground power lines throughout its service territory. The capital and operations and maintenance (O&M) costs of undergrounding are well understood, but the resilience-related economic benefits (e.g., avoided power disruption costs) of this strategy have not always been included in the decision-making process – despite a clear need (Larsen, Citation2016a).
Table 1. Case study information.
This paper is organized as follows. Section 2 summarizes our case study methodology, including the sources we analyze. Sections 3 through 7 present our five case studies. Each of these sections offers background information on the utility, regulator, and precipitating extreme weather event and goes on to describe methods and data used for valuing investments to reduce vulnerability to extreme weather events, the state regulatory context, and the role of resilience. We conclude in Section 8 with a summary of findings and a discussion of their policy implications.
2. Methodology
We choose the five case studies outlined in and depicted on the map in primarily due to their diversity. The five cases span wide ranges of geographical locations, extreme weather types, regulatory environments, and utility practices. These five cases are not a random sample and do not perfectly represent all U.S. states, electric utilities, and regulators. Our choice to review these specific utilities was driven by (1) a history of recent extreme weather events that have significantly impacted these territories (e.g., Tropical Storm Sandy) and (2) an extensive and publicly-available regulatory record before, during, and after the extreme weather event. In addition, we were guided in part by our familiarity with particular utilities, regulators, and practices. For example, LaCommare et al. (Citation2017) interview public utility commission staff in three jurisdictions including California and Florida (two of the cases in this paper) to explore how utility economic information on proposed investments in reliability and resilience is evaluated in the regulatory process. They found that a) regulators make little or no distinction between reliability and resilience in reviewing proposed projects; b) the costs of investments in reliability or resilience are well understood by utilities and regulators; c) the potential economic benefits of such investments are difficult to estimate; and d) both utilities and regulators need improved information on the costs that power interruptions impose on utility customers (which can be used in turn to estimate the economic benefits of investments). LaCommare et al. (Citation2017) also find that most utility requests for regulatory approval of the costs of reliability-resilience investments are made and assessed in proceedings around general utility rate cases, as opposed to being addressed in special processes focused on ‘resilience.’ The examples investigated in these case studies build on this work, with the aim of better understanding how different utilities and regulators assess costs and benefits of investments to prevent or mitigate LDWIs.
Figure 1. Map of case studies jurisdictions and utilities.
The source documents that we analyze to carry out our five case studies include filings and documents from the online regulatory archives of state public utility commissions; reports by state government agencies, consulting companies, and other organizations; and the academic literature.Footnote2
The processes involved can be quite complex. The core regulatory activity for investor-owned utilities is the general rate case, which determines electricity rates, charges, and utilities’ returns on equity (Lazar, Citation2016). Rate cases are also the primary mechanism for regulators evaluating and approving or disapproving utilities’ proposed investments in storm-hardening of distribution infrastructure. However, there can also be other types of proceedings pertaining to extreme weather impacts, such as investigations of utility responses to previous events and ‘rulemakings’ to develop new rules, regulations, and procedures to improve utilities’ practices for preventing or mitigating future LDWIs.
3. Florida case study
3.1. Utility, regulator, and precipitating event
Florida Power & Light (FPL) is the largest utility in the state of Florida. Incorporated in 1925, it is regulated by the Florida Public Service Commission (FPSC) and serves 10 million customers. By virtue of its location, the state of Florida is exposed to tropical storms and hurricanes, so electric utilities operating in this region have significant experience in coping with these weather events. Over the past several decades, hurricane severity and coastal-area population and economic development have increased. Consequently, both the physical impacts of these hurricanes and the economic impacts of associated power interruptions have become more severe. Hurricane Andrew (1992) was the first Category 5 storm to hit the state since 1935. Subsequently, in the 2004–2005 seasons, one Category 4 and four Category 3 hurricanes made landfall in Florida (see ).Footnote3
Figure 2. Hurricane Frances making landfall in Florida in 2004 (Wikimedia Commons, Citation2004).
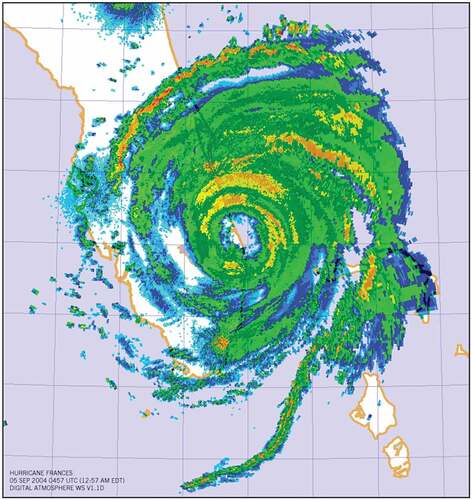
The 2005 hurricanes were especially severe and damaging. Hurricane Katrina on August 25–26 interrupted power across 15 counties in FPL’s service territory, affecting 1.5 million – about one-third – of FPL’s customers. Power was restored to 77% of customers by the third day following the storm, 95% by the fifth day, and all customers by the eighth. Hurricane Wilma hit Florida on October 25, and interrupted power to more than 3 million – 75% – of FPL’s customers across 21 counties. In Miami-Dade, Broward, and Palm Beach counties, 91% of customers lost power. At the time, this was the most damaging storm in the utility’s history, affecting power plants, transmission lines, and substations, as well as distribution facilities. Power was restored to more than 1 million customers by the third day after the storm, 2 million by the fifth day, 3 million by the thirteenth, and all customers by the eighteenth.
3.2. Regulatory and policy responses
The physical and economic impacts of the 2004–2005 hurricane seasons prompted a comprehensive re-evaluation of utility rules and practices in Florida, including both the engineering and economic aspects of hurricane preparation and response. This response was an effort by multiple stakeholders, including the FPSC, FPL (and other utilities), state legislature, private sector, universities, and utility customers. Between 2005 and 2007, proposals were developed to update utility operations and planning, applicable regulations and laws, and procedures for recovering from severe storms and preparing for future ones. Following an extensive review, the FPSC adopted recommendations based on these proposals in 2006, and the state legislature concurrently passed new legislation pertaining to storm hardening and cost recovery (Florida Public Service Commission (FPSC), Citation2005, Florida Public Service Commission (FPSC), Citation2006, Florida Public Service Commission (FPSC), Citation2007a, and Florida Public Service Commission (FPSC), Citation2007b, Florida Administrative Code (FAC), Citation2006a, and Florida Administrative Code (FAC), Citation2006b).
3.3. Economic analysis of investments to reduce power system vulnerabilities to future extreme weather events
Since 2006, FPL and other Florida utilities have been required to develop and submit detailed storm-hardening plans for FPSC review on a 3-year cycle, under stricter storm-hardening standards for both their infrastructure and their maintenance, including ongoing vegetation clearing and wooden utility pole inspection and replacement. Utility-proposed storm-hardening measures and actions must be ‘cost-effective’ and utility plans must include ‘an estimate of the costs and benefits to the utility … of making the electric infrastructure improvements, including the effect on reducing storm restoration costs and customer outages.’ Along with the proposed engineering-related measures, FPL’s triennial storm-hardening plans include estimates of the expenditures needed to implement them (Florida Power & Light Company (FPL), Citation2007, Florida Power & Light Company (FPL), Citation2010, Florida Power & Light Company (FPL), Citation2013, and Florida Power & Light Company (FPL), Citation2016a). The utility has provided qualitative descriptions of customer benefits, and plans have also stated that the proposed hardening measures will yield customer benefits in the form of reduced numbers and durations of outages, but has acknowledged that it cannot assign monetary value to these benefits – i.e., avoided costs – due to a lack of information. In each of (Florida Power & Light Company (FPL), Citation2007, Florida Power & Light Company (FPL), Citation2010, Florida Power & Light Company (FPL), Citation2013, and Florida Power & Light Company (FPL), Citation2016a) storm-hardening plans, it stated that, ‘While there are clear benefits from FPL’s storm-hardening and preparedness initiatives, it still remains nearly impossible at this time to estimate the full extent of the benefits with any precision.’Footnote4
Since 2006, FPSC has accepted that the absence of data precludes quantitative estimation of customer benefits from storm preparation, and has approved FPL’s actions on the basis of technical soundness, cost-effectiveness, and compliance with regulatory requirements.
Following the severe impacts of Hurricanes Michael and Irma in 2017–2018, FPSC engaged its regulated utilities and others in assessing the benefits of storm-hardening efforts over the preceding decade in terms of reduced damage to electricity infrastructure and reduced numbers and durations of power interruptions (Florida Public Service Commission (FPSC), Citation2018). Although a formal CBA was not conducted, it was found that the performance of the system was substantially improved compared to performance during previous severe hurricanes. At the same time, FPSC staff recommended that, from then on, utilities be required to explicitly compare the effects, costs, and benefits of storm-hardening measures vs. storm restoration actions. In 2019, the Florida state legislature passed legislation stipulating, among other things, that storm protection plans must consider ‘the estimated costs and benefits to the utility and its customers of making the improvements proposed in the plan.’ Section 25–6.030 states that these plans must include ‘A comparison of [these] costs … and the benefits [of reductions in outage times and restoration costs].’Footnote5 However, the law does not state how these benefits should be quantified.
In its March 2019 petition to FPSC for approval of its 2019–2021 storm-hardening plan, FPL used language identical to that used in previous plans, to the effect that the utility is unable to quantify customer benefits of proposed investments and measures and compare them directly to cost (Florida Power & Light Company (FPL), Citation2019). FPL again conducted a cost-effectiveness analysis using the net present value of long-run restoration cost savings from broad categories of storm hardening measures (though not from individual projects).
3.4. Resilience in the regulatory environment
Because FPL is a regulated, investor-owned utility, all of its proposed measures and expenditures related to both storm hardening and storm cost recovery must be approved by FPSC. FPL requests approval of storm-hardening engineering plans and associated investments in dedicated dockets, with financial aspects of the plans proposed, evaluated, and decided upon by the FPSC in general rate cases where there are hearings on several dockets simultaneously. These regulatory processes are adversarial processes in which multiple stakeholders participate in addition to the regulators, their staff, and the utility (subject to approval of standing). Florida citizens and ratepayers are represented by the state’s Office of Public Counsel. Non-governmental organizations also participate in rate cases, as do groups representing different segments of industry, and private individuals. As a rule, most, but not all, non-utility participants oppose FPL’s financial requests for various reasons (see further details below). FPSC adjudicates this process and decides the merits of all parties’ opinions and proposals. In some cases, direct negotiations between FPL and other parties result in a compromise (called a ‘settlement’) that is proposed to the Commission. In all cases, the Commission makes the final, binding decision.
Although the term ‘resilience’ is sometimes mentioned informally in the regulatory record by FPL and other stakeholders, resilience per se is not formally recognized or used either as a concept or as an operational criterion by the utility or the regulator in Florida’s storm-hardening planning or storm impact analysis and recovery. Florida does not single out ‘resilience investments’ as a special category. Moreover, the agreed-upon metrics for measuring storm impacts are well understood by all parties and are specific physical and/or engineering quantities pertaining to electricity infrastructure; there are no special ‘resilience metrics,’ nor is there an apparent need for any. In addition, storm cost-recovery and the costs of storm hardening are considered separately in the regulatory process, rather than, for example, directly compared in order to estimate the relative costs and benefits of ex-ante hardening investments vs. ex-post recovery measures.
4. New York case study
4.1. Utility, regulator, and precipitating event
Consolidated Edison of New York, Inc. (Con Ed) is a regulated, investor-owned utility providing electricity, natural gas, and steam heat to New York City and Westchester County.Footnote6 Con Ed is regulated by the New York (state) Public Service Commission (NYPSC), which oversees the production, sale, and distribution of electricity, natural gas, and steam throughout New York State, and regulates rates for these energy services.Footnote7
Tropical Storm Sandy in October 2012 caused unprecedented storm surges and flooding in and around New York City (see ). In Lower Manhattan, the surge, or storm tide, was a record 14 feet (measured above the average low tide level). Nearly 20% of the city’s land area was flooded, exceeding the ‘100-year’ floodplain boundaries designated by the Federal Emergency Management Agency (FEMA) maps by nearly 50%.
Figure 3. Tropical storm Sandy wind speed probabilities (Fairfax Office of Emergency Management, Citation2012).
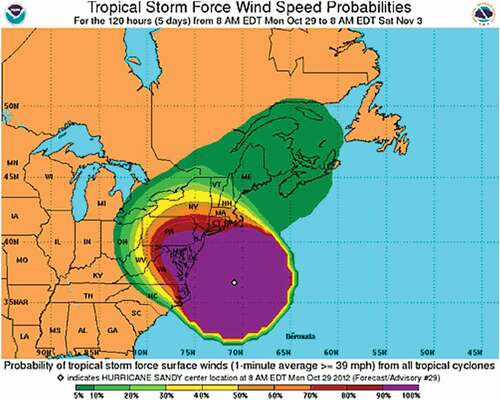
The resulting flooding shut down numerous substations and networks (see, Section 4.2 below). More than 2 million people lost power, including two-thirds of those served by overhead systems affected by wind and fallen-vegetation damage. Power was restored to 50% of affected customers within 3 days, 90% within 8 days, and all remaining customers who could accept service within 13 days (New York City (NYC), Citation2013, Chapter 6; Consolidated Edison Company of New York Inc. (Con Ed), Citation2013a).
4.2. Regulatory and policy responses
NYPSC and other agencies responded strongly and comprehensively to the impacts of Sandy and the manner in which Con Ed responded to and recovered from the storm. In the context of a Con Ed rate case in 2013, the NYPSC ordered the creation of a multi-stakeholder Collaborative to review the utility’s storm preparedness and storm-hardening proposals and the hardening design standards for the Con Ed system, study the possible incorporation of potential climate change impacts into these standards, and make recommendations related to these issues (Consolidated Edison Company of New York Inc, Citation2014, Con Ed, Citation2013). Over the following 3 years, the Collaborative undertook these activities, also studying risk analysis and CBA for resiliency projects (Consolidated Edison Company of New York Inc, Citation2015a; Consolidated Edison Company of New York Inc. (Con Ed), Citation2015b). The Collaborative’s recommendations were developed and negotiated by its members and filed with the NYPSC in December 2013 (Consolidated Edison Company of New York Inc, Citation2013). The NYPSC subsequently noted that ‘ … there is broad support among the parties for these capital investments that are intended to enhance the reliability and resiliency of Con Edison’s system’ (New York Public Service Commission (NYPSC), Citation2014). The Joint Proposal and subsequent recommendations of the Collaborative were intensively reviewed, discussed, and, as needed, amended, during Con Ed rate case proceedings, and adopted by the NYPSC with certain modifications in February 2014 (New York Public Service Commission (NYPSC), Citation2014, NYPSC, Citation2015, NYPSC, Citation2016).
Another outcome of this process was a climate-change vulnerability study to review relevant climate-change science, assess its implications for future extreme weather impacts on Con Ed’s system and design standards for mitigating them, and develop appropriate risk mitigation options. The study was conducted by Con Ed with the input and collaboration of a number of stakeholders and was completed in December 2019 (Consolidated Edison Company of New York Inc. (Con Ed), Citation2019). During this period, the City of New York government undertook extensive activities to assess and address the risks of climate change, including increasing the resilience of city facilities and critical infrastructure to the effects of sea-level rise.
4.3. Economic analysis of investments to reduce power system vulnerabilities to future extreme weather events
While New York State law has long required that Con Ed and other New York utilities have emergency response and restoration plans in place, Con Ed began developing more extensive plans to improve its storm preparedness immediately following Sandy (Consolidated Edison Company of New York Inc, Citation2013b). As we noted above, Con Ed’s overall resiliency plan was developed and proposed in collaboration with a multi-stakeholder group.
With the approval of this proposal, Con Ed undertook a multi-year effort to protect and harden its infrastructure through relocation and/or strengthening of equipment to prevent and mitigate flooding and wind damage, to mitigate severe storm impacts by increasing system flexibility through advanced control, and to promptly identify damaged parts of the system in order to facilitate restoration. The major new design and hardening criterion that was developed and adopted is a standard requiring that the Con Ed system be resilient to flooding based on FEMA’s one-percent annual flood hazard elevation (100-year floodplain) in the utility’s service territory plus a minimum additional three feet.
Con Ed and the collaborative parties proposed and developed appropriate levels of hardening improvement on a case-by-case basis for all system components, including substations, network distribution, overhead distribution, and generating equipment (as well as for the utility’s gas and steam infrastructure). Proposed measures were carefully reviewed by NYPSC staff and other stakeholders during the rate cases, amended as necessary, and ultimately decided upon by the Commission.
Con Ed evaluates the costs and benefits of potential resilience investments in a two-step procedure. First, it analyzes the risks of power interruptions caused by either flooding or wind as a function of (1) the number of customers affected by a power interruption, (2) the type of infrastructure or equipment affected, and (3) the duration of the interruption. Certain types of infrastructure are weighted to reflect the societal effects of power interruptions that would affect them: residential high-rise buildings, hospitals and public health facilities, public safety facilities, and other critical facilities. Individual projects are assigned ‘risk reduction priority scores’ and grouped, and capital requirements within each group. Con Ed then calculates the metric of risk reduction per $1,000 spent, which is a form of cost-effectiveness analysis.
Second, Con Ed conducts a CBA, for which the utility and a consultant developed avoided costs for investments based on value of reliability or lost load estimates developed by Nexant, Inc. and Berkeley Lab as part of the ICE Calculator project (Sullivan et al., Citation2009). Although these estimates were for power interruptions of a maximum of 8 hours, they extrapolated them to 290 hours (12 days). These VOLL estimates were then applied to the results of the risk prioritization analysis described above, to monetize the benefits of the potential resilience investments and to rank these investments in terms of cost–benefit ratios and differences.
During regulatory proceedings, it was noted that the ICE Calculator is not based on any customer interruption cost surveys from the northeastern U.S.A., including the New York region. A number of stakeholders suggested that Con Ed should develop new VOLL estimates for its own customers and service territory. However, the utility responded that undertaking a new customer interruption cost survey would be too costly. NYPSC, while recognizing the potential value of such estimates, was not convinced that the improvement in VOLL accuracy would justify the costs and did not order Con Ed to develop the new estimates.
Con Ed has not estimated the avoided regional economic impacts from investments in reliability/resilience. However, the City of New York has done so, using gross city product (GCP) – the city-scale equivalent of gross domestic product (GDP) – as the economic value metric. This analysis was part of a risk analysis of electric power outages caused by storm-induced flooding.
4.4. Resilience in the regulatory environment
As is the case in Florida, New York’s electric power regulation process is in part adversarial in the sense that all expenditures proposed by utilities are reviewed in public proceedings and carefully scrutinized – and in many cases opposed – by regulatory staff, other parts of the state government, and a number of other stakeholders. Opposition does not mean that decisions are simply impeded, but rather that multiple interests and perspectives are represented, and consensus is sought.
In contrast to Florida, Con Ed and NYPSC use resilience terminology in virtually all of their efforts and initiatives related to preparing for, and recovering from, extreme weather events. However, a close examination reveals that, as a rule, the investments and measures proposed and undertaken under this rubric are more extensive, advanced, and in many cases expensive, storm-hardening actions of types already known, rather than categorically different types of actions. A related point is that the appropriate resilience ‘metrics’ appear to have been essentially obvious from the outset. An example is enlarging the flood plain. Exactly how much it was to be expanded was a matter of debate. However, it was clear that the size – expressed in area – was the metric to be used. The record indicates that the debate was not over appropriate metrics but rather about different judgments regarding the appropriate level of risk tolerance that the utility should meet and the value of reducing risk.
5. Texas case study
5.1. Utility, regulator, and precipitating event
CenterPoint Energy (CPE) is a Houston-based utility providing electric services to more than 2.3 million metered customers via more than 69 retail electricity providers in a 5,000 square-mile territory covering most of the Houston/Galveston metropolitan area. CPE is regulated by the Public Utilities Commission of Texas (PUCT) under the Texas Administrative Code (TAC).
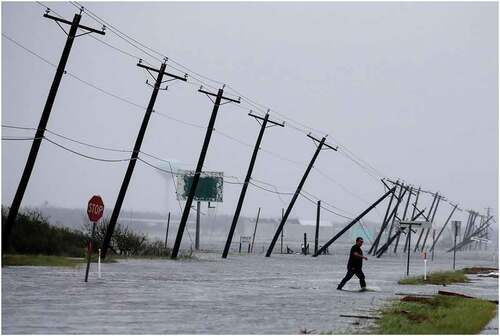
Hurricane Harvey made landfall along the central portion of the Texas Gulf Coast on 25 August 2017, after which it stalled with its center remaining over or near the Texas coast for 4 days. This led to steady and sustained rainfall that caused catastrophic flooding (see ). According to a report by the National Hurricane Center (NHC), Harvey was ‘the most significant tropical cyclone rainfall event in U.S. history, both in terms of scope and peak rainfall amounts, since reliable rainfall records began around the 1880s’ (National Hurricane Center, Citation2018). About 300,000 customers went without power during Hurricane Harvey and its aftermath (Governor’s Commission (Governor’s Commission to Rebuild Texas), Citation2018). Three days after Harvey made landfall, 100,000 CPE customers were without power. The utility restored service to almost all of its affected customers as of about 1 week later (Walker, Citation2017).
Figure 4. Distribution lines in Rockport, Texas following Hurricane Harvey (Reuters, Citation2017).
5.2. Regulatory and policy responses
Following Hurricanes Rita and Ike in the mid-2000s, the PUCT and the Texas state legislature initiated an extensive process of reviewing and improving the requirements for utility storm hardening and related activities and adopted new rules and regulations (Carey, Citation2014). Since 2010, Texas has required electric utilities to develop and implement detailed storm-hardening plans for cost-effective strategies to increase the ability of its transmission and distribution facilities to withstand extreme weather conditions (Texas Administrative Code (TAC), Citation2010). In response to Hurricane Harvey, the PUCT formed a working group to improve preparedness for future major weather events, comprising the Texas Department of Public Safety Division of Emergency Management, PUCT staff, and utilities. A report with recommendations was issued in July 2018 (Public Utility Commission of Texas (PUCT), Citation2018).
5.3. Economic analysis of investments to reduce power system vulnerabilities to future extreme weather events
Regarding activities to prepare for future storms, Texas utilities are subject to the Texas Administrative Code Section 25.95 regarding electric utility infrastructure storm hardening, which is defined as ‘all activities related to improved resiliency and restoration times, including but not limited to emergency planning, construction standards, vegetation management, or other actions before, during, or after extreme weather events’ (Texas Administrative Code (TAC), Citation2010). Section 25.95 requires that a utility’s storm-hardening plan be updated at least every 5 years and contains provisions including construction and maintenance standards for transmission and distribution poles, vegetation management, and targeted storm hardening for infrastructure serving priority loads. CPE submitted its first storm-hardening plan to the PUCT under these rules in April 2011 and has provided an annual summary of its implementation of the plan ever since. The initial plan provided a comprehensive response to the PUCT’s new storm-hardening requirements, addressing each requirement included in Section 25.95, and annual updates document the progress and implementation of these plans. There do not appear to be any discernible differences in CPE’s storm-hardening plans before and after Hurricane Harvey. CPE’s Storm-Hardening Plans and Emergency Operations Plan are detailed in numerous regulatory filings (CenterPoint Energy (CenterPoint), Citation2011, CenterPoint Energy (CenterPoint), Citation2012, CenterPoint Energy (CenterPoint), Citation2014, CenterPoint Energy (CenterPoint), Citation2015, and CenterPoint Energy (CenterPoint), Citation2016, and CenterPoint Energy (CenterPoint), Citation2017, and CenterPoint Energy (CenterPoint), Citation2019).
The aforementioned TAC 25.95 rule requires that utilities’ proposed storm-hardening plans include ‘cost-effective’ strategies. In response, starting with its initial storm-hardening plan in 2011 (CenterPoint Energy (CenterPoint), Citation2011), CPE has provided its substation planning criteria for a cost-effective, reliable design to accommodate changes in the electrical system load variances under several circumstances, as well as annual estimates for proactive tree trimming and hazard tree removal because falling trees and branches are a primary cause of damage and outages during an extreme storm.
In its annual summaries of its storm-hardening plans, CPE has not included detailed cost–benefit analysis or specified the methods it adopted to determine the cost-effectiveness of these programs. In a separate proceeding, CPE collaborated with the Electric Power Research Institute (EPRI) on a cost–benefit analysis of a ‘smart grid’ project that was included in its application for rate changes in 2019 (EPRI-CPE, Citation2014). The analysis used a business-as-usual automation base case and a pre-planned intelligent grid design to evaluate the costs and benefits of deploying a system-wide intelligent grid across CPE’s electric distribution system. Avoided cost information from Berkeley Lab’s ICE calculator was used to estimate the value of reliability improvement. In both scenarios, customers benefit from reduced interruptions, and these benefits consistently outweigh the investment costs.
Following Hurricane Ike, the PUCT in 2009 solicited CBA of potential interventions for improving electricity and telecommunications infrastructure to minimize long-term outages and restoration costs associated with Gulf Coast hurricanes. A consultant report used information including hurricane damage and cost data provided by utilities to evaluate the costs, utility benefits, and societal benefits of a variety of storm-hardening activities (Brown, Citation2009). Among its recommendations was the development of a resilience-based cost–benefit framework to evaluate storm-hardening programs. This recommendation has not been implemented.
Although we could not find any concrete evidence of CPE using avoided costs or VOLL estimates to quantify the benefits of storm hardening, VOLL estimates exist for the ERCOT system (e.g., London Economics International LLC (London Economics), Citation2013), and there is an example of VOLL being used in CBAs of undergrounding transmission and distribution lines across Texas (e.g., Larsen, Citation2016b). Larsen (Citation2016b) conducted an ex-ante CBA of a hypothetical mandate by the PUCT to underground all overhead transmission and distribution lines when they reach the end of their useful life. This study found that this undergrounding mandate would lead to large net social losses (costs exceeding the benefits) but that targeted undergrounding initiatives could result in net social benefits.
A report prepared for the Electric Reliability Council of Texas (ERCOT) estimated average VOLLs for industrial, commercial, and residential customers ‘in a developed industrial economy’ (London Economics International LLC (London Economics), Citation2013). ERCOT uses the $9,000/MWh VOLL estimate as the system-wide offer cap in its energy-only electricity market, which sets the maximum market price during scarcity pricing periods (Electric Reliability Council of Texas (ERCOT), Citation2016). However, despite having VOLL estimates available, CPE does not appear to use them in cost–benefit analyses submitted to the PUCT.
We could not identify direct or indirect economy-wide impacts of power interruptions reported by the utility or the public utility commission related to Hurricane Harvey, nor the use of economic modeling methods to estimate regional economy-wide benefits of storm hardening investments.Footnote8
5.4. Resilience in the regulatory environment
Stakeholders in addition to the utility and the PUCT, such as cities, are involved in the types of regulatory proceedings we have discussed. The outcomes of such proceedings affect the cost of transmission service rates, which are paid by ratepayers located within ERCOT. In addition, cities are actually required to participate in the proceedings as noted in Public Utility Regulatory Act Section 33.025.
Regulatory and utility documents specifically refer to ‘resilience,’ but not extensively, and CPE does not formally define this term. The PUCT uses the Federal Energy Regulatory Commission’s definition of ‘the ability to withstand or recover from some disturbance,’ applied in this case specifically in reference to storm hardening. CPE filed multiple storm-hardening plans beyond the framework required by the PUCT for enhancing the system’s ability to respond to future extreme events in terms of the National Electrical Safety Code (NESC), but the NESC itself does not mention the term ‘resilience’ (Institute of Electrical and Electronics Engineers (IEEE), Citation2017). It appears that CPE’s storm-hardening plans follow the standards laid out by Section 25.95 and conform to NESC requirements.
6. California case study
6.1. Utility, regulator, and precipitating event
The San Diego Gas & Electric Company (SDG&E) is an IOU serving more than 3.5 million customers in San Diego and southern Orange counties, a service territory of more than 4,000 square miles. SDG&E is regulated by the California Public Utilities Commission (CPUC), which determines rates for electricity and natural gas provided by private utilities in California, as well as rules and regulations pertaining to reliability, environmental aspects of energy production, distribution, and consumption, along with other matters. In addition, the state legislature and other government agencies, including the California Energy Commission, have long played a very active role in energy and environmental policy and technical issues, including those involving electric utilities.
Throughout the twentieth century, California experienced destructive fires at ‘wildland-urban interfaces’ (see ), areas where residential housing is built in or near wildland vegetation (Radeloff et al., Citation2018). The state’s vulnerability to such fires continues to increase because of factors including continued human development in fire zones, forest management practices (particularly in Northern California), and a changing climate.Footnote9 15 of the 20 most destructive California wildfires of the past century have occurred since 2000 (California Department of Forestry and Fire Protection (CAL FIRE), Citation2019a,b).
Figure 5. Example of a fire in the San Diego County wildland-urban interface (San Diego Union-Tribune, 2013).
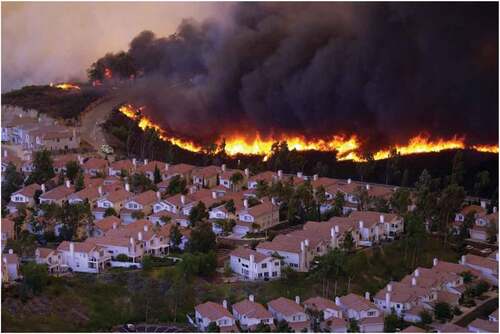
A number of destructive wildfires occurred in Southern California in October 2007 driven by an unusually severe occurrence of Santa Ana winds, which are hot, dry, gusty winds originating in the east (Kalansky et al., Citation2018). These fires burned more than 500,000 acres, destroyed more than 3,000 homes and other buildings, and resulted in 17 deaths (California Department of Forestry and Fire Protection (CAL FIRE) et al., Citation2009). In the SDG&E service territory, the so-called Witch Fire burned nearly 200,000 acres, destroyed more than 1,500 structures, and caused two deaths (California Department of Forestry and Fire Protection (CAL FIRE), Citation2019b). The Witch and several other severe October 2007 fires were subsequently determined to have been caused by electric power lines. Moreover, for the first time in the state’s history, the costs of these fires exceeded the utility’s insurance liability coverage.Footnote10 The incidence of catastrophic wildfires in California has increased even further since that time.Footnote11
6.2. Regulatory and policy responses
This case study differs from the others in this paper in that the human, physical, and economic impacts of the precipitating events were not from the resulting power outages but instead from damage caused by the utility’s infrastructure. As we describe below, the 2007 fires resulted in significant regulatory activity and changes to the ways in which SDG&E and other California utilities manage wildfire risks, a process broadly parallel to the storm-hardening and resilience processes in the other states studied in this paper. However, the economic issues are somewhat different.
California has had detailed regulations on the construction and maintenance of overhead power lines since the early twentieth century, including safety aspects. Since the 2007 fires, the CPUC has made a long-term, aggressive effort to improve fire safety on the part of the state’s regulated electric utilities by reducing the fire-related risks associated with overhead power lines and other electricity infrastructure (California Public Utilities Commission (CPUC), Citation2008). This effort has entailed extensive technical reviews and analyses of the utilities’ fire hazards and risks, in regulatory proceedings that have included the IOUs, Commission staff, consumer groups, independent consultants, and other stakeholder representatives.
Drawing on the results and recommendations of such work, the CPUC has made intensive and extensive changes to the technical and operational requirements for California utilities’ management and mitigation of wildfire risk, and implementation in practice, that are still unfolding ‘ … including hardening and modernizing its infrastructure with improved engineering, system design, standards, equipment, and facilities, such as undergrounding, insulation of distribution wires, and pole replacement.’ There are now much more stringent regulations dealing with how regulated California electric utilities anticipate and minimize wildfire risks, and effectively respond to wildfire emergencies when they occur. Moreover, following the extremely destructive fires in Northern California in July 2018, the state government enacted legislation containing a number of provisions pertaining to electric utilities that even further expanded and strengthened the requirements for their wildfire prevention and mitigation planning and rules on criteria for cost recovery following fires (California Senate Bill 901, Citation2018).
6.3. Economic analysis of investments to reduce power system vulnerabilities to future extreme weather events
SDG&E’s recent wildfire prevention and mitigation plans reflect the new regulations. SDG&E’s 2020 wildfire plan (San Diego Gas & Electric Company (SDG&E, Citation2020) includes a procedure for assessing wildfire risk in terms of safety, reliability, and financial aspects. Prospective wildfire mitigation measures are then evaluated in terms of how much they could be expected to reduce this risk. This reduction divided by the cost of the measure is called the ‘risk-spend efficiency.’ The ‘benefits’ of different investments are defined as their risk-spend efficiencies, which are used to rank and compare the investments. Along the financial dimension, potential risk attributes include possible property damage or loss of life from a wildfire event. In a recent report on its risk-management methods and practices, SDG&E also states that avoided cost information from Berkeley Lab (Sullivan et al., Citation2009) was ‘used as a guide’ to estimating economic costs to customers due to power interruptions but does not explain precisely how this information was used – what ‘used as a guide’ means.
This use of risk-spend efficiencies as described above can be considered a form of cost-effectiveness, rather than cost–benefit, analysis. Notwithstanding California utilities’ use of such techniques, the California Public Utilities Commission (CPUC; Citation2019) has stated that ‘ … the [utilities] did not provide firm estimates of [their] costs and savings associated with [implementing the new wildfire mitigation rules]. We conclude that a net increase in costs, if any, will be more than offset by the substantial public-safety benefits from [the rules].’ A recent report by the CPUC stated that there are ‘ … a multitude of reasons why a traditional cost–benefit analysis is not feasible, primarily because there is no agreed upon or widely accepted cost-avoidance model that could be applied to catastrophic utility-caused wildfires’ (CPUC and California Public Utilities Commission and California Department of Forestry and Fire Protection (CPUC and CALFIRE), Citation2018).
We also note that while there may have been studies of the impacts of the 2007 wildfires on the San Diego or Southern California regional economy, we found no studies of the broader economic impacts of the resulting power interruptions per se.
6.4. Resilience in the regulatory environment
As noted earlier, this case study differs from the others in this paper in the nature of the event and its consequences, although it parallels the other case studies in illustrating the centrality of regulatory processes and their adversarial nature in wildfire prevention and other proceedings. California’s processes and procedures for electric utility policy and regulation are in general quite complex, and wildfire risk management is no exception. The chronology we summarized above has entailed rulemakings, which develop solutions to particular regulatory problems (such as setting standards for wildfire prevention); investigations, which examine particular events, such as the causes of a specific wildfire; applications, in which the Commission reviews and decides upon utilities’ proposals for, e.g., wildfire prevention plans; and general rate cases, in which specific expenditures to implement those plans are reviewed and adjudicated. The Commission has a large staff and includes a Safety and Enforcement Division, which provides technical expertise, and an Office of Ratepayer Advocates, which represents the interests of utility customers.
The adversarial nature of the regulatory process is illustrated by the fact that general rate cases begin with a utility filing its rate application with the Office of Ratepayer Advocates, which is charged with representing ratepayers, whose interests are usually seen as differing considerably from those of the utilities and their shareholders. After the initial filing, stakeholders and interested parties can and do participate in the proceedings (as well as in rulemakings, investigations, and applications). There is an interesting parallel between the California process and the New York process following storm Sandy, in that numerous issues disputed by the utilities and the counter-parties are ultimately resolved through ‘settlement agreements’ negotiated between them, and proposed solutions are submitted to the full CPUC for decision. The subjects of these negotiations can be highly technical and often draw upon significant expertise outside the utilities themselves.
‘Resilience’ or ‘resiliency’ are mentioned very seldom and are not discussed in the regulatory records and documents that we reviewed for this case study.
7. Maryland case study
7.1. Utility, regulator, and precipitating event
Baltimore Gas and Electric (BGE) is the largest gas and electricity provider in Maryland. It delivers power to 1.3 million customers in a service territory that covers 2,300 square miles, including the City of Baltimore and all or parts of 10 central Maryland counties. BGE is regulated by the Maryland Public Service Commission (MDPSC). As a result of deregulation, BGE is a transmission and distribution utility that does not own generation. It is part of the PJM Interconnection, which operates the transmission network and competitive wholesale electricity market that cover Maryland and a number of other mid-Atlantic and Midwest states. The Maryland Energy Administration (MEA), a state government office, plays a significant role in promoting ‘affordable, reliant and cleaner’ energy for the state of Maryland.
A derecho is a storm with sustained winds in excess of 58 mph traveling in one direction along a relatively straight line, with wind gusts sometimes topping 100 mph (Maryland Public Service Commission, Citation2013). On 29 June 2012, a major derecho traveled 700 miles and impacted the Ohio Valley, 10 mid-Atlantic states, and Washington, D.C. In all, more than 4 million customers were left without power. The average BGE customer experienced a 37.5-hour outage and all restoration work was completed in 8.5 days. The region was already affected by a heat wave when the derecho struck, and the resulting power disruptions exacerbated the consequences of the heat wave. In total, 47 fatalities were attributed to the combination of the derecho and heat wave (National Oceanic and Atmospheric Administration (NOAA), Citation2013).
7.2. Policy and regulatory response
Section 20.50.07.06 of the Code of Maryland Regulations (COMAR) requires each utility to submit an annual reliability report to MDPSC. For storm reporting, COMAR 20.50.12.13 requires a utility to file a written report with MDPSC within 3 weeks of the end of a major outage event (Code of Maryland Regulations (COMAR), Citation2019). In addition, shortly after the June derecho, on 6 July 2012, MDPSC initiated a comprehensive evaluation of utilities’ preparedness for and responses to the storm, which was included in a case titled ‘In the Matter of the Electric Service Interruptions in the State of Maryland Due to the 29 June 2012 Derecho Storm’ (Case No. 9298). Then, on 25 July 2012, Executive Order 01.01.2012.15 directed the State Energy Advisor, together with other agencies including MEA, to solicit expert recommendations on improving the resiliency and reliability of Maryland’s electricity distribution system. The Grid Resiliency Task Force was formed, featuring almost 50 experts from around the country. The Task Force primarily evaluated the effectiveness and feasibility of undergrounding power lines, other options for infrastructure investments to improve grid resiliency, and options for financing and cost recovery for capital investment. On 25 October 2012, the Task Force issued its Weathering the Storm report, which included 11 recommendations (Grid Resiliency Task Force, Citation2012). One of these recommendations was to implement a ratemaking structure that aligns customer and utility incentives by rewarding reliability that exceeds established reliability metrics and penalizes failure to meet those metrics.
7.3. Economic analysis of investments to reduce power system vulnerabilities to future extreme weather events
The Grid Resiliency Task Force formed via executive order estimated customer power interruption costs by applying Berkeley Lab’s value of lost load (VOLL) estimates (Sullivan et al., Citation2015). The June derecho cost BGE residential customers roughly $321 million due to lost load, which is more than half of the $594 million total outage cost borne by residential customers of all Maryland utilities. It is interesting to note that the estimated customer interruption costs are several times greater than the total cost incurred by BGE to respond to the derecho and repair the physical damage to electric infrastructure. The Task Force also calculated analogous cost estimates for two previous storms: ‘Snowmaggedon’ and Hurricane Irene. The total cost of lost load as a result of all three storms was $519 for the average BGE customer compared to $455 for the average Maryland customer.
BGE proposed a 5-year plan called the Electric Reliability Investment (ERI) initiative to enhance its system reliability in response to MDPSC’s order in the derecho case. It included eight programs and compared each program’s investment costs to its reliability benefits, measured as percentage improvements in metrics such as avoided customer interruptions (ACI) and avoided customer minutes of interruption (ACMI). While BGE refers to its analyses as CBAs, this is a non-standard use of the terminology because the benefits were not expressed in monetary terms; its analyses are more accurately described as CEAs. MDPSC approved five of the eight programs (Case No. 9326). BGE’s submission to MDPSC also included a long-term reliability assessment prepared by WorleyParsons (Baltimore Gas and Electric Company (BGE), Citation2013). It reviewed strategies such as targeted undergrounding, enhanced tree trimming, and preventative tree removal, and performed CEA of each program so that the utility could prioritize them. Again, we see the analyses described as CBA even though the benefits were expressed in terms of reliability metrics rather than dollars.
More recently, however, BGE has used the ICE Calculator to monetarily value the benefits of investments made as part of its ERI initiative. In its 2019 rate case, the utility applied the tool to estimate the economic benefits of expanded recloser deployment, and found that this strategy would produce benefits well in excess of costs (Baltimore Gas and Electric Company (BGE), Citation2019). MDPSC actually repeated this CBA using different assumptions that led to reduced benefits but still determined that benefits would be greater than costs (Maryland Public Service Commission, Citation2019).
7.4. Resilience in the regulatory environment
Our Maryland case study provides insight into how regulatory bodies, utilities, and other government agencies can use the occasion of an extreme weather event as an opportunity to thoroughly review storm impacts (retrospective) and propose short-term reliability and long-term hardening initiatives (prospective). Unlike the public utility commissions in the Texas and New Hampshire cases, MDPSC explicitly requires utilities to conduct a CEA of each measure included in their reliability improvement plans. Active government engagement following the June derecho led to improvements in the availability and quality of economic impact information. Most notably, the formation of the Grid Resiliency Task Force led to estimates of customer interruption costs, and this methodology has since been adopted by BGE and MDPSC to conduct CBA of proposed reliability enhancements.
As suggested by the discussion above, the concept of resilience has figured centrally in Maryland’s regulatory efforts pertaining to reducing the risks of LDWIs.
8. Conclusion and policy implications
8.1. Summary of findings
8.1.1. How do utilities or others estimate the costs and benefits of investments to reduce power system vulnerabilities to future extreme weather events?
, below, presents a summary of the extent to which economics-related information is used to justify future investments to reduce power system vulnerabilities. This table also details – across the case studies – whether a cost-effectiveness or cost–benefit analysis was conducted.
Cost-effectiveness analysis (CEA) is the primary technique used by the utilities we studied to assess potential storm-hardening investments and other measures aimed at preventing long- as well as short-duration power interruptions.
Florida Power & Light (FPL) performs CEA in keeping with its established practice for reliability investments. FPL has claimed significant benefits to customers from these investments but does not quantify or monetize these benefits, citing the lack of valuation information.
Con Ed and collaborating stakeholders in New York developed a method for storm-hardening investment valuation based in part on extrapolated short-term avoided cost estimates from Berkeley Lab’s ICE Calculator. The method incorporates cost-effectiveness and is a variation of cost–benefit analysis (CBA), within a framework that incorporates engineering constraints and risk factors.
CenterPoint Energy (CPE) in Texas reported use of CEA in the utility’s storm-hardening regulatory documents, but no details were included. In a study outside the formal regulatory process, CPE and a consultant employed ICE Calculator data in a CBA of the utility’s smart grid project designed to improve reliability of electricity service to critical infrastructure and key business districts, but this was focused on short-duration power interruptions and reliability.
San Diego Gas & Electric (SDG&E) in Southern California uses a form of risk-based cost-effectiveness analysis to evaluate potential wildfire mitigation measures. The regulator has found that it is not currently possible to monetize the benefits of particular investments that reduce wildfire risk but that the overall qualitative social benefits of such investments justify the increased expenditures that are being made for this purpose.
Baltimore Gas & Electric (BGE) in Maryland relies primarily on a form of CEA, although utility and public service commission staff have used the ICE Calculator to value the benefits of proposed reliability investments as a supplement to cost-effectiveness analysis.
Table 2. Availability of economic information related to preventing or mitigating future power disruptions.
We previously noted that Berkeley Lab’s ICE Calculator avoided cost estimates are intended to apply to only short-duration interruptions (up to 16 hours). However, there are currently no avoided cost data specifically developed for application to several day to several week power interruptions readily available for incorporation into regulatory and utility decision-making.
We found that utilities and regulators did not use economic modeling methodology to assess the value of investments to prevent future LDWIs on the regional economic scale. One municipal government (New York City, encompassing the Con Ed service territory) did so.
8.1.2. How do utilities and regulators use the concept of resilience in estimating the economic value of investments to prevent or mitigate the severity of LDWIs?
The term ‘resilience’ was used extensively by utilities and regulators in two of the five cases we studied, very little in two, and essentially not at all in one. The usage where it appeared was primarily semantic in the sense that the ‘resilience investments’ mentioned were for the most part types of storm-hardening and similar measures with which utilities and regulators have considerable experience. What has changed from historical norms is that the frequency and magnitude of precipitating extreme events and the severity of their power system consequences have increased; therefore, the scale and cost of investments to address these risks have also increased. We find that it is generally not at issue which ‘metrics’ should be used in this context. Rather, the challenge is how to economically value investments developed using these metrics.
8.2. Florida
Although the term ‘resilience’ appears occasionally in utility and regulatory documents, resilience per se is not formally recognized or used by the utility or the regulator, either as a concept or as an operational criterion, in Florida’s storm-hardening planning or storm impact analysis and recovery. Florida does not single out ‘resilience investments’ as a special category, and the metrics needed for analysis are well-known specific physical and/or engineering quantities pertaining to electricity infrastructure; that is, there are no special ‘resilience metrics.’
8.3. New York
Resilience terminology has been used in virtually all of Con Ed’s and NYPSC’s efforts and initiatives on preparing for and recovering from extreme weather events. However, the investments and measures proposed and undertaken under this rubric are typically more extensive, advanced, and in many cases expensive, storm-hardening actions of types already known, rather than categorically different types. As in Florida, the appropriate resilience ‘metrics’ appears to be well known; an example in the New York case is the size of the flood plain. The record indicates that in this and other examples there was debate not over appropriate metrics, but rather about the appropriate level of risk tolerance for the utility and the value of reducing risk.
8.4. Texas
The term ‘resilience’ is only occasionally mentioned in CPE and PUCT documents. Moreover, the utility itself does not formally define this term. The regulators use FERC’s definition: ‘the ability to withstand or recover from some disturbance’ (Federal Energy Regulatory Commission (FERC), Citation2018).
8.5. California
Resilience was neither a conceptual nor a practical part of SDG&E’s or CPUC’s wildfire risk management planning.
8.6. Maryland
Resilience is the overarching rubric for efforts at the level of state government to reduce the state power system’s vulnerability to high winds, severe storms, and other threats. However, the details of the record show that neither the regulatory authorities nor the BGE utility recognizes a sharp distinction between reliability and resilience in practice, other than a five-minute threshold for the duration of interruptions. Most of the detailed analysis refers to reliability and uses conventional metrics such as the System Average Interruption Frequency Index (SAIFI).
8.6.1. How do regulatory processes and other institutional factors influence utilities’ economic analysis related to power interruptions?
In the cases, we examined, institutional factors including laws, regulations, and regulatory practices have had a very significant influence on how utilities prepare for LDWIs. State laws and regulations typically stipulate the use of CEA; when laws or regulations also refer to CBA, the intent is not necessarily to require monetization of benefits. In addition to the absence of data, specific regulatory requirements appear to be key reasons that utilities have been using or adapting their existing, cost-effectiveness-based, reliability economic assessment methods to analyze larger-than-previous investments in storm hardening.
Severe power interruptions caused by extreme weather precipitated extensive regulatory activity to improve utility prevention and mitigation practices in Florida, New York, California, and Maryland. The technical work that is involved in developing storm-hardening and related proposals can involve multiple stakeholders – not just utilities and regulatory staff but also non-profit organizations, other government entities, and academic institutions. Moreover, as noted above, these processes can be adversarial; utility proposals are routinely opposed, and settlements are negotiated between stakeholders. In some cases of storm-hardening planning, methods are determined and agreed upon in these collective deliberations, and technical extensions, enhancements, or improvements to information and methods are outcomes of, not inputs to, these processes.
The continued reliance on CEA discussed above also reflects another important institutional consideration: even in the absence of long-duration interruptions, not all utilities have adopted the practice of economic valuation of reliability improvements aimed at preventing even momentary or short-duration power outages. Thus, utilities and their regulators may lack familiarity and an established technical and procedural basis upon which to build in order to analyze the economic value of larger investments related to preventing LDWIs.
8.7. Policy implications
8.7.1. Economic analysis of investments to reduce power system vulnerabilities to future extreme weather events
The lack of electricity customer avoided cost analysis and modeling of economy-wide effects in the context of LDWIs implies that the economic impacts of these events are being underestimated. It follows that the benefits of more significant storm-hardening and other investments could be considerably larger than is currently recognized. Thus, there is a clear rationale for developing the data and tools needed to conduct these types of analysis.
The case studies indicate a clear need to develop new estimates of avoided costs of LDWIs on residential, commercial, and industrial customers and computational economic modeling of economy-wide impacts of these events. Surveys can be designed using cutting-edge elicitation techniques to identify customer costs of interruptions that range from hours to weeks. Building on previous work, existing economic modeling tools can be further developed for application to power interruptions specifically. Moreover, these two research areas are complementary and indeed can be synergistic, with survey design and empirical analysis of customer avoided interruption costs used to solidify the empirical foundations of the computational models, integrating the two methodologies in quantifying both direct and indirect economic impacts of interruptions (Baik et al., Citation2020).
8.7.2. Resilience and institutional factors
As we discussed in Part I of this study, the putative need for new resilience metrics has been the focus of a considerable amount of attention and work for several years. However, we did not find that an absence of appropriate physical or engineering metrics was an issue for utilities and regulators confronting the challenge of reducing their systems’ increasing vulnerability to extreme weather. On the contrary, the specific physical and engineering quantities on which investments and actions must be focused are generally already understood by utilities and by many regulatory personnel and other stakeholders. What is lacking is economic information that can be used to estimate the potential economic benefits of capital investments and operational strategies that reduce vulnerability.
For these reasons, efforts to identify and address ‘resilience’ as a categorically distinct substantive phenomenon may not align well with utility and regulatory practices and perspectives and may in fact be counterproductive.
More generally, researchers and others outside the utilities and regulatory commissions must recognize the importance of institutional influences on both utilities’ technical approaches to event-preparedness planning and the regulatory processes within which such planning is conducted, as well as the need to take account of these influences when considering new methodologies and practices. State laws and regulatory codes are a major factor. Furthermore, regardless of their technical merits, new methods and other information must be credible to, and agreed upon by, a consensus of multiple stakeholders. One implication is that caution should be exercised regarding expectations about adoption by utilities, regulators, and stakeholders, of analytical methods, techniques, and other information, developed outside the local ‘decision ecosystems’ that comprise utilities, regulators, other stakeholders, and laws, regulations, and customs.
Acknowledgments
The work described in this paper was funded by the U.S. Department of Energy’s Office of Electricity under Lawrence Berkeley National Laboratory Contract No. DE-AC02-05CH11231. We are grateful to the U.S. Department of Energy for supporting this project and acknowledge the constructive feedback provided by a number of individuals in academia, industry, and government. All errors and omissions are the responsibility of the authors. Any views expressed in this document are those of the authors and do not necessarily represent those of their employers or sponsors.
Disclosure statement
The Coalition for Disaster Resilient Infrastructure (CDRI) reviewed the anonymised abstract of the article, but had no role in the peer review process nor the final editorial decision.
Funding
The Article Publishing Charge (APC) for this article is funded by the Coalition for Disaster Resilient Infrastructure (CDRI).
Additional information
Notes on contributors
Benjamin D. Leibowicz
Benjamin D. Leibowicz is an Associate Professor in the Operations Research and Industrial Engineering graduate program at The University of Texas at Austin. He is also affiliated with the Walker Department of Mechanical Engineering, Lyndon B. Johnson School of Public Affairs (by courtesy), and Energy and Earth Resources graduate program. His applied research interests include energy system modeling, energy and environmental policy analysis, sustainable cities, technological change, and infrastructure systems. Dr. Leibowicz earned M.S. and Ph.D. degrees in Management Science and Engineering from Stanford University and an A.B. in Physics with a minor in Economics from Harvard University.
Alan H. Sanstad is a Staff Scientist in the Energy Technologies Area at the Lawrence Berkeley National Laboratory. He is also an affiliate researcher of the Energy & Resources Group at the University of California, Berkeley and of the NSF-sponsored Center for Robust Decision-Making on Climate and Energy Policy at the University of Chicago. His research interests include decision-making pertaining to energy system transitions, energy-economic modeling, integrated assessment modeling, and greenhouse gas abatement. Dr. Sanstad received M.S. and Ph.D. degrees in Operations Research and an A.B. in Applied Mathematics from the University of California, Berkeley.
A. H. Sanstad
Qianru Zhu is currently an Engineer/Scientist II in the Energy Systems and Climate Analysis Group at the Electric Power Research Institute. Her research interests include energy system modeling, energy and environmental policy analysis, and decision-making related to climate resilience. Dr. Zhu obtained M.S. and Ph.D. degrees in Operations Research and Industrial Engineering from The University of Texas at Austin (where she was while working on this paper) and B.S. degrees in Mathematics and Economics from Penn State.
Q. Zhu
Peter H. Larsen is a Staff Scientist and Leader of the Electricity Markets and Policy Department at the Lawrence Berkeley National Laboratory. He is also a Research Fellow at the University of Montana Bureau of Business and Economic Research. His research interests include economic analysis of electricity reliability and resilience, long-term electric utility planning, the energy service company industry, and risks to infrastructure from extreme events. Dr. Larsen earned M.S. and Ph.D. degrees in Management Science and Engineering from Stanford University, an M.S. in Natural Resource Economics from Cornell University, and a B.A. in Economics from the University of Montana at Missoula.
P. H. Larsen
Joseph H. Eto is a Staff Scientist in the Energy Technologies Area at the Lawrence Berkeley National Laboratory. From 1999 to 2020, Mr. Eto led the program office for the Consortium for Electric Reliability Technology Solutions, which was a national laboratory-university-industry R&D consortium that conducted research and analysis on electricity reliability and transmission technologies. His research interests include electricity reliability, transmission planning and operations, demand response, distributed generation, and utility integrated resource planning. Mr. Eto obtained an M.S. in Energy and Resources and an A.B. in Philosophy of Science from the University of California, Berkeley.
Notes
1. These two papers are drawn from a longer Lawrence Berkeley National Laboratory report, which discussed several additional topics and contained another case study that has been omitted here for reasons of length (Sanstad et al., Citation2020).
2. All source documents are formally referenced within each case study.
3. More recently, Hurricane Matthew (2016) primarily affected the state’s coastline, but the Category 4 Hurricanes Irma and Michael in 2017 and 2018, respectively, passed over inland areas and had significant impacts.
4. A collaborative research project on improving hurricane preparation was started in 2006–2007 involving the University of Florida, the state’s utilities, regulators, and other stakeholders. This effort included development of a modeling tool designed to quantify customer benefits of measures to prevent power interruptions using estimates of direct costs based on standard reliability measures such as system average interruption frequency index (SAIFI) and system average interruption duration index (SAIDI; Brown, Citation2008). However, survey data on which to base such estimates were not developed, and this cost–benefit tool was not adopted by FPL or other Florida utilities in the subsequent years.
5. These four provisions are items (3)(b), (3)(d)1., (3)(d)3., and (3)(d)4., respectively, in Florida Public Service Commission (FPSC; Citation2020).
6. Con Ed serves about 99% of electricity customers in New York City; the Rockaway, Queens area is served by the Long Island Power Authority.
7. In New York Public Service Commission (NYPSC; Citation2014), the commission cited New York Public Service Law Sections 5(1)(b), (c); 66(1); 80; 65(1); 79(1), as the bases for its authority.
8. Several studies have been conducted on the total estimated costs of Hurricane Harvey, including property damage from flooding and winds as well as lost economic output from, e.g., interruptions of business activity, electricity outages, and the temporary inability of employees to reach work (Council of Economic Advisers (CEA), Citation2017, Texas Comptroller of Public Accounts (TCPA), Citation2018). However, while these studies include electric power interruptions within their scopes, they do not specifically attribute a portion of their overall loss estimates to these interruptions.
9. Radeloff et al. (Citation2018) discuss the growing wildfire risks from expanding wildland-urban interfaces throughout the U.S.A.
10. The Commission ruled in 2017 that the utility could not recover the requested $379 million from its customers (California Public Utilities Commission (CPUC), Citation2017a). SDG&E unsuccessfully appealed this decision to a state appellate court and the California State Supreme Court, and in April 2019 filed an appeal with the U.S. Supreme Court, which in October 2019 announced it would not hear the case (San Diego Gas & Electric Company (SDG&E), Citation2019, San Diego Gas & Electric Company (SDG&E), Citation2019).
11. Subsequently, 2017 and 2018 were the worst fire seasons in the 85 years of recorded wildfire history in the state; the two most destructive fires of this period in terms of area burned, property destroyed, and lives lost both occurred in 2018 in Northern California.
References
- Baik, S., Sirinterlikci, S., Park, J. W., Davis, A., & Morgan, M. G. (2020). Estimating what US residential customers are willing to pay for resilience to large electricity outages of long duration. Nature Energy, 5, 250–258.
- Baltimore Gas and Electric Company (BGE). (2013, September 3). Comprehensive long-term assessment & staffing analysis.
- Baltimore Gas and Electric Company (BGE). (2019, May 24). Prepared direct testimony of Derrick Dickens before the Maryland Public Service Commission. Case No, 9610.
- Brown, R. (2008). final report – underground assessment phase 3 report: Ex ante cost and benefit modeling. Prepared for Florida Electric Utilities by Quanta Technology, May 5.
- Brown, R. (2009). Final Report – Cost-Benefit Analysis of the Deployment of Utility Infrastructure Upgrades and Storm Hardening Programs. Prepared for Public Utility Commission of Texas Project No. 36375 by Quanta Technology. March 4.
- California Department of Forestry and Fire Protection (CAL FIRE). (2019a). Top 20 Largest California Wildfires. Table, March 14.
- California Department of Forestry and Fire Protection (CAL FIRE). (2019b). Top 20 Most Destructive California Wildfires. Table, March 14.
- California Department of Forestry and Fire Protection (CAL FIRE), California Governor‘s Office of Emergency Services, and United States, Department of Agriculture (U.S. Forest Service). (2009). California Fire Siege 2007 – An Overview.
- California Public Utilities Commission and California Department of Forestry and Fire Protection (CPUC and CALFIRE). (2018). Rulemaking 15-05-006 SED [Safety and Enforcement Division] –CALFIRE Joint assessment and recommendation report. September 19.
- California Public Utilities Commission (CPUC). (2008, November13). Order Instituting Rulemaking [to Revise and Clarify Commission Regulations Relating to the Safety of Electric Utility and Communications Infrastructure Provider Facilities. Rulemaking 08-11-005, order issued.
- California Public Utilities Commission (CPUC). (2017a). Decision Denying Application. Decision 17-11-033, issued November 30, in Application [15-09-010] of San Diego Gas & Electric Company (U902E) for Authorization to Recover Costs Related to the 2007 Southern California. Wildfires Recorded in the Wildfire Expense Memorandum Account (WEMA).
- California Public Utilities Commission (CPUC). (2019). Order instituting rulemaking to implement public utilities code section 451.2 regarding criteria and methodology for wildfire cost recovery pursuant to senate bill 901 (2018). Filed January 10
- California Senate Bill 901 (SB 901). (2018). Public Utilities Code 8386©, 2018 – Wildfires. Approved by the Governor September 21.
- Carey, K. (2014). The day after tomorrow: A survey of how gulf coast state utility commissions are preparing for future storms. Report, Center for Climate Change Law, Columbia Law School, Columbia University, March 5.
- CenterPoint Energy (CenterPoint). (2011). Storm hardening plan summary of centerpoint energy Houston Electric, LLC, pursuant to P.U.C. Subst. R. 25(95). https://interchange.puc.texas.gov/Documents/39339_4_697425.PDF.
- CenterPoint Energy (CenterPoint). (2012 May 1). Report on infrastructure improvement and maintenance pursuant to P.U.C. Subst. R. 25.94 for CenterPoint Energy Houston Electric, LLC.
- CenterPoint Energy (CenterPoint). (2014). Storm hardening plan summary of centerpoint energy Houston Electric, LLC, Pursuant to P.U.C. Subst. R. 25(95) Filing. May 1. https://interchange.puc.texas.gov/Documents/39339_49_787912.PDF
- CenterPoint Energy (CenterPoint). (2015). Storm hardening plan summary of centerpoint energy Houston Electric, LLC, Pursuant to P.U.C. Subst. R. 25(95) Filing. May 1. https://interchange.puc.texas.gov/Documents/39339_70_847785.PDF
- CenterPoint Energy (CenterPoint). (2016). Storm hardening plan summary of centerpoint energy Houston electric, LLC, pursuant to P.U.C. Subst. R. 25(95) Filing. May 1. https://interchange.puc.texas.gov/Documents/39339_78_891869.PDF.
- CenterPoint Energy (CenterPoint). (2017). Storm hardening plan summary of centerpoint energy Houston Electric, LLC, pursuant to P.U.C. Subst. R. 25(95) Filing. May 1. https://inter change.puc.texas.gov/Documents/39339_100_938134. PDF.
- CenterPoint Energy (CenterPoint). (2019 May 1). Storm hardening plan summary of centerpoint energy Houston Electric, LLC, pursuant to P.U.C. Subst. R. 25(95) Filing. https://inter change.puc.texas.gov/Documents/39339_128_1016273. PDF
- Code of Maryland Regulations (COMAR). (2019 July 3). Chapter 20.50.12.13. Major Outage Event Reporting.
- Consolidated Edison Company of New York Inc. ( Con Ed). (2013). Storm hardening and resiliency collaborative report [Phase one]. December 4.
- Consolidated Edison Company of New York Inc. Con Ed.) (with Orange and Rockland Utilities). (2013b). Post Sandy Enhancement Plan. June 20
- Consolidated Edison Company of New York Inc. ( Con Ed). (2014). Amended storm hardening and resiliency collaborative phase two report. November 14.
- Consolidated Edison Company of New York Inc. ( Con Ed). (2015a). Storm hardening and resiliency collaborative phase three report. September 1.
- Consolidated Edison Company of New York Inc. (Con Ed). (2013a). Report on Preparation and System Restoration Performance – [Hurricane] Sandy, October 29 through November 12, 2013a. Report submitted to the New York Public Service Commission, January 11.
- Consolidated Edison Company of New York Inc. (Con Ed). (2015b September). Economic impact comparison of Con Edison and NYC models. Presentation, Consolidate Edison Distribution Engineering
- Consolidated Edison Company of New York Inc. (Con Ed) in partnership with ICF and the Lamont-Doherty Earth Observatory at Columbia University. (2019). In Climate Change Vulnerability Study. https://www.coned.com/-/media/files/coned/documents/our-energy-future/our-energy-projects/climate-change-resiliency-plan/climate-change-vulnerability-study.pdf.
- Council of Economic Advisers (CEA). (2017, November 30). Effects of hurricanes Harvey and Irma on employment, industrial production, & real GDP growth in Q3.
- Electric Reliability Council of Texas (ERCOT). (2016). Scarcity pricing in ERCOT. FERC technical conference, June 27-29, 2016.
- EPRI-CPE. (2014, October). Cost/benefit analysis of centerpoint energy’s intelligent grid project. EPRI Product, ID, 3002004600. https://interchange.puc.texas.gov/Documents/49421_1_1013650.PDF
- Fairfax Office of Emergency Management. (2012). Tropical Storm Force Wind Speed Probabilities. https://www.insidenova.com/news/fairfax/county-officials-things-about-to-get-worse-before-they-get/article_b86a12f0-1c37-58ff-baa8-142f40c657de.html
- Federal Energy Regulatory Commission (FERC). (2018). Order terminating rulemaking proceeding, initiating new proceeding, and establishing additional dockets. United States of America federal energy regulatory commission. 162 par. 61,102, Docket Nos. RM18-1-000 and AD18-7-000, issued January 8. Docket No. AD18-7-000
- Florida Administrative Code (FAC). (2006a). Rule 25-6.0143: Electric infrastructure storm hardening.
- Florida Administrative Code (FAC). (2006b). Rule 25-6.0342: Electric infrastructure storm hardening.
- Florida Power & Light Company (FPL). (2007). Florida power & light company’s electric infrastructure storm hardening plan, [filed in compliance with] Rule 25-6.0342, F. A. C. May 7.
- Florida Power & Light Company (FPL). (2010). Florida power & light company’s electric infrastructure storm hardening plan, [filed in compliance with] Rule 25-6.0342, F. A. C. May 3.
- Florida Power & Light Company (FPL). (2013). Florida power & Light Company’s electric infrastructure storm hardening plan, [filed in compliance with] Rule 25-6.0342, F. A. C. May 1.
- Florida Power & Light Company (FPL). (2016a). Florida Power & Light Company’s Electric Infrastructure Storm Hardening Plan, [filed in compliance with] Rule 25-6.0342, F. A. C. March 15.
- Florida Power & Light Company (FPL). (2019). Petition of Florida power & light company for approval of storm hardening plan [for 2019-2021], [filed in compliance with] Rule 25-6.0342, F. A. C., March 1.
- Florida Public Service Commission (FPSC). (2005). Final Order Approving Storm Cost Recovery Surcharge. Order No. PSC-05-0937-EOF-EI, Docket No. 2004-1291, September 21.
- Florida Public Service Commission (FPSC). (2006). Notice of proposed agency action – order requiring storm implementation plans. Order No. PSC-06-0351-PAA-EI, Docket No. 2006-0198-EI, April 25.
- Florida Public Service Commission (FPSC). (2007a). Notice of adoption of rules. Order No. PSC-07-0043-FOF-EU, Docket No. 2006-0173, January 16.
- Florida Public Service Commission (FPSC). (2007b). Report to the legislature on enhancing the reliability of florida’s distribution and transmission grids during extreme weather. Submitted to the governor and legislature to fulfill the requirements of chapters 2006–2230, Sections 19(2) and (3), at 2615, Laws of Florida, Enacted by the 2006 Florida Legislature.
- Florida Public Service Commission (FPSC). (2018). Review of Florida’s Electric utility hurricane preparedness and restoration actions 2018. July.
- Florida Public Service Commission (FPSC). (2020). Notice of Adoption of Rule. Order No. PSC-2020-0038-FOF-EU, Docket No. 2019-0131-EU, January 29.
- Governor’s Commission (Governor’s Commission to Rebuild Texas). (2018). Eye of the storm: Report of the governor’s commission to rebuild Texas.] Report of the Governor’s Commission to Rebuild Texas. November.
- Grid Resiliency Task Force. (2012). Weathering the storm: Report of the grid resiliency task force. Office of Governor Martin O’Malley. Executive Order 01.01.2012.15. September 24.
- Institute of Electrical and Electronics Engineers (IEEE). (2017). National Electrical Safety Code (NESC).
- Jones, Harry J. 24, October . (2013). Cedar fire’s lessons, 10 years later. San Diego Union-Tribune. https://www.sandiegouniontribune.com/sdut-wildfire-cedar-anniversary-fire-2013oct24-htmlstory.html.
- Kalansky, J., Cayan, D., Barba, K., Walsh, L., Brouwer, K., & Boudreau, D. (University of California, San Diego). (2018). San diego summary report. California’s fourth climate change assessment (California Energy Commission). Publication Number: SUM-CCCA4-2018-009.
- LaCommare, K. H., Larsen, P., & Eto, J. (2017). Evaluating proposed investments in power system reliability and resilience: Preliminary results from interviews with public utility commission staff. Lawrence Berkeley National Laboratory, January.
- Larsen, P. H., (2016a). Severe weather, power outages, and a decision to improve electric utility reliability. Doctoral Dissertation. Stanford University. Accessed at: http://purl.stanford.edu/sc466vy9575
- Larsen, P. H. (2016b). A method to estimate the costs and benefits of undergrounding electricity transmission and distribution lines. Energy Economics, 60, 47–61. https://doi.org/10.1016/j.eneco.2016.09.011
- Lazar, J. (2016). Electricity regulation in the US: A Guide (Second Edition.) ed.). The Regulatory Assistance Project.
- London Economics International LLC (London Economics). (2013). Estimating the value of lost load. Briefing paper prepared for the Electric Reliability Council of Texas, Inc. July 17.
- Maryland Public Service Commission. (2019). Direct testimony and exhibits of Kevin Zhong, on behalf of the staff of the public service commission of Maryland. Case No. 9610. https://webpsc.psc.state.md.us/DMS/case/9610. September 6.
- Maryland Public Service Commission (MDPSC). (2013). 2012 annual report for the calendar year ending December 31, 2012.
- National Hurricane Center. 2018. Tropical cyclone report: Hurricane Harvey. Prepared by E. Blake and D. May 9. Accessible at: https://www.nhc.noaa.gov/data/tcr/AL092017_Harvey.pdf
- National Oceanic and Atmospheric Administration (NOAA). (2013 January). The Historic Derecho of June 29, 2012. U. S. Department of Commerce
- New York City (NYC). (2013). A stronger, more resilient New York. Report of the Special Initiative for Rebuilding and Resiliency, City of New York, June.
- New York Public Service Commission (NYPSC). (2014, February 21). Order approving electric, gas and steam rate plans in accord with joint proposal.
- NYPSC. (2015). Order adopting storm hardening and resiliency collaborative phase two report subject to modifications. February 5.
- NYPSC. (2016). Order adopting storm hardening and resiliency phase three report subject to modifications. January 25.
- Public Utility Commission of Texas (PUCT). (2018, December14). Issues related to the disaster resulting from hurricane Harvey – summary of preparedness activities in response to lessons learned from hurricane Harvey by the working group of commission staff and electric utilities. PUCT Project No. 47552.
- Radeloff, V. C., Helmers, D. P., Kramer, H. A., Mockrin, M. H., Alexandre, P. M., Bar-Massada, A., Butsic, V., Hawbaker, T. J., Martinuzzi, S., Syphard, A. D., Stuart, S. I., et al. (2018). Rapid growth of the US wildland-urban interface raises wildfire risk. PNAS (proceedings of the national academy of sciences in the United States of America), 115 (13), March: 3314–3319.
- Reuters, (2017). Photograph of distribution lines in Rockport, texas after hurricane harvey. https://www.texastribune.org/2017/10/13/harveys-death-toll-reaches-93-people/
- San Diego Gas & Electric Company (SDG&E). (2019). In the supreme court of the United States, san diego gas & electric company, petitioner, v. public utilities commission of the state of California, respondent; on petition for a writ of certiorari to the California court of appeal, fourth appellate district – PETITION FOR A WRIT OF CERTIORARI, April 30.
- San Diego Gas & Electric Company (SDG&E). (2020). San diego gas & electric company wildfire mitigation plan. Submitted February 7; revised March 2.
- Sanstad, A. H., Zhu, Q., Leibowicz, B. D., Larsen, P. H., & Eto, J. H. (2020). Case studies of the economic impacts of power interruptions and damage to electricity system infrastructure from extreme events. Lawrence Berkeley National Laboratory report, November.
- Sullivan, M. J., Mercurio, M., & Schellenberg, J. (2009). Estimated values of service reliability for electric utility customers in the United States. Lawrence Berkeley National Laboratory Report LBNL-2132E.
- Sullivan, M. J., Schellenberg, J., & Blundell, M. (2015). Updated value of service reliability estimates for electric utility customers in the United States. Lawrence Berkeley National Laboratory Report LBNL_6941E, January.
- Texas Administrative Code (TAC). (2010). Rule 25.95: Electric Utility Infrastructure Storm Hardening.
- Texas Comptroller of Public Accounts (TCPA). (2018). A storm to remember: Hurricane Harvey and the texas economy.
- Walker, D. T. (2017). The 2017 hurricane season: A review of emergency response and energy infrastructure recovery efforts. Statement of Deann T. Walker, chairman of the public utility commission of Texas, before the U. S. house of representatives committee on energy and commerce, subcommittee on energy. Washington, D. C., November 2.
- Wikimedia Commons. (2004). Radar mosaic of Hurricane Frances at 0457Z 05 Sep 2004 ( 12:57 am EDT). https://commons.wikimedia.org/wiki/File:Hurricane_Frances_radar_mosaic.png