
 ?Mathematical formulae have been encoded as MathML and are displayed in this HTML version using MathJax in order to improve their display. Uncheck the box to turn MathJax off. This feature requires Javascript. Click on a formula to zoom.
ABSTRACT
The disrupted performance of wastewater treatment plants (WWTPs) when facing floods can cause complications in urban systems’ functioning. Therefore, utilities need to improve the resilience of their facilities and establish asset restoration plans. The present study aims at investigating two metrics to improve the WWTP’s resilience. An attribute-based resilience metric is devised using a fuzzy multi-criteria decision-making (FMCDM) framework to attain a budget allocation proposition. A network model representing the interdependent infrastructure is also formulated to develop a performance-based metric. The network’s post-disaster behavior is simulated to obtain an asset restoration sequence (RS). The results indicate that considering imprecisions in experts’ views lowers the possibility of underestimation or overestimation of resilience improvement when allocating funds. Furthermore, prioritizing facilities’ restoration will increase WWTPs’ resilience. The proposed methodology, which is tested on Brooklyn, provides a resilient solution to some challenges in asset management and can be applicable to other coastal settings.
1. Introduction
Urbanization and increased expected quality of service have created complex interdependencies in urban infrastructures. Disruptions in the functionality of these systems caused by natural hazards such as floods can profoundly affect urban societies. Furthermore, exposed infrastructures such as wastewater treatment plants (WWTPs) often placed near water in coastal cities are more vulnerable and need additional provisions for flood resilience improvement (Karamouz et al., Citation2016). The flood resilience of a system is its ability to withstand floods, mitigate the related adverse impacts, and return to normal conditions (Simonovic & Peck, Citation2013). Therefore, a WWTP’s resilience depends on its intrinsic strength and resources needed to withstand flooding before and during the hazard, as well as the rate and speed of its recovery pertaining to interdependencies after the event. As a result, the flood resilience of a WWTP can be improved by increasing the flood resistance aspects of these systems and prioritizing the restoration of interdependent assets to minimize the interruption of their serviceability.
Moreover, a pressing concern currently addressed by infrastructure asset managers is the lack of well-defined, resilience-informed asset operational planning in response to cascading interdependent failures (Imani & Hajializadeh, Citation2020). Therefore, the proposed resilience improvement measures need to be aligned with the current asset management programs (AMP) of WWTPs to initiate and promote new and adaptive pathways toward sustainable infrastructure management. An AMP entails all the events occurring over the life-cycle of an infrastructure’s assets (Malano et al., Citation1999). Although extreme events and natural disasters have long-lasting effects on the performance of an infrastructure’s assets, the role of resilience improvement measures in the AMP of urban infrastructures is among the less emphasized topics in the literature. To improve the resilience of a system, metrics need to be developed to quantify this system’s characteristic. Vugrin et al. (Citation2017) indicated that resilience assessment methodologies could be classified as attribute-based or performance-based.
The attribute-based resilience metric of a system is often developed by distinguishing the characteristics of a system that can influence its resilience (Duijnhoven et al., Citation2017). A limitation of an attribute-based assessment is that it does not provide any estimation or confidence in how well the system will operate in the event of a disruption (Vugrin et al., Citation2017). Therefore, this metric can only provide insight into the preparedness of the system itself, not its response after the failure. However, attribute-based assessments are powerful techniques for resource allocation and quantifying a system’s resilience. This is often made possible by including subjective expert opinions on the pairwise comparison of different resilience elements. In this regard, multi-criteria decision-making (MCDM) methods have proven effective in identifying and analyzing the attributes contributing to a system’s resilience (Karamouz & Movahhed, Citation2021).
In several fields, MCDM techniques have been widely used in prioritizing resources and alternatives in the overall evaluation of systems (Anaokar et al., Citation2018; Tahmasebi Birgani & Yazdandoost, Citation2018; Zamani et al., Citation2020). Based on the input information, MCDM approaches are categorized into crisp MCDM and fuzzy MCDM (FMCDM; Sitorus et al., Citation2019). The outcome of Crisp MCDM methods usually relies significantly on decision-makers’ subjective judgments and preferences (Kabir & Ahsan Akhtar Hasin, Citation2011). Applying the fuzzy set theory in MCDM enables the incorporation of imprecisions associated with the vague judgments of experts (Chen et al., Citation2011).
The fuzzy analytical hierarchy process (FAHP) technique, as a part of FMCDM methods, can be viewed as an advanced analytical method extended from the traditional AHP developed by Saaty (Citation1987). Generally, it is impossible to reflect the decision makers’ imprecise preferences through crisp values. Chang (Citation1996) introduced an FAHP approach that employs triangular fuzzy numbers (TFNs) for the pairwise comparison scale instead of crisp values. FMCDM methods have been frequently used in water and wastewater infrastructure management.
Noori et al. (Citation2021) used a grouped FMCDM method for water supply choice optimization. Comparing their proposed method with conventional MCDM methods, their results indicated that utilizing FMCDM methods stands more consistent with the local experts’ opinions. Dewalkar and Shastri (Citation2022) evaluated different wastewater treatment systems by integrating life cycle cost parameters in an FMCDM framework. Results from their study showed that the experts mostly prefer natural treatment systems. Thus, FMCDM methods have proven more effective in the context of prioritizing investments and improvement measures for urban water and wastewater infrastructures.
One widely used framework for measuring urban communities and infrastructures’ attribute-based resilience has been proposed by Bruneau et al. (Citation2003), which is based on quantifying the system’s resilience dimensions, including rapidity, robustness, resourcefulness, and redundancy (four Rs). Rapidity is the system’s ability to achieve the expected level of performance in the shortest possible time, while robustness is the system’s resistance to maintaining its function against stressors. Furthermore, resourcefulness is defined as the ability to employ material and human resources to meet the expected level of service, and redundancy is the units available for replacement in different parts of the system to ensure its continued operation (Bruneau & Reinhorn, Citation2007; Schoen et al., Citation2015). By identifying the flood resilience attributes of WWTPs, a resilience quantification framework built on the preference ranking organization method for enrichment evaluation (PROMETHEE) was designed by Karamouz et al. (Citation2018). Their findings showed how resilience could be increased by improving the values of factors that affect resilience, mainly through financial allocation.
Conversely, the performance-based method is generally applied by monitoring the performance of a simulated system after a disruption with the help of a defined resilience metric (Hosseini et al., Citation2016; Sun et al., Citation2020). However, developing a performance-based metric can be complex and require a significant amount of data (Vugrin et al., Citation2017). Thus, utilizing this method for simulating the preparedness and response of a complex system such as a WWTP to assess its resilience can create complications and could be time-consuming. Sweetapple et al. (Citation2022) suggested that performance-based resilience assessment methods can aid in shifting the emphasis from the hazard itself to the system process by providing an insight into system characteristics that increase its resilience. In this regard, interdependencies can bring about further disruptions in urban systems’ functioning because of the cascading failure effects (Guidotti et al., Citation2016).
Rinaldi (Citation2004) examined the critical interdependencies between urban infrastructures by citing power outages in early 2001. He concluded that identifying and analyzing interdependencies between infrastructures to manage them effectively is essential as these infrastructures become more centralized and complex. Approaches developed to date for modeling the performance of interdependent infrastructure systems following disruptive events are generally placed into five categories of agent-based, system dynamics-based, network-based, economic theory-based, and others (Ouyang, Citation2014). Employing Ouyang’s classification, the topology-based simulation network, one of the implementations of the network-based method, has been selected for the presented study to derive a performance-based resilience metric. Network modeling, which follows the graph theory, is a suitable method for simulating an interdependent infrastructure system since most urban systems are composed of networks of physical assets (Sinha, Citation2013).
Water supply systems, power grids, communication infrastructures, and their patterns were modeled using network theory and numerical analysis by Kong and Simonovic (Citation2016). Based on three network resilience features, a new resilience metric was represented that could improve the decision-making processes. He and Cha (Citation2020) classified the interdependencies among urban infrastructures into three levels of system-to-system, system-to-facility, and facility-to-facility, depending on the resolution. Using a dynamic network-based model, they concluded that recovery periods would be underestimated if interdependencies between systems were ignored. Based on the reviewed literature, the role of interdependencies in the performance of WWTPs during and after natural hazards is not widely investigated.
According to Henry and Emmanuel Ramirez-Marquez (Citation2012), a generic resilience assessment must integrate both methods mentioned above to consider measurements for avoiding disruptions and facilitating the recovery from disruptions. In this regard, and based on the concept of resilience, an FMCDM process is proposed to develop an attribute-based metric to increase the WWTPs’ ability to withstand the additional load of a storm through financial allocation. Also, a network model is utilized to devise a performance-based metric to improve the recovery rate of WWTPs’ serviceability after the disaster by prioritizing the restoration of interdependent assets. The proposed resilience improvement measures are chosen by considering the relevant features of an AMP (allocation of financial resources and operation and maintenance planning). It should be noted that other resilience improvement measures, such as the application of nature-based solutions (Lafortezza et al., Citation2018), monitoring asset performance against predefined service delivery targets (OECD, Citation2021), and increasing existing components’ interconnections (Shin et al., Citation2018), are not considered in this study. Imprecisions in linguistic terms are handled in the first method, and uncertainties in the state of damaged facilities are addressed in the latter. Consequently, different aspects of infrastructure characteristics and interdependencies are considered as both parts of a financial allocation scheme and a prioritized asset restoration plan. In the following sections, the methodology is discussed thoroughly. Then, different specifications of the study area are presented, followed by discussions of the results from applying the methodology to the case study. As the last step, a summary is provided, and conclusions are drawn.
2. Methodology
The methodology of this study consists of identifying different systems characteristics and data preparation at first. An attribute-based resilience metric is then obtained by combining the fuzzy set theory with an already established MCDM framework by Karamouz and Hojjat-Ansari (Citation2020) to determine each WWTPs share when allocating funds. In order to simulate the process of spreading interference in the serviceability of network components and the subsequent recovery of failed components after a flood event, the Interdependency Network Model (INM) is developed as a performance-based assessment method. Eventually, the restoration of INM components is prioritized based on maximizing the resilience of WWTPs. The proposed framework provides a practical solution to achieve a more resilient AMP for WWTPs at the risk of flooding.
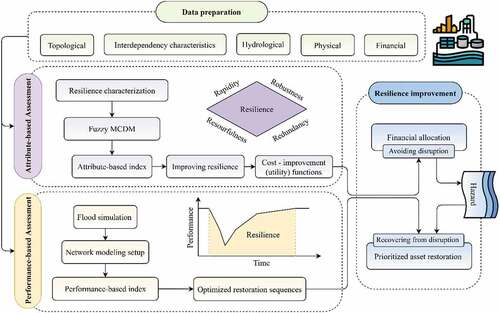
The flowchart of the proposed framework for financial allocation based on improving the interdependent WWTP’s resilience before the disaster and the prioritized asset restoration for post-disaster recovery is shown in . The flowchart consists of a data preparation section covering topological, physical, and systems characteristics, two resilience quantification methods, and a final segment for improving each resilience metric.
Figure 1. Proposed framework for WWTP’s flood resilience improvement by financial allocation and prioritized asset restoration.
2.1. Attribute-based resilience assessment
For quantifying an attribute-based resilience metric, the WWTPs’ attributes affecting their resilience already identified by Karamouz and Hojjat-Ansari (Citation2020) will be utilized. Therefore, the identified attributes (hereafter called sub-criteria) should be categorized into the four Rs criteria. The corresponding sub-criteria associated with the WWTP’s resilience are presented in . Additional descriptions of the sub-criteria are provided in of Appendix A. Rapidity and robustness criteria each consist of eight sub-criteria. Resourcefulness has three sub-criteria while four sub-criteria are assigned to redundancy. As mentioned before, the attribute-based metric is developed to improve a WWTP’s resilience prior to and during the flood. Therefore, attributes (sub-criteria) only affecting its performance in resisting the flood load are addressed by five additional sub-criteria representing WWTPs’ interdependencies to power infrastructure.
Figure 2. Sub-criteria defined for quantifying WWTPs’ flood resilience (Adapted from Karamouz & Hojjat-Ansari, Citation2020).
2.1.1. Imprecise judgments handling
The AHP method has been extensively used for assigning weights for the sub-criteria based on expert knowledge. However, due to the subjectivity inherent in human judgment, imprecision inevitably enters this process (Xiao, Citation2019). Therefore, the conventional AHP method cannot handle the ambiguity associated with mapping one’s judgment to a number (Liu et al., Citation2020). Incorporating fuzzy set theory into the framework of an MCDM technique will assist the decision-maker when transforming vague linguistic expressions made based on subjective information into quantitative assessments (Kaya et al., Citation2019).
In this regard, Chang (Citation1996) introduced a new AHP approach by combining it with the fuzzy set theory. This method considers the imprecisions associated with the assessment of linguistic terms by quantifying the pairwise comparison scales with the use of TFNs. First, the scales of relative importance used in the pairwise comparison matrix will be defined. Nine TFNs are defined with respect to the classical scale system. Each TFN can be represented with , where
,
and
stand for the lower and upper value of the support of, respectively, and
for the modal value. The linguistic terms for describing the levels of importance for scales 1 through 9 are defined in . Corresponding TFNs of each linguistic value for pairwise comparison are also listed in .
Table 1. 9-level fuzzy scale for the pairwise relative importance.
In the second step, pairwise comparison matrices are generated concerning the experts’ opinions. The geometric mean method is used to integrate the fuzzy pairwise comparison matrices from different experts (Buckley, Citation1985). The fuzzy geometric mean value of criteria can be calculated as
Consider the TFNs and
, where
and
. The operational laws for adding, multiplying, and inverting TFNs are done using EquationEquations 2
(2)
(2) to 4 as
The fuzzy weight of the criterion can then be calculated based on EquationEquations 1
(1)
(1) through Equation4
(4)
(4) as
In order to investigate the effect of imprecisions in the quantification of resilience, the crisp weights of the identified sub-criteria are also calculated. For this purpose, experts’ linguistic opinions are transformed to the crisp scales mentioned in and combined according to the conventional AHP method (Karamouz & Hojjat-Ansari, Citation2020). Comparing the crisp resilience values with the fuzzy results can highlight the practicality of the FAHP method and assist the decision-maker in selecting a range of variations as far as the actual state of resilience is concerned.
2.1.2. Fuzzy resilience metric
For quantifying resilience, the PROMETHEE method, which is an efficient decision-making method for a limited set of alternative measures, can be used (Behzadian et al., Citation2010). PROMETHEE uses geometrical analysis to combine subjective weights and values in order to compare the alternatives with each other. A detailed description of the applied approach to quantify resilience in a deterministic manner is explained in Karamouz et al. (Citation2016).
In this study, the PROMETHEE method is extended to the fuzzy environment adapted from Tong et al. (Citation2020).
Let be a set of alternatives,
be a set of the decision-makers and
be a set of criteria concerning their fuzzy weights
. Here, only the weights of the FMCDM problem are treated as TFNs. Therefore, the proposed fuzzy PROMETHEE (FPROMETHEE) method has no differences from the conventional method until calculating the aggregated preference function. The fuzzy aggregated preference index,
can be calculated as
where ,
, and
and
are given preferences by the decision-makers for
and
alternatives, respectively.
is the indifference interval linear priority rule preference function over the
criterion. Then, the fuzzy leaving (positive) flow,
and entering (negative) flow,
for the
alternative can be obtained respectively as
where represents the degree to which alternative
dominates all other alternatives. Contrastingly,
represents the degree to which alternative
is dominated by all the other alternatives (Abdullah et al., Citation2019). The net outranking flow of the
th alternative,
, will be
The fuzzy resilience metric for each alternative (WWTP) is calculated by transferring the values of the net flow to a range of to express the resilience metric in percentage. Lower and upper values of the fuzzy resilience metric can be interpreted as the minimum and maximum values for the resilience of
WWTP. Rather than aiming to be analytically precise, this method provides relative and indicative measures for a resilience comparison between similar systems. Eventually, crisp resilience metrics are also developed using crisp weights obtained in the previous step and the conventional PROMETHEE II method explained by Karamouz and Hojjat-Ansari (Citation2020). This is done to see how effective the inclusion of imprecision in the experts’ opinions is when quantifying an attribute-based resilience metric.
2.1.3. Resilience improvement
One way to increase this resilience metric is by improving sub-criteria values. For this purpose, economic sub-criteria (ESC), the sub-criteria that can potentially be improved by investment, are identified and listed in , along with their corresponding marginal cost in improvement.
Table 2. Economic sub-criteria with their corresponding marginal costs in USD. (Adapted from Karamouz & Hojjat-Ansari, Citation2020).
ESCs are then targeted for maximizing the resilience improvement of the WWTP for a total budget,
according to EquationEquation 10
(10)
(10) . Allocation constraints for each ESC are also conditioned in the optimization problem.
where , is the increase in resilience after any investment in the
plant.
, is determined from FPROMETHEE.
, is the part of
that is dedicated to
, and
, is the value of
before the investment. Also, according to ,
, is the cost corresponding to the unit increase of the ESC, and
, is the number of distinguished ESCs, which is equal to six. The incremental improvement of sub-criteria values after financial allocation is shown in EquationEquation. 11
(11)
(11) . With EquationEquations 14
(14)
(14) and Equation19
(19)
(19) , the total allocation to a plant to increase its treatment capacity and on-site storage is limited to 35%. In order to compensate for the power shortage, the on-site generators’ capacity will be increased according to the difference between the power consumption of the plant and its capacity (EquationEquation 15
(15)
(15) ). Because WWTPs typically have 1,000–2,000 KW generators, according to , it is assumed that for every 2,000 KW increase in capacity, one generator is added, which costs $1.6 million. This sum has already been allocated to the capacity of the generators. EquationEquation 16
(16)
(16) determines the allocation limit for sandbagging, waterproofing, and elevating critical equipment. These three items are the measures that need to be taken in order to increase the percentage of not-at-risk equipment during flooding. EquationEquation 17
(17)
(17) is used to determine the maximum increase of the personnel. EquationEquation 18
(18)
(18) indicates that the investment needed to equip a plant with dewatering facilities is $7 million, assuming the plant does not already have these facilities. It should be noted that EquationEquations 14
(14)
(14) through Equation19
(19)
(19) are defined using preliminary information. For the actual implementation of the proposed methodology, specialists from each system can do a more thorough analysis to properly define these limits for specific ESCs.
Initially, the resilience improvement of each plant is evaluated for different figures through optimization. Total budgets (TB) of $5, $10, $50, $100, and $200 million are allocated to each plant to obtain their corresponding resilience increase separately in order to form their utility functions (UFs). Here, the UF is defined as the rate of increased resilience resulting from financial allocation. Three UFs representing the fuzzy improved resilience metric’s lower, middle, and upper values are fitted to the incremental allocation increase against the percentage of resilience improvement. In order to attain a single UF for each WWTP, EquationEquation 20(20)
(20) is utilized to defuzzify the TFNs (Wu et al., Citation2017).
2.2. Financial allocation
In this step, the derived UFs for each WWTP are employed to determine the final budget allocation by maximizing the Nash product (MNP). When reaching an agreement is challenging in allocation problems, the solution approaches the Nash bargaining solution with utilities that reflect the incentive to settle and have a determined disagreement vector (Binmore et al., Citation1986). The unique solution for the presented allocation problem based on maximizing Nash product can be achieved by
where N is the number of WWTPs, is the vector of systems’ UF, which is a function of
, the allocated money for the
WWTP, and
, is the allocation at which the rate of resilience improvement of the
WWTP becomes insignificant.
is the disagreement vector. Here, the disagreement factor is assigned to be half of the funding recommended by the WWTP’s management department. In practice, each plant manager can determine the minimum amount of funding it needs as the point of disagreement in the allocation process.
2.3. Performance-based resilience assessment
In this assessment method, a functionality metric that conforms with the study’s objective must be defined, and its behavior monitored through the simulation process of the system’s performance after a hazard occurrence.
2.3.1. Flood inundation
Floodplain delineation and routing are essential in analyzing the vulnerabilities of an infrastructure network. The Gridded Surface Subsurface Hydrologic Analysis (GSSHA) model, developed by the US Army Corps of Engineers (USACE), was used for this purpose. GSSHA is a 2D hydrologic model that uses digital elevation model (DEM) and geographic information system (GIS) tools to illustrate flooded areas and inundation depth. GSSHA is capable of combining the impact of rainfall and storm surge for overland flow simulation during coastal flooding events (Karamouz & Fereshtehpour, Citation2019). In this model, spatial analysis with a raster format representing data in DEM grid cells with different land-use and soil types is employed to produce the inundation map of the watershed (Downer & Ogden, Citation2004; Karamouz et al., Citation2014). The inundation depths at different infrastructures’ components over the storm’s duration will be obtained from the GSSHA model.
2.3.2. Interdependency network modeling
While there have been numerous studies on modeling the aftermath operation of interdependent water infrastructure systems following a disruption, the majority of them have employed separate physical and deterministic damage models working jointly to simulate the recovery process. In order to refine and extend the previous studies, the present study proposes the Interdependency Network Model (INM). The INM further advances interdependent infrastructure modeling under a storm surge condition in a single model that uses a facility-to-facility resolution of interdependencies. Henceforth, this study refers to the network components in the INM facilities in the wastewater and power infrastructures as assets in the infrastructure network.
The proposed model is a topology-based network that simulates the interactions of network components based only on their topologies and physical connections. Typically, the INM is comprised of nodes and links. Nodes indicate source/sink facilities (assets) connected by links that allow services, i.e., power or wastewater, to flow between them. The links also define the dependency and connection between the ends of the two nodes (Almoghathawi et al., Citation2021).
Nodes. Each node in the INM has two indices; operability and serviceability. The operability of a network node is its own independent functionality, which is determined based only on the node’s condition in a binary manner. If node is considered failed at time step
, its operability,
, will be equal to zero, and if it is considered functional, it will equal one. The serviceability of node
at time step
,
, is defined as its actual output ratio relative to its desired service level (when it performs at its routine level). Thus, the serviceability of a sink node depends on its source node(s) supplying the desired service levels and its own operability. The damage and recovery of network nodes over time are measured using operability and serviceability indices.
Links. Each network link in the INM only has an operability index. The operability of a link between node and node
at time step
,
, represents the functioning physical connection that allows services to be sent from node
to node
. Each link will have a significance factor for its sink node in the form of an interdependency weight. This factor represents the dependence of the serviceability of the sink node on its source node’s serviceability. Thus, the sum of the link weights reaching a node should equal one. The adjacency matrix summarizes the interdependency weights of all the network links.
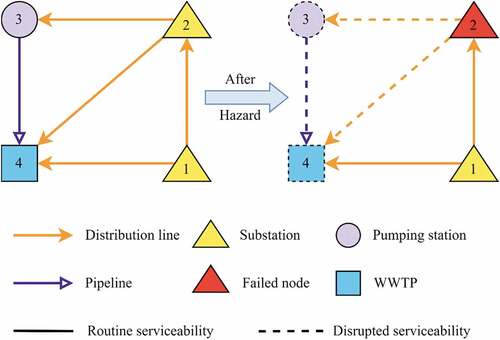
where is the number of all the nodes in the INM. Each element of the adjacency matrix, Aij, determines the relative importance of the link between source node i and sink node j in providing the desired service level of node j, relative to other links connected to node j. illustrates an example network comprised of two substations and one pumping station that provide the required power for wastewater delivery and WWTP operation. When the second substation fails due to the impact of a hazard (
), serviceabilities of the dashed nodes are affected.
Figure 3. An example network before and after the failure of one of its nodes.
2.3.3. System’s post-disaster behavior
A system’s post-disaster behavior can be simplified and illustrated in . Prior to a hazard, a system’s serviceability is at a routine level (100%). When a hazard occurs at time , as illustrated in , the system’s serviceability drops due to the damaged components in its network. This decrease in the system’s serviceability happens during the resistance phase. In this phase, the system is still in shock, cascading failures due to interdependencies have affected the system, and the recovery process is not yet started. Then, the system enters the reaction phase at time, during which the essential damaged components of the system (crucial nodes and links) should be restored as soon as possible to bring the overall serviceability up to the minimum operational capability (MOC) at time
. This is the absolute minimum level of operation, and it is not sustainable. MOC in a WWTP can be defined as when the wastewater is only primarily treated, and further treatment will require restoration of its assets.
Figure 4. Post-disaster behavior and the system’s recovery curve. (Adapted from Bristow, Citation2015).
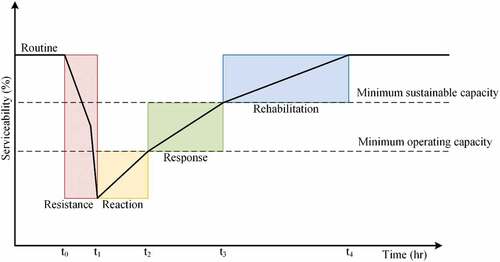
The response phase begins once MOC is achieved. This phase includes a series of system reconstruction and restoration measures required to achieve a minimum sustainable capability (MSC) at time . This is the level of serviceability at which the system starts to be compliant and stable (Hay, Citation2016). For a WWTP, MSC can be defined as when the system behaves sustainably by treating the wastewater to the partial secondary level. Defining MOC and MSC based on the treatment level of WWTPs is used as a standard for evaluating the accuracy of the simulated recovery process.
The rehabilitation phase is the system’s return to the routine serviceability level. At the end of this phase (), the system’s serviceability is restored to the pre-disaster state, and each component’s serviceability is recovered to 100%.
A system’s performance behavior after a hazard consists of the abovementioned phases. This behavior can be monitored by the network’s serviceability versus the time curve (hereafter called the recovery curve). The recovery curve of an asset shows the infrastructure’s initial resistance and its subsequent service improvement process for returning to its pre-disaster condition. Thus, it can be a measure of the asset’s resilience (He & Cha, Citation2018). According to Reed et al. (Citation2009), the time average of the area under the recovery curve of node , can be used as a metric of its resilience,
as expressed in EquationEquation 26
(26)
(26) .
A system’s recovery curve also provides a general overview of its four Rs properties based on the findings of Kong et al. (Citation2019).
2.3.4. Network modeling of resilience
Before the hazard’s occurrence, the INM functions at the routine level, and the operability and serviceability of all network components are equal to one and 100%, respectively. When the storm occurs, a certain number of damaged assets in the INM will be considered failed (their initial operability is changed to zero). The initial operability of a specific component will be determined by considering the uncertainties both in the random nature of the hazard and the design and operation of the assets (discussed in section 2.3.3). Considered failed components are then removed from the network. This procedure will result in the network’s structure to alter accordingly, resulting in a modified adjacency matrix. The serviceability of an operating network node can be lessened in the following time steps due to the cascading failure effect.
After the calamity, a failed component would be recovered and its operability restored to one when a restoration task is performed on the asset for the required time. In order to prioritize the restoration of INM components, only one restoration task was assigned to each infrastructure type at a particular time (one task on wastewater and one for power infrastructure). The recovery coefficients, and
, determine the number of time steps needed for node
, and link
to be restored completely, respectively. Therefore,
When a network component is restored, it will be reinstated in the network structure. Then, the remodified adjacency matrix will be used to obtain the updated serviceability of all INM nodes based on the new network structure. Hence, the serviceability of a node in time step
,
, is defined as
where is the number of all the nodes in the INM, and
is the weight of the link between nodes
and
obtained from the remodified adjacency matrix at time
.
Since the resilience of the WWTPs is this study’s focus, the serviceability of these nodes (treating the wastewater and stormwater) will be considered to derive the recovery curve and quantify the resilience of each. It is worth mentioning that at this stage, the utilized sequence for the restoration of failed INM components is determined randomly to resemble the recovery process of interdependent assets when there are no prioritization plans by the utilities. The INM will simulate the recovery process until the return of serviceability of all WWTPs to the normal condition (routine level). Recovery curves are then produced in this step to calculate the resilience values of WWTPs as a baseline when there are now specific restoration strategies.
The genetic algorithm optimization technique is then utilized to determine the optimized sequence of restoration tasks on the failed assets to improve the developed performance-based resilience metrics. In this regard, after quantifying the baseline resilience, the INM will be reset to its condition at the start of the simulation process and commence once more with the same initial operability values for its components. This time, the restoration sequence (RS) will be optimized by maximizing the resilience of all the WWTPs. Consequently, the objective function of this optimization (EquationEquation 30(30)
(30) ) is intended to maximize the product of all the resilience values,
, for the WWTPs.
where is the resilience value of the
WWTP obtained from EquationEquation 26
(26)
(26) , and
is the total number of WWTPs. After the optimization, corresponding recovery curves for the WWTPs are developed again, and the improved resilience values are calculated accordingly. Also, the optimized RS will be used to classify the restoration priority of different assets in later steps.
2.3.5. Uncertainty in the state of network components
When the hazard occurs, the initial operability of damaged INM components will be changed to zero according to their failure probabilities. Since many factors affect an asset’s performance, the resulting uncertainties need to be modeled when determining the failure probability of an asset in a performance-based method (Olyaei et al., Citation2018). In the case of INM nodes (except for WWTPs), their failure probabilities are determined based on the maximum inundation depth at their location during the storm’s period, and existing fragility curves (FC) utilized from previous studies. The FC of an asset relates its probability of failure to the severity of the hazard while considering uncertainties in its capacity (vulnerability of its components) and the demand (inundation depth or high-speed winds; Karamlou & Bocchini, Citation2015; Ma et al., Citation2020). Because a WWTP is a complex system, it is necessary either to quantify its failure probability using a more precise approach or to assume that it is either zero or 100% based on accounts of its failure during similar hazards in the past.
Links, unlike nodes, have lengths, and they would fail if they sustain physical damage at any point along their length (He & Cha, Citation2018). Consequently, the failure probability of the INM transmission lines is determined relative to their length. Overhead power transmission lines are created by connecting electric conductors through distribution poles. A damaged distribution pole or conductor will result in the failure of the entire transmission line. For the sake of simplicity, the failure probability of conductors is not considered in this study. Therefore, transmission lines are divided into segments equal to the number of distribution poles, and their failure probability can be calculated based on EquationEquation 31(31)
(31) proposed by He and Cha (Citation2018),
where is the failure probability of a transmission line,
is the failure probability of a distribution pole obtained from its corresponding FC, and
is the number of poles contained in the transmission line.
After determining the failure probability of all network components, a uniformly distributed random number in the interval is generated for each INM component and compared against its failure probability. Suppose the generated random number is less than or equal to the failure probability of the component. In that case, it will be considered failed, its initial operability will drop to zero, and it will be removed from the INM. Otherwise, it will keep operating after the hazard. If a transmission line is considered failed, the INM will calculate the number of failed poles by comparing the
to random numbers separately. According to Ouyang and Dueñas-Osorio (Citation2014), the average distance between two wooden poles is 42 meters. Hence, transmission lines in the INM are divided into segments by poles 42 meters apart to establish the number of poles.
After determining the initial operability of INM components, the recovery process discussed in the previous section is simulated, and the serviceability values of WWTPs over time, in both baseline and optimized states, are saved. Then, the INM is reinitialized to its status before the hazard’s occurrence (all components performing at the routine level). Again, failure probabilities of network components are compared to generated random numbers, and new initial operability values for network components are determined. Newly failed components are then removed from the network, and the recovery process will initiate again until the network is fully restored. This process will be repeated for several realizations with different initial states. Each realization of the INM can result in different network structures and recovery paths. Finally, serviceability values of the WWTPs in each time step are averaged over all the realizations to attain final recovery curves and corresponding resilience values for the WWTPs in both baseline and planned states.
2.4. Prioritized asset restoration
Prioritizing the restoration and maintenance of the damaged assets after a hazard plays a critical role in the resilience of urban systems due to resource and first responder limitation issues. In this step, the optimized RSs attained from each realization are utilized in classifying the assets’ priority in the restoration process. This prioritization will help achieve/keep the desired level of service after the flood event. When each INM realization ends, all failed nodes of an infrastructure type are graded based on their position in the RS, according to EquationEquation 32(32)
(32) . Nodes with their operability not affected will receive a grade equal to one.
where is the grade for the
node in the infrastructure, at the
realization,
is the total number of nodes in the
infrastructure (wastewater or power), and
, is the position of the
node belonging to the
infrastructure, in the optimized sequence of the
realization.
A similar grading technique shown in EquationEquation 33(33)
(33) is also applied to the links of the INM.
where is the grade for the link between the
and the
node in the
infrastructure, at the
realization,
is the total number of links belonging to the
connection type (wastewater pipeline or power transmission line), and
is the position of the link type
, connecting
and
nodes together in the optimized RS of the
realization. Then, based on EquationEquations 34
(34)
(34) and Equation35
(35)
(35) , a final score will be assigned to each INM component.
where , and
are the final scores of the
node and the link connecting
and
node together, respectively, and
is the total number of INM realizations. The priority of each INM component in the restoration process is determined based on its score and the classification scheme depicted in . Restoration crews can use the derived prioritization after the hazard as a guide to help WWTPs recover their lost serviceability, hence increasing their resilience. This prioritization is configured in a way that factors such as the failure probability of an asset and its role in the interdependent infrastructure can contribute to its priority. The proposed framework can potentially improve the flood resilience of WWTPs by providing better flood resistance attributes of the plant during the flood and facilitating the recovery and serviceability of that after the event (see the elements of the recovery curve in ).
Figure 5. Classification of INM components according to their score.

3. Case study
The study area selected for testing the proposed methodology should have specific features and available data. These include wastewater and power infrastructure and interdependencies characteristics and technical information, as well as hydrological data and accurate observations of previous storms. Also, the selected area should be at severe risk from coastal storms and have potential resilience improvement for its infrastructures. Therefore, three sewersheds in New York City that were most affected by Superstorm Sandy are selected as the case study of this paper. These are the Coney Island, Owls Head, and Rockaway sewersheds and their corresponding WWTPs. . lists the WWTPs’ names, capacities, drainage area, receiving waterbody, and the population they serve (Balci & Cohn, Citation2014).
Table 3. Specifications of the WWTPs in the study area (Retrieved from NYCDEP (New York City Department of Environmental Protection), Citation2013).
The New York City Department of Environmental Protection (NYCDEP) is responsible for operation and maintenance of the mentioned WWTPs as well as the allocation of financial resources to implement resilience improvement measures. Values of the sub-criteria needed for calculating the attribute-based resilience metric are gathered from the reports issued by the New York City’s Office of the Mayor (NYCDEP (New York City Department of Environmental Protection), Citation2013) and those provided in the study by Karamouz and Hojjat-Ansari (Citation2020). . lists the values assigned to the identified sub-criteria for the three WWTPs in the study area. After Superstorm Sandy, NYCDEP allocated 41.6 million dollars to the specified WWTP to improve their resilience. It is reexamined in this paper how those funds could have been reallocated to the 3 WWTPs.
Table 4. Values of sub-criteria for WWTPs in the study area.
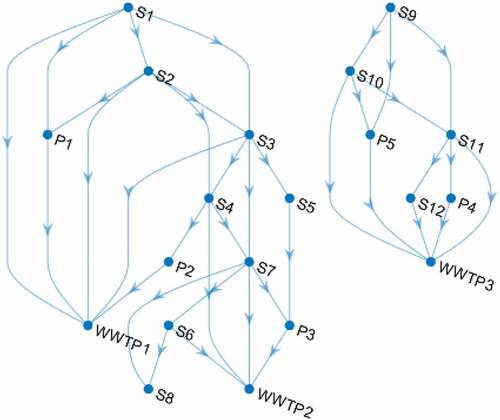
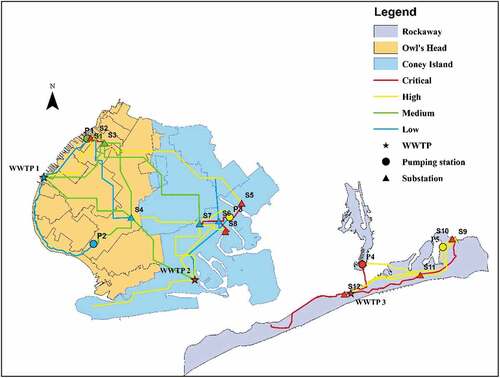
The selected study area is a distinct region that still uses an overhead radial power supply system with wooden poles connected to the national grid. During Superstorm Sandy, the study area experienced widespread outages primarily due to downed trees that caused interruptions in the wastewater infrastructure’s performance (Kurtz et al., Citation2013). lists the data sources used in this study to determine the location and technical information of the assets. WWTPs’ locations and their interdependencies with electric power are illustrated in . The study area depicted in this figure consists of 12 electric substations, five pumping stations, three WWTPs, and 37 links, including transmission lines and wastewater pipelines between these nodes.
Figure 6. The study area with its wastewater infrastructure and its related power facilities.
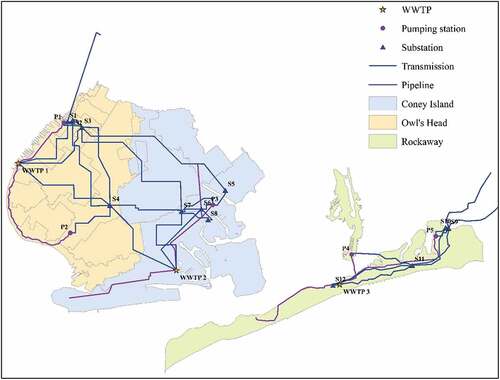
Table 5. Hydrological and technical data sources used in the study.
During Superstorm Sandy, the Owls Head sewershed was the least affected, while the other two sewersheds in the study area experienced higher levels of inundation due to their location. Hydrological data required for flood inundation modeling by the GSSHA model are also tabulated in . When simulating a flood hazard, due to the spatial and temporal characteristics and changes in the state of the waves, utilizing gauged storm hydrographs from the nearest station (Battery Park) is not quite applicable due to the spatial variation of storm from south of Manhattan (where Battery station is) to the southern Brooklyn shoreline where the case study is. To solve this issue, four ungauged storm hydrographs around the case study boundaries, developed by Karamouz et al. (Citation2022), are reexamined and utilized.
Based on the results of the GSSHA model and the FCs obtained from Sánchez-Muñoz et al. (Citation2020) and Yu et al. (Citation2021), the failure probabilities of assets within the network infrastructure are calculated. The sources used in this study for obtaining failure probabilities of INM components (with the exception of wastewater pipelines), along with their recovery coefficients for simulating the recovery process of the INM, are summarized in .
Table 6. Sources used for determining the failure probability and recovery coefficients of different INM components.
As mentioned earlier, the failure probabilities of WWTPs are assumed to be zero or 100% due to their complexity. Because the serviceabilities of Coney Island and Rockaway WWTPs were interrupted during Superstorm Sandy, their failure probability was considered 100% (NYCDEP (New York City Department of Environmental Protection), Citation2013). In contrast, the failure probability of Owls Head plant was assumed to be zero. A typical flood FC for an electrical substation is illustrated in . Utilized FCs from literature are derived from HAZUS’s FEMA (Citation2013) flood model and are applicable to the study area. The failure probability of electric transmission lines in the INM was estimated based on EquationEquation 31(31)
(31) , the wind gust of 38 m/s in the study area during Superstorm Sandy (Blake et al., Citation2013), and the findings of Salman and Li (Citation2016). They calculated the fragility curves of various aged wooden poles under extreme wind speeds. These curves were averaged for the same wind speed values over different poles’ ages to provide a generic fragility curve for the presented study.
Figure 7. For a typical electrical substation: a) Fragility curve, b) water depth versus damage, and c) repair time versus damage (From Sánchez-Muñoz et al., Citation2020).
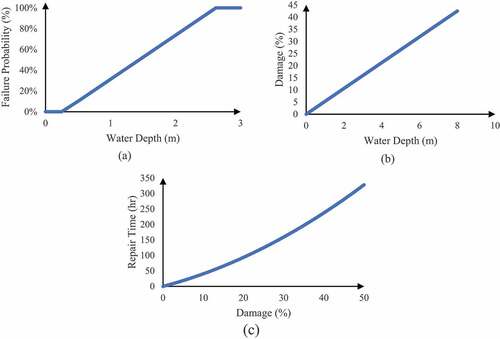
The recovery coefficients of electrical substations in the INM were determined according to the inundation depth versus damage and damage versus repair time curves of this facility type, according to . The recovery coefficients of WWTPs were obtained based on the actual recovery time of these plants after Superstorm Sandy. The pumping stations’ recovery coefficients were estimated, similar to substations, using FEMA (Citation2013), FEMA (Citation2003), and FEMA (Citation2003) earthquake model was utilized since, to date, no studies have been identified that contain damage versus repair time functions of a pumping station in the event of a flood. The recovery coefficients of distribution poles were considered to follow a normal distribution with a mean of 5 hours and a variance of 2.5 hours (Ouyang & Dueñas-Osorio, Citation2014).
4. Results
The proposed methodology provides a practical solution to increase the resilience of WWTPs in two separate steps. First, by allocating funds proportional to the resilience improvement potential of WWTPs prior to the flood. Second, by prioritizing the restoration of the damaged assets in the interdependent infrastructure after the flood event. In the following sections, the results of the proposed methodology are presented.
4.1. Attribute-based resilience assessment
The FAHP technique was utilized along with the conventional AHP to calculate the fuzzy and crisp weights of the identified sub-criteria based on experts’ opinions. The criteria and sub-criteria weights derived by both methods are tabulated in . As listed, the weights of the four Rs are not the same. Rapidity and robustness were assigned higher weights. Also, crisp weights are close to their modal values in the fuzzy state.
Table 7. Estimated fuzzy and crisp weights calculated for the sub-criteria.
Utilizing the PROMETHEE framework in fuzzy and crisp states, values and weights for the sub-criteria listed in , respectively, were utilized in EquationEquations (6(6)
(6) –9). illustrates the attribute-based resilience metrics of the WWTPs in both states. The lower and upper values are discerned as their imprecise boundaries of the resilience estimation. Lower, modal, and upper values of the fuzzy resilience metric are shown on the left of each WWTP, while the values on the right represent the crisp resilience metrics (shown with red lines).
Figure 8. Fuzzy and crisp resilience metrics obtained for the WWTPs in the study area.
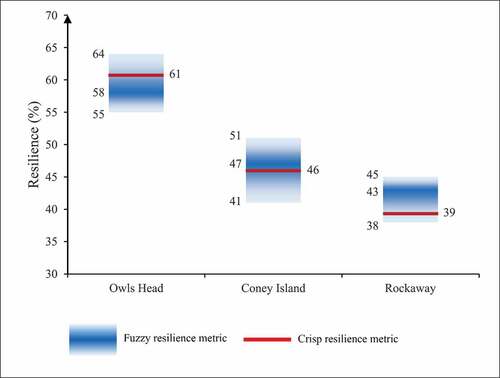
According to , the Owls Head WWTP has the highest resilience, followed by the Coney Island WWTP. The Rockaway WWTP has the lowest resilience due to its flood-prone location and lack of flood resistance equipment. The modal value for the Owls Head WWTP is about 58% which is less than its value in the crisp form (61%), showing experts’ tendency to overestimate the resilience of this plant when not considering the imprecisions. Instead, the modal value of the fuzzy resilience metric for the Rockaway plant is 43%, which is four percent higher than the obtained crisp value. This indicates the potential for underestimating the resilience of this WWTP when using a deterministic method. The fuzzy metric calculated for the Coney Island WWTP has the widest range between its lower and upper values. For this reason, the quantification of its resilience is more imprecise than the other two plants. However, the modal value of its fuzzy resilience (47%) is very close to its crisp value.
Based on identified ESCs () and the resilience improvement optimization formulated in EquationEquations 10(10)
(10) through Equation19
(19)
(19) , the allocation for the maximum increase in the fuzzy resilience metric of each WWTP was obtained. Optimization was carried out for different total budgets ranging from 5 to $200 million. The resilience improvement values obtained from these optimizations were utilized to plot the utility functions (UFs) for the WWTPs illustrated in . A logarithmic UF in the form of
was fitted for each of the improved resilience metrics’ lower (
), modal (
), and upper (
) values since a logarithmic expression had the highest correlation with the data points, as is evident from the values of their corresponding coefficients of determination,
,
, and
, respectively. Another logarithmic curve was also fitted to the points corresponding to the crisp improved resilience values (
) with the coefficients of determination of
. The area between the upper and lower fitted curves represents the imprecision in the outcome of the financial allocation process. Next, by utilizing EquationEquation 20
(20)
(20) , the three UFs were defuzzified and transformed into single crisp functions (
in ) to be utilized in the final financial allocation step.
Figure 9. Fuzzy and crisp UFs for the three WWTPs of Owls Head (a), Coney Island (b), and Rockaway (c).
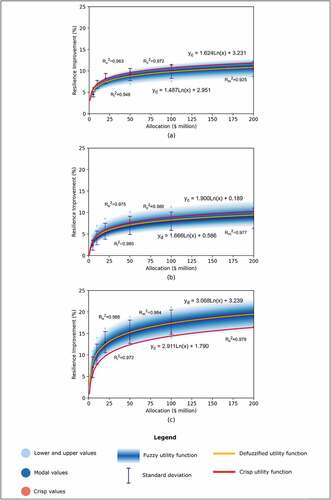
Based on , the defuzzified UF of Owls Head plant is lower than its crisp UF. This indicates the possibility of overestimating the effects of financial resource allocation on improving the resilience of this WWTP if the imprecisions are not taken into account. According to the values of and
functions in , Coney Island WWTP has the least potential for resilience improvement. In addition, due to having a wider gap between the lower and upper UFs of this plant compared to the other two, its allocation process is more prone to deal with imprecision. According to , Rockaway WWTP has the highest potential for resilience improvement. Also, since of this plant is close to its lower UF in the fuzzy form, there is a possibility of underestimating the impact of financial resources on the resilience improvement of this facility by the experts. In general, it can be inferred that by increasing the amount allocated to each of these systems, the effect of the allocated financial resources on the improvement of resilience decreases. Simultaneously, imprecisions intensify as the allocated budget increases, resulting in a more ambiguous resilience improvement estimation.
4.2. Financial allocation
The allocated funds were distributed among the three WWTPs in the study area based on the MNP technique mentioned in Equations 21 to 24. The final allocation and corresponding growth in the resilience values obtained from MNP compared to the actual allocation recommended by the NYCDEP (New York City Department of Environmental Protection; Citation2013), given the $41.6 million of the total funding, are illustrated in .
Figure 10. Final financial allocations and their corresponding potential resilience improvement.
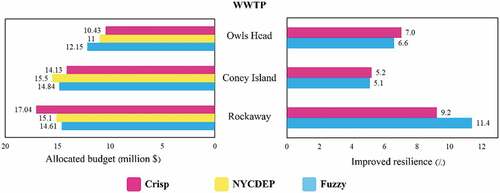
The final financial allocation numbers based on the obtained fuzzy and crisp UFs are in good agreement compared to the amount that NYCDEP actually allocated. The allocated amount for the Owls Head WWTP based on its defuzzified UF is lower than its amount from using a crisp UF. The resilience of the Owls Head WWTP in the fuzzy and crisp mode is increased by 6.6% and 7%, respectively, when allocating the values of 12.15 and 10.43 million dollars. The Coney Island plant, which had the lowest potential for resilience enhancement, receives high allocation in both states and has a minor improvement (around 5%). This is because, in the MNP approach, the tendency is to minimize dissatisfaction among alternatives. With its low resilience and high growth potential, the Rockaway WWTP receives the most considerable allocation ($17.04 million) in the crisp state, which increases its resilience only by 9.2%. Meanwhile, the amount of allocated budget based on its defuzzified UF ($14.61 million) is lower than the crisp value and the amount suggested by NYCDEP, which increases this WWTP’s resilience by 11.4%. Due to the underestimation of the Rockaway plant’s resilience when using crisp weights, more funds are allocated to increase its resilience less than when the FMCDM is utilized.
4.3. Performance-based resilience assessment
As the first step in developing a performance metric, the flood inundation map of the study area during Superstorm Sandy was obtained. Ungauged storm hydrographs for different shoreline sections of the study area, along with DEM of 30-meter resolution and other hydrological data mentioned in , were used in the GSSHA hydrologic simulation model. The GSSHA model was already calibrated for the study area in previous studies. demonstrates the simulated maximum inundation depth during the storm.
Figure 11. The simulated inundation map of the study area obtained from hydrological modeling.
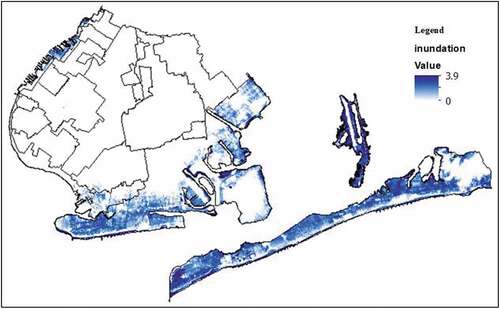
The Rockaway sewershed experienced the most severe flooding, while the Owls Head sewershed was the least affected. Values of the corresponding inundation depths of different nodes of the INM are summarized in . All of the assets located in the Rockaway sewershed witnessed severe inundations, with the Rockaway WWTP itself undergoing 1.74 meters of water. Meanwhile, the storm did not affect two substations in the Owls Head sewershed and one in Coney Island. With 1.63 meters of water depth at the Coney Island WWTP, it had the highest inundation depth among the interdependent assets in its sewershed. The Owls Head WWTP experienced 0.73 meters of inundation when substations S1 and S2, which provide the power for the whole district, were more affected by the storm.
Table 8. Maximum inundation depth at network nodes under simulated Sandy Superstorm.
The study area’s INM, depicted in , was developed using MATLAB software. Gathered FCs, along with the estimated inundation depths at network nodes and the maximum wind gust during Sandy, were utilized to determine the failure probability of electric substations, pumping stations, and transmission lines. At the start of each realization, the initial operability of network components was determined based on their corresponding failure probabilities and generated random numbers, with the exception of wastewater pipelines. The failure of wastewater pipelines during a storm will result in combined sewer overflow. Hence, for a wastewater pipeline link to function without failure, both of its endpoint nodes (the pumping station and the WWTP) need to be operational. Therefore, if any node connected to a wastewater pipeline was in the failure state, the initial operability of this link was also considered to be zero.
Figure 12. The INM of the study area developed in MATLAB.
In the next step, network components with zero operability underwent the recovery process according to their corresponding recovery coefficients. Eventually, wastewater pipelines with zero operability were reinstated in the INM as soon as their connected non-operating nodes were restored. Prior to any optimization, the system’s post-disaster recovery process resulting from a random RS was simulated. Serviceability values in each time step were updated according to EquationEquation 29(29)
(29) . After the recovery process’s completion, baseline serviceability values of Owls Head, Coney Island, and Rockaway WWTPs over time were determined. Then, the operabilities of INM components were reset to their initial states, and the genetic algorithm was utilized to obtain the optimized RS and the planned serviceability values based on EquationEquation 30
(30)
(30) . Finally, the INM was reinitialized to its pre-disaster status.
To account for uncertainties in the state of the affected assets, the recovery process discussed above was simulated for 100 realizations. Based on the size of the INM and the computational effort and time for each simulation, 100 realizations were deemed enough. For actual implementation, 500 realizations are suggested. Each realization commences with comparing the failure probabilities of network components against newly generated random numbers to determine initial operability states. This allows considering various disruption scenarios that result in different recovery paths for the network infrastructure. Eventually, baseline and planned recovery curves for the three WWTP nodes in the INM were obtained by finding the expected value of their serviceability over all realizations in each time step. illustrates the recovery curves and corresponding optimized resilience values for the WWTPs.
Figure 13. The recovery curves and their corresponded resilience metrics obtained from the INM before and after the optimization.
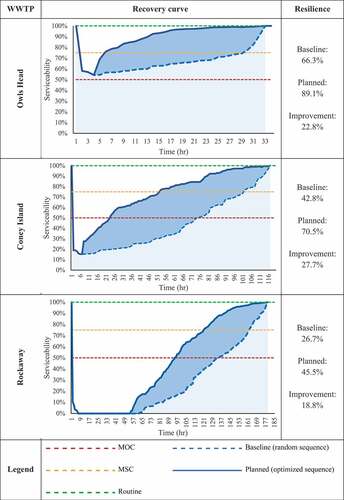
According to , the Owls Head WWTP’s serviceability does not drop below 50% at any point in the simulation period, denoting that the primary treatment would not be stopped. In this plant, the MSC is achieved in a shorter time compared to the other two WWTPs. After the optimization, the resilience of this WWTP increased from 66.3% to 89.1%. The optimization improves the resilience of Coney Island WWTP the highest, experiencing a 27.7% increase in its performance-based resilience metric. This plant reaches its MOC and MSC approximately two days sooner when the optimized RS is implemented.
The Rockaway WWTP is entirely offline in the first 53 hours of the simulation period. This can be due to more prolonged and higher levels of inundation in the Rockaway sewershed and the vulnerability of the power infrastructure in this area. Both substations serving this plant were disrupted and damaged severely during the storm (Balci & Cohn, Citation2014). However, the asset restoration optimization that least affected this plant improved its resilience from 26.7% to 45.5%. The Rockaway WWTP has limited interdependencies, so prioritizing its network components leads to a relatively insignificant outcome for the resilience improvement process.
Overall, MOC and MSC levels show good agreement with reports on the serviceability interruptions of WWTPs during Superstorm Sandy. After the storm, the Owls Head plant’s secondary treatment was only interrupted for approximately five hours. Meanwhile, the Coney Island WWTP was completely offline for 12 hours and regained its routine serviceability after four days. The Rockaway WWTP was severely inundated during Superstorm Sandy. Despite the many preventive measures taken by the plant’s staff and their efforts to recover the equipment, it took two full weeks to return to the routine service level (NYCDEP (New York City Department of Environmental Protection), Citation2013).
4.4. Prioritized asset restoration
By prioritizing the restoration of failed assets, the WWTPs’ service levels after flooding will be improved noticeably. After each realization, assets within the infrastructure network were graded based on obtained optimized sequences and EquationEquations 32(32)
(32) and Equation33
(33)
(33) . The final scores of each INM component were calculated according to EquationEquations 34
(34)
(34) and Equation35
(35)
(35) . The restoration priorities of network components were then classified into low, moderate, high, and crucial classes based on the classification scheme in . The restoration priority of each network component in the study area is illustrated in .
Figure 14. Prioritized network components for restoration in the study area.
Based on , the restoration priority of most of the assets in the Rockaway sewershed is classified as crucial. The Owls Head sewershed experiences the lowest inundation. However, due to the high dependency of other components in the INM on the performance of the assets located in this sewershed, two components have been given a relatively crucial priority while the majority are classified as low or medium. Substations S5 and S8 are classified as crucial because of their flood-prone location, while other substations placed at the Coney Island sewershed have been given a low priority. Moreover, Coney Island and Rockaway WWTPs are both classified as crucial, while the Owls Head plant’s restoration priority is low.
In order to validate the proposed scoring scheme, the performance-based resilience metrics are calculated once more based on the final RS. Resilience values for WWTPs Owls Head, Coney Island, and Rockaway were calculated as 83.3%, 61.8%, and 42.1%, respectively. These values show about 90% acceptance with the resilience values obtained from averaging the optimization results.
The overall framework of this study provides a template for improving WWTPs’ resilience during and after flood hazards. Attribute-based and performance-based resilience metrics are developed, and improvement measures are proposed to assist in the planning of resilient AMPs. The Coney Island WWTP had the lowest attribute-based metric resilience improvement, while its post-storm recovery resilience (performance-based metric) could be significantly enhanced. The Rockaway WWTP showed the exact opposite effect. In contrast, the Owls Head WWTP’s resilience improvement was moderately affected by both approaches. These observations demonstrated both methods’ range and applicability in composing resilience enhancement strategies. The results have also benefited from incorporating uncertainties and imprecisions in the modeling process. The findings of this study revealed how WWTP’s resilience could be enhanced by improving the resource allocation schemes of these plants and prioritizing the restoration of the infrastructure network. It provides new insight into the decision-making process by providing practical tools and resilience measures.
5. Summary and conclusion
Treatment failure of coastal WWTPs and interruptions in maintaining their service levels due to floods will result in grave environmental consequences. Therefore, the resilience of these systems has become of great concern. The present study proposes an attribute-based resilience metric that addresses the imprecisions associated with the subjective inputs of experts by utilizing an FMCDM method. Next, a framework has been designed to allocate limited financial resources to improve their resilience. This part of the study looks at the overall resistance of the system in facing an extreme flood event such as Superstorm Sandy.
By considering the interdependencies among wastewater and power infrastructures, a performance-based resilience metric methodology is also calculated to prioritize the restoration of assets within the infrastructure network. This part of the study concentrates on recovery efforts after the storm. Interconnected assets in the study area are classified into four states of urgency to restore. Restoration crews can plan their restoration efforts according to this classification in order to improve the WWTPs’ resilience. The study area selected for implementing this methodology is the flood-prone districts of Southern Brooklyn and Rockaway in New York City.
The fuzzy attribute-based resilience assessment placed the Owls Head WWTP as the plant with the highest resilience metric and the Rockaway as the least resilient plant. $41.6 million that the city had planned to allocate to these plants after Sandy was redistributed among the WWTPs and compared with their actual share. According to this study, the reallocation of $14.6, $14.8, and $12.2 million to WWTPs of Owls Head, Coney Island, and Rockaway, respectively, resulted in increases in their attribute-based metric by 6.6%, 5.1%, and 11.4%. Moreover, by comparing the fuzzy attribute-based method with its corresponding crisp method, it can be stated that utilizing FMCDM methods can show the range of overestimation or underestimation of resilience. Therefore, having the range of resilience variation, decision makers can consider a value in that range depending upon their risk-taking attitude.
The simulated post-disaster behavior of the infrastructure network showed the performance-based resilience metrics of the three WWTPs to be in the same order as was obtained from the attribute-based method. This seems relevant even though the two approaches are not entirely compatible. Recovery curves obtained from 100 INM realizations illustrated the improved resilience values when the restoration of damaged assets was prioritized. The Coney Island WWTP demonstrated the most considerable improvement in its resilience since it is well-connected to other assets in the infrastructure network. By contrast, the Rockaway plant’s resilience was least improved due to the limited number of interdependencies and its flood-prone location, even though network components in this sewershed are classified as either crucial or high to be repaired.
The results of this study show how well the food hazard could be simulated, and the WWTPs’ resilience could be quantified in line with the consequences that NYCDEP documented. In addition, it is demonstrated how the resilience metrics can be used for resource allocation and asset restoration planning. The proposed methodology can be applied to other coastal regions. One limitation of the proposed attribute-based method is the sensitivity of its results to the type of the chosen fuzzy membership function. Therefore, a sensitivity analysis should be performed by considering various membership functions and fuzzy scales for actual implementation of the proposed mythology. The suggested performance-based approach can be enhanced to reflect the recovery process in practice more accurately. One suggestion for enhancement is to take into account other interdependent infrastructures, such as communication and transportation. Results from the INM can also benefit by creating unique FCs for each WWTP. Furthermore, the accuracy of recovery curves can be further enhanced by considering partial operability states in the interval for the assets (especially WWTPs).
Abbreviation
AHP, Analytic Hierarchy Process; AMP, Asset management programs; DEM, Digital Elevation Model; ESC, Economic Sub-Criteria; FC, Fragility Curves; FAHP, Fuzzy Analytic Hierarchy Process; FMCDM, Fuzzy multi-criteria decision-making; GIS, Geographic information system; INM, Interdependency Network Model; MNP, Maximizing the Nash product; MOC, Minimum Operational Capability; MSC, Minimum Sustainable Capability; RS, Restoration Sequence; GSSHA, The Gridded Surface Subsurface Hydrologic Analysis; NYCDEP, The New York City Department of Environmental Protection; TNF, Triangular Fuzzy Number; UF, Utility Function; WWTP, Wastewater Treatment Plants
Disclosure statement
The Coalition for Disaster Resilient Infrastructure (CDRI) reviewed the anonymised abstract of the article, but had no role in the peer review process nor the final editorial decision.
Additional information
Funding
References
- Abdullah, L., Chan, W., & Afshari, A. (2019). Application of PROMETHEE method for green supplier selection: A comparative result based on preference functions. Journal of Industrial Engineering International, 15(2), 271–285. https://doi.org/10.1007/s40092-018-0289-z
- Almoghathawi, Y., González, A. D., & Barker, K. (2021). Exploring recovery strategies for optimal interdependent infrastructure network resilience. Networks and Spatial Economics, 21(1), 229–260. https://doi.org/10.1007/s11067-020-09515-4 .
- Anaokar, G., Khambete, A., & Christian, R. (2018). Evaluation of a performance index for municipal wastewater treatment plants using MCDM – TOPSIS. International Journal of Technology, 9(4), 715. https://doi.org/10.14716/ijtech.v9i4.102
- Balci, P., & Cohn, A. (2014). NYC wastewater resiliency plan: climate risk assessment and adaptation. Icsi, 2014, 246–256. https://doi.org/10.1061/9780784478745.021
- Behzadian, M., Kazemzadeh, R. B., Albadvi, A., & Aghdasi, M. (2010). PROMETHEE: A comprehensive literature review on methodologies and applications. European Journal of Operational Research, 200(1), 198–215. https://doi.org/10.1016/j.ejor.2009.01.021
- Binmore, K., Rubinstein, A., & Wolinsky, A. (1986). The Nash bargaining solution in economic modelling. Journal of Economics, 17(2), 176–188. https://doi.org/10.2307/2555382
- Blake, E. S., Kimberlain, T. B., Berg, R. J., Cangialosi, J. P., & Beven Ii, J. L. (2013). Tropical cyclone report: Hurricane sandy. National Hurricane Center, 12, 1-10.
- Bristow, D. N. (2015). Asset system of systems resilience planning: The Toronto case. Infrastructure Asset Management, 2(1), 15–22. https://doi.org/10.1680/iasma.14.00044
- Bruneau, M., Chang, S. E., Eguchi, R. T., Lee, G. C., O’Rourke, T. D., Reinhorn, A. M., Shinozuka, M., Tierney, K., Wallace, W. A., & von Winterfeldt, D. (2003). A framework to quantitatively assess and enhance the seismic resilience of communities. Earthquake Spectra, 19(4), 733–752. https://doi.org/10.1193/1.1623497
- Bruneau, M., & Reinhorn, A. (2007). Exploring the concept of seismic resilience for acute care facilities. Earthquake Spectra, 23(1), 41–62. https://doi.org/10.1193/1.2431396
- Buckley, J. J. (1985). Fuzzy hierarchical analysis. Fuzzy Sets and Systems, 17(3), 233–247. https://doi.org/10.1016/0165-0114(85)90090-9
- Chang, D.-Y. (1996). Applications of the extent analysis method on fuzzy AHP. European Journal of Operational Research, 95(3), 649–655. https://doi.org/10.1016/0377-2217(95)00300-2
- Chen, V. Y. C., Lien, H. P., Liu, C. H., Liou, J. J. H., Tzeng, G. H., & Yang, L. S. (2011). Fuzzy MCDM approach for selecting the best environment-watershed plan. Applied Soft Computing Journal, 11(1), 265–275. https://doi.org/10.1016/j.asoc.2009.11.017
- Dewalkar, S. V., & Shastri, S. S. (2022). Integrated life cycle assessment and life cycle cost assessment based fuzzy multi-criteria decision-making approach for selection of appropriate wastewater treatment system. Journal of Water Process Engineering, 45, 102476. https://doi.org/10.1016/j.jwpe.2021.102476
- Downer, C. W., & Ogden, F. L. (2004). GSSHA: Model to simulate diverse stream flow producing processes. Journal of Hydrologic Engineering, 9(3), 161–174. https://doi.org/10.1061/(ASCE)1084-0699(2004)9:3(161)
- Duijnhoven, H., Nieuwenhuijs, A., van den Brink, P., Stolk, D., & van Ruijven, T. (2017). Critical infrastructure resilience: bridging the gap between measuring and governance. 7th REA Symposium. http://improverproject.eu/category/results/
- FEMA. (2003). Multi-hazard loss estimation methodology, Earthquake model, HAZUS, technical manual. Federal Emergency Management Agency.
- FEMA. (2013). Multi-hazard loss estimation methodology, Flood model, HAZUS, technical manual. Federal Emergency Management Agency. www.msc.fema.gov
- Gay, L. F., Sinha, S. K. (2013). Resilience of civil infrastructure systems: Literature review for improved asset management. International Journal of Critical Infrastructures, 9(4). .330–350. https://doi.org/10.1504/IJCIS.2013.058172
- Gogus, O., & Boucher, T. O. (1998). Strong transitivity, rationality and weak monotonicity in fuzzy pairwise comparisons. Fuzzy Sets and Systems, 94(1), 133–144. https://doi.org/10.1016/S0165-0114(96)00184-4
- Guidotti, R., Chmielewski, H., Unnikrishnan, V., Gardoni, P., McAllister, T., & van de Lindt, J. (2016). Modeling the resilience of critical infrastructure: The role of network dependencies. Sustainable and Resilient Infrastructure, 1(3–4), 153–168. https://doi.org/10.1080/23789689.2016.1254999
- Hay, A. H. (2016). The incident sequence as resilience planning framework. Infrastructure Asset Management, 3(2), 55–60. https://doi.org/10.1680/jinam.16.00003
- He, X., & Cha, E. J. (2018). Modeling the damage and recovery of interdependent critical infrastructure systems from natural hazards. Reliability Engineering & System Safety, 177, 162–175. https://doi.org/10.1016/j.ress.2018.04.029
- He, X., & Cha, E. J. (2020). Modeling the damage and recovery of interdependent civil infrastructure network using dynamic integrated network model. Sustainable and Resilient Infrastructure, 5(3), 152–167. https://doi.org/10.1080/23789689.2018.1448662
- Henry, D., & Emmanuel Ramirez-Marquez, J. (2012). Generic metrics and quantitative approaches for system resilience as a function of time. Reliability Engineering and System Safety, 99, 114–122. https://doi.org/10.1016/j.ress.2011.09.002
- Hosseini, S., Barker, K., & Ramirez-Marquez, J. E. (2016). A review of definitions and measures of system resilience. Reliability Engineering & System Safety, 145, 47–61. https://doi.org/10.1016/j.ress.2015.08.006
- Imani, M., & Hajializadeh, D. (2020). A resilience assessment framework for critical infrastructure networks’ interdependencies. Water Science and Technology, 81(7), 1420–1431. https://doi.org/10.2166/wst.2019.367
- Kabir, G., & Ahsan Akhtar Hasin, M. 2011. Comparative analysis of ahp and fuzzy ahp models for multicriteria inventory classification. International Journal of Fuzzy Logic Systems (IJFLS) 1(1), 1–16. https://wireilla.com/papers/ijfls/V1N1/1011ijfls01
- Karamlou, A., & Bocchini, P. (2015). Computation of bridge seismic fragility by large-scale simulation for probabilistic resilience analysis. Earthquake Engineering and Structural Dynamics, 44(12), 1959–1978. https://doi.org/10.1002/eqe.2567
- Karamouz, M., & Fereshtehpour, M. (2019). Modeling DEM errors in coastal flood inundation and damages: A spatial nonstationary approach. Water Resources Research, 55(8), 6606–6624. https://doi.org/10.1029/2018WR024562
- Karamouz, M., & Hojjat-Ansari, A. (2020). Uncertainty based budget allocation of wastewater infrastructures’ flood resiliency considering interdependencies. Journal of Hydroinformatics, 22(4), 768–792. https://doi.org/10.2166/hydro.2020.145
- Karamouz, M., & Movahhed, M. (2021). Asset management based flood resiliency of water infrastructure. World Environmental and Water Resources Congress, 2021, 1081–1091. https://doi.org/10.1061/9780784483466.101
- Karamouz, M., Nazif, S., & Razmi, A. (2014). Integration of coastal storm inundation model (GSSHA) with grid surface and subsurface hydrological model. World Environmental and Water Resources Congress, 2014, 887–898. https://doi.org/10.1061/9780784413548.092
- Karamouz, M., Rasoulnia, E., Olyaei, M. A., & Zahmatkesh, Z. (2018). Prioritizing investments in improving flood resilience and reliability of wastewater treatment infrastructure. Journal of Infrastructure Systems, 24(4. https://doi.org/10.1061/(asce)is.1943-555x.0000434
- Karamouz, M., Rasoulnia, E., Zahmatkesh, Z., Olyaei, M. A., & Baghvand, A. (2016). Uncertainty-based flood resiliency evaluation of wastewater treatment plants. Journal of Hydroinformatics, 18(6), 990–1006. https://doi.org/10.2166/hydro.2016.084
- Karamouz, M., Zoghi, A., & Mahmoudi, S. (2022). Flood modeling in coastal cities and flow through vegetated BMPs: A conceptual design. Journal of Hydrologic Engineering, 27(10). https://doi.org/10.1061/(ASCE)HE.1943-5584.0002206
- Kaya, İ., Çolak, M., & Terzi, F. (2019). A comprehensive review of fuzzy multi criteria decision making methodologies for energy policy making. Energy Strategy Reviews, 24(March), 207–228. https://doi.org/10.1016/j.esr.2019.03.003
- Kong, J., & Simonovic, S. P. (2016). An original model of infrastructure system resilience. Proceedings, Annual Conference - Canadian Society for Civil Engineering, 3, 1771–1781.
- Kong, J., Simonovic, S. P., & Zhang, C. (2019). Sequential hazards resilience of interdependent infrastructure system: A case study of greater Toronto area energy infrastructure system. Risk Analysis, 39(5), 1141–1168. https://doi.org/10.1111/risa.13222
- Kurtz, S. S. J., Saur, G., & Ainscough, C. (2013). Utilization of underground and overhead power lines in the city of New York. Office of Long-Term Planning and Sustainability, Office of the Mayor, City of New York.
- Lafortezza, R., Chen, J., van den Bosch, C. K., & Randrup, T. B. (2018). Nature-based solutions for resilient landscapes and cities. Environmental Research, 165, 431–441. https://doi.org/10.1016/j.envres.2017.11.038
- Liu, Y., Eckert, C. M., & Earl, C. (2020). A review of fuzzy AHP methods for decision-making with subjective judgements. Expert Systems with Applications, 161, 113738. https://doi.org/10.1016/j.eswa.2020.113738
- Ma, L., Bocchini, P., & Christou, V. (2020). Fragility models of electrical conductors in power transmission networks subjected to hurricanes. Structural Safety, 82, 101890. https://doi.org/10.1016/j.strusafe.2019.101890
- Malano, H. M., Chien, N. V., & Turral, H. N. (1999). Asset management for irrigation and drainage infrastructure. Irrigation and Drainage Systems, 13(2), 109–129. https://doi.org/10.1023/A:1006254924281
- Noori, A., Bonakdari, H., Salimi, A. H., & Gharabaghi, B. (2021). A group multi-criteria decision-making method for water supply choice optimization. Socio-Economic Planning Sciences, 77(December), 101006. https://doi.org/10.1016/j.seps.2020.101006
- NYCDEP (NewYork City Department of Environmental Protection). (2013). NYC wastewater resiliency plan, climate risk assessment and adaptation study. Department of Environmental Protection, New York City, USA.
- OECD. (2021). Building resilience: New strategies for strengthening infrastructure resilience and maintenance. OECD Public Governance Policy Papers, No. 05, OECD Publishing, Paris. https://doi.org/10.1787/354aa2aa-en
- Olyaei, M. A., Karamouz, M., & Farmani, R. (2018). Framework for assessing flood reliability and resilience of wastewater treatment plants. Journal of Environmental Engineering, 144(9. https://doi.org/10.1061/(asce)ee.1943-7870.0001422
- Ouyang, M. (2014). Review on modeling and simulation of interdependent critical infrastructure systems. Reliability Engineering & System Safety, 121, 43–60. https://doi.org/10.1016/j.ress.2013.06.040
- Ouyang, M., & Dueñas-Osorio, L. (2014). Multi-dimensional hurricane resilience assessment of electric power systems. Structural Safety, 48, 15–24. https://doi.org/10.1016/j.strusafe.2014.01.001
- Reed, D. A., Kapur, K. C., & Christie, R. D. (2009). Methodology for assessing the resilience of networked infrastructure. IEEE Systems Journal, 3(2), 174–180. https://doi.org/10.1109/JSYST.2009.2017396
- Rinaldi, S. M. (2004). Modeling and simulating critical infrastructures and their interdependencies. 37th Annual Hawaii International Conference on System Sciences, 2004. Proceedings of The, 37, 8 pp. https://doi.org/10.1109/HICSS.2004.1265180
- Saaty, R. W. (1987). The analytic hierarchy process-what it is and how it is used Mathematical Modelling, 9(5):161–176. https://doi.org/10.1016/0270-0255(87)90473-8
- Salman, A. M., & Li, Y. (2016). Age-dependent fragility and life-cycle cost analysis of wood and steel power distribution Poles subjected to hurricanes. Structure and Infrastructure Engineering, 12(8), 890–903. https://doi.org/10.1080/15732479.2015.1053949
- Sánchez-Muñoz, D., Domínguez-García, J. L., Martínez-Gomariz, E., Russo, B., Stevens, J., & Pardo, M. (2020). Electrical grid risk assessment against flooding in Barcelona and Bristol cities. Sustainability, 12(4), 1527. https://doi.org/10.3390/su12041527
- Schoen, M., Hawkins, T., Xue, X., Ma, C., Garland, J., & Ashbolt, N. J. (2015). Technologic resilience assessment of coastal community water and wastewater service options. Sustainability of Water Quality and Ecology, 6, 75–87. https://doi.org/10.1016/j.swaqe.2015.05.001
- Shin, S., Lee, S., Judi, D. R., Parvania, M., Goharian, E., McPherson, T., & Burian, S. J. (2018). Water (Switzerland), 10(2):164–188. https://doi.org/10.3390/w10020164.
- Simonovic, S. P., & Peck, A. (2013). Dynamic resilience to climate change caused natural disasters in coastal megacities quantification framework. British Journal of Environment and Climate Change, 3(3), 378–401. https://doi.org/10.9734/BJECC/2013/2504
- Sitorus, F., Cilliers, J. J., & Brito-Parada, P. R. (2019). Multi-criteria decision making for the choice problem in mining and mineral processing: Applications and trends. Expert Systems with Applications, 121, 393–417. https://doi.org/10.1016/j.eswa.2018.12.001
- Sun, W., Bocchini, P., & Davison, B. D. (2020). Sustainable and Resilient Infrastructure, 5(3): 168–199.https://doi.org/10.1080/23789689.2018.1448663
- Sweetapple, C., Fu, G., Farmani, R., & Butler, D. (2022). General resilience: Conceptual formulation and quantitative assessment for intervention development in the urban wastewater system. Water Research, 211. https://doi.org/10.1016/j.watres.2022.118108
- Tahmasebi Birgani, Y., & Yazdandoost, F. (2018). An integrated framework to evaluate resilient-sustainable urban drainage management plans using a combined-adaptive MCDM technique. Water Resources Management, 32(8), 2817–2835. https://doi.org/10.1007/s11269-018-1960-2
- Tong, L., Pu, Z., Chen, K., & Yi, J. (2020). Sustainable maintenance supplier performance evaluation based on an extend fuzzy PROMETHEE II approach in petrochemical industry. Journal of Cleaner Production, 273, 122771. https://doi.org/10.1016/j.jclepro.2020.122771
- Vugrin, E., Castillo, A., & Silva-Monroy, C. (2017). Resilience metrics for the electric power system: A performance-based approach. https://doi.org/10.2172/1367499
- Wu, Y., Wang, Y., Chen, K., Xu, C., & Li, L. (2017). Social sustainability assessment of small hydropower with hesitant PROMETHEE method. Sustainable Cities and Society, 35, 522–537. https://doi.org/10.1016/j.scs.2017.08.034
- Xiao, F. (2019). EFMCDM: Evidential fuzzy multicriteria decision making based on belief entropy. IEEE Transactions on Fuzzy Systems, 28(7), 1. https://doi.org/10.1109/TFUZZ.2019.2936368
- Yu, J.-Z., Whitman, M., Kermanshah, A., & Baroud, H. (2021). A hierarchical Bayesian approach for assessing infrastructure networks serviceability under uncertainty: A case study of water distribution systems. Reliability Engineering & System Safety, 215(July 2020), 107735. https://doi.org/10.1016/j.ress.2021.107735
- Zamani, R., Ali, A. M. A., & Roozbahani, A. (2020). Evaluation of adaptation scenarios for climate change impacts on agricultural water allocation using fuzzy MCDM methods. Water Resources Management, 34(3), 1093–1110. https://doi.org/10.1007/s11269-020-02486-8
Appendix A
The detailed description of the sub-criteria utilized in this study are tabulated in .
Table A1. Descriptions of sub-criteria.
Gogus and Boucher (Citation1998) showed how the consistency ratio in the FAHP method can be estimated. They also generated random indices using a sample size of 400. The same procedure was used in this paper.