
 ?Mathematical formulae have been encoded as MathML and are displayed in this HTML version using MathJax in order to improve their display. Uncheck the box to turn MathJax off. This feature requires Javascript. Click on a formula to zoom.
ABSTRACT
With increasing investment in infrastructure to address flooding, including green and grey solutions, there are challenges in selecting the type and location of infrastructure. This paper proposes a method to prioritize locations for stormwater infrastructure. Compared to prior work, it considers both green and grey infrastructure and enables detailed spatial analysis of a community. It uses quantitative measures and includes the multiple potential benefits of green versus grey infrastructure. The method is applied to the coastal county of Chatham County, GA, USA. Results show how the methodology is used to select green or grey infrastructure solutions and highlight locations that should be prioritized for infrastructure investment. Analyses accounting for uncertainties in future climate projections and population estimates are also conducted. The method includes local community characteristics, results in clear placement locations, and with decision-maker input, enables solutions to be adapted as stakeholder priorities evolve to increase community flood resilience.
1. Introduction
Climate change is leading to increased flooding in many areas around the globe. With increased global temperatures, sea levels are rising and there are more frequent storms with increasing water temperatures (Kundzewicz et al., Citation2014). In the United States, the eastern shore in particular faces increased flooding due to its low topography and the prevalent location of tropical storms (Ghanbari et al., Citation2021). This increased flooding has resulted in significant degradation, damage, and destruction of structures and infrastructure during previous storm events (Brody et al., Citation2011). Increasing community resilience to flooding requires increased investment in flood protection infrastructure to address flooding and climate effects (Johansen et al., Citation2017). Stormwater infrastructure in particular has been identified as being in poor condition across the country and being in need of significant additional investment, receiving a grade of D from the American Society of Civil Engineers in its 2021 Infrastructure Report Card Stormwater, Citation2021). Combining the continued degradation of existing stormwater infrastructure, the increase in the extent of impervious surfaces in communities, and the effects of climate change, many existing systems are operating in conditions exceeding their design capacities. Additional infrastructure solutions need to be implemented to increase community flood resilience. However, there are challenges in selecting what type of solution to implement, and where to build new infrastructure, particularly in accounting for the complexities of factors across a community and considering the multiple potential benefits of varying infrastructure solutions.
To address more frequent flooding, communities are investing in one or two types of infrastructure: grey or green. The focus of this work is on stormwater infrastructure located among community populations, rather than coastal projects such as building seawalls, oyster reefs, or mangrove forests. Grey infrastructure includes traditional hard-scaped structures that are typically made of concrete and metal such as pipes, storm drains, and culverts (Martínez et al., Citation2021). They are designed to withstand extreme flooding scenarios and limit the extent of flooding in a community by protecting as many structures and people as possible. However, in addition to being associated with higher emissions, they are limited in the additional environmental, public health, and social benefits they can provide (De Sousa et al., Citation2012). Green infrastructure, sometimes known as low-impact development, are solutions that are more nature-based such as bioswales, green roofs, rain gardens, and retention ponds (Shafique & Kim, Citation2017). They are designed to slow down the effect of flooding rather than keep water out entirely, which either is enough to allow environmental systems to then perform their natural flood protective functions (e.g., retaining and filtering water) or gives community members time to evacuate. Green infrastructure can include a variety of benefits outside of flood protection including improving air quality, protecting natural habitats, and providing communities spaces to gather (Vineyard et al., Citation2015). However, these solutions tend to have higher total costs (initial investment, and maintenance and operation costs) than grey infrastructure solutions, and would not be selected under a cost-benefit analysis compared to grey infrastructure if only considering the benefit of flood reduction (Alves et al., Citation2019). Therefore, it is important to consider multiple factors when making an infrastructure investment decision and place infrastructure solutions where they are most needed (Garcia-Cuerva et al., Citation2018).
Further, the solution for locating infrastructure must be adaptable to community priorities that may change over time. This work provides a way to input new variables of interest to a community, input new weightings of those variables, and change the scope of infrastructure solutions based on changing community priorities. For example, infrastructure solutions may need to change if and when public opinion changes such as shifting to prioritizing green infrastructure or populations wanting different features of a design. These changes can be incorporated into the proposed approach by varying the weighting of variables in the analysis such as weighting the benefits of green infrastructure more, or by including additional or replacement variables to capture new features of importance for a design. In addition, there is uncertainty present when planning for the future of communities. This work explores whether designs can be adaptable by analyzing uncertainties in the benefits and changing the suggested solutions. Designs after locations are selected can adapt to change by being over-designed (e.g., considering a higher level of future sea level rise) and setting aside funds for updating throughout or at the end of their design life.
An additional important consideration in locating flood mitigation infrastructure in a community is the characteristics and vulnerabilities of the populations impacted. Investing in infrastructure needs to be done with not only sustainability and resilience but also equity, in mind (Tien, Citation2022). Marginalized communities, ones that are lower income, and are often composed of Black and Indigenous people of color, BIPOC, disproportionately face the brunt of climate change and increased flood risk. A marginalized community’s ability to be resilient to disasters can be diminished by poverty, lack of access to transportation, and crowded housing. These neighborhoods are often built in lower-lying, more flood-prone areas, making their homes and neighborhoods the most at risk (Sterzel et al., Citation2020). Structures associated with grey infrastructure solutions have historically been placed in marginalized communities (Garcia-Cuerva et al., Citation2018). Though they are designed to prevent flooding, they can decrease community quality of life by partitioning off sections of the neighborhood with hardscape and can worsen air quality during construction. To attempt to make marginalized communities more resilient, there has been increased recent interest in other types of infrastructure such as green infrastructure solutions. Socially vulnerable populations are also particularly exposed during flooding events. Children and the elderly, for example, often need assistance to transport themselves to safety and rely on other people for financial support, weakening their ability to reduce human suffering and financial loss in a disaster (CDC/ATSDR SVI Fact Sheet | Place and Health | ATSDR, Citation2021). However, due to the systemic issues impacting health and resource availability in marginalized communities, the additional benefits of green infrastructure can be particularly impactful in these neighborhoods, i.e., to combat reduced social and environmental services compared with advantaged communities (Garcia-Cuerva et al., Citation2018), while both green and grey infrastructure solutions can benefit socially vulnerable populations in terms of increasing flood protection. Therefore, flood infrastructure investments need to be made, especially in marginalized communities, considering varying community factors to ensure they are addressing community needs and can withstand the impacts of continued climate change.
Deciding where to invest in green and grey infrastructure across a flood-prone community and finding the threshold between either investment at a particular location is not well understood. This paper proposes a method to prioritize locations for flood infrastructure solutions. Compared to prior work, it considers both green and grey infrastructure solutions and analyzes the community in its entirety, rather than one site at a time. The method is based on a spatial mapping approach and includes multiple factors across a community and the multiple potential benefits of green versus grey infrastructure solutions. In addition, it includes decision-maker input to provide communities with a pathway to decide on where to place new infrastructure including specific local community characteristics and based on where stakeholder priorities lie. The method results in clear prioritized locations and enables the solution locations to be adapted as community and decision-maker priorities evolve. The method is applied to analyze locations in Chatham County, GA, a community subject to flooding on the eastern shore of the United States, where the research team is collaborating with local officials on solutions to mitigate flood risk. Results show how the method can be used to support decision-making in locating green and grey infrastructure solutions to increase community flood resilience.
The rest of the paper is organized as follows. The following section provides background and describes related previous work in flood infrastructure decision-making. The next section describes the proposed spatial mapping method, including the varying infrastructure benefits considered and corresponding variables included in the analysis, the creation of spatial indices, and the mapping implementation used to generate results. The proposed methodology is applied to analyze locations in Chatham County, GA. The study area is described, and results are presented, including weighted and unweighted maps based on stakeholder preferences and priorities. Analyses accounting for uncertainty in future climate projections and uncertainty in community population estimates are also conducted. Results show how the methodology can be used to select green or grey stormwater infrastructure solutions, and to highlight the locations that should be prioritized for future infrastructure investment, after additional site analysis is performed, based on quantitative spatial indicators.
2. Background and Related Work
Previous research in flood mitigation decision-making includes conducting cost-benefit analyses (Alves et al., Citation2019; Alves et al., Citation2020; Vojinovic et al., Citation2017) exploring the benefits needed from an infrastructure solution to warrant the cost. Comparing grey and green flood mitigation solutions using these analyses is complex and can be misleading given the difficulty in capturing, quantifying, and weighing the potential benefits of green infrastructure versus the likely lower initial costs of grey infrastructure. What these studies have shown is the importance of considering multiple benefits and objectives in making flood infrastructure decisions. For example, if not just flood reduction benefits are considered, green infrastructure and combinations of green and grey infrastructure become more competitive under a cost-benefit analysis compared with grey infrastructure options (Alves et al., Citation2019). Also, if combined green and grey infrastructure designs are used, their total benefits can exceed their costs (Dong et al., Citation2017; Alves et al., Citation2020). However, these previous studies on combinations of green and grey infrastructure solutions have been based in China and the Netherlands. In comparison, the approach and historical development of flood risk management in the United States are different. Additional factors, particularly related to community factors and population social vulnerability measures, need to be taken into account when considering increasing flood resilience in U.S. communities.
Other studies on flood mitigation decision-making implement different multi-criteria decision analyses (Young et al., Citation2009; Boroushaki & Malczewski, Citation2010; Zagonari & Rossi, Citation2013; Ghanbarpour et al., Citation2013; Alves et al., Citation2018a; Ruangpan et al., Citation2021). The multi-criteria decision analyses include multiple variables indicative of the benefits of an infrastructure design and ranks them to form a score for each design, selecting the winning infrastructure solution based on the highest score. However, in several of these studies, there is no consideration of the differences in the potential benefits of green versus grey infrastructure (Boroushaki & Malczewski, Citation2010; Zagonari & Rossi, Citation2013; Ghanbarpour et al., Citation2013), while previous work has found the importance of considering the multiple co-benefits of green infrastructure (Alves et al., Citation2019). In addition, many of these studies do not provide a spatial analysis to be able to prioritize or select locations for placing infrastructure solutions (Young et al., Citation2009; Alves et al., Citation2018a; Ruangpan et al., Citation2021). Those that consider some spatial analysis in the work include (Boroushaki & Malczewski, Citation2010), which selects for a location. However, the location is not tied to a specific solution, as is done in this work, which selects specific locations for green or grey infrastructure and gives the services and benefits that should be emphasized at a specific selected location. In fact, the results of this work and implementing the proposed method show that it is essential to consider both the infrastructure solution type and potential locations together as the prioritized locations will change based on community priorities and the types of infrastructure considered. (Zagonari & Rossi, Citation2013) recognizes that maps can be useful for communication with community stakeholders but does not provide any mapping-based results as an outcome of the work. (Ghanbarpour et al., Citation2013) maps inundation over an area but not the locations of potential infrastructure solutions.
Multi-criteria decision analysis requires assigning rankings to different criteria of relevance to the problem. Previous studies using this approach are often based on results from a community survey among public officials to obtain different rankings of the benefits that are the most important to them (Ruangpan et al., Citation2021; Alves et al., Citation2020). Results from these surveys often reveal inherent biases among government officials, which has been attributed to officials taking a preference towards issues they know the most about (Nguyen et al., Citation2019). Some have tried combating this by considering and weighing the knowledge of different government officials based on their expertise (Zagonari & Rossi, Citation2013). In this work, the authors include the ability to include decision-maker preferences, including preferences for addressing issues surrounding their knowledge base. Implementing the proposed method shows how the results differ based on particular preferences. We also combine preferences across stakeholders to minimize the impact of potential individual biases on the results. Overall, multi-criterion decision analysis has the issue of combining different weights into a single metric and can lead to an incomplete picture of what a community needs and is only one step in the process of deciding on a flood mitigation design. In addition, there is the need to be able to determine where a given identified infrastructure solution should be located. While in this work, the authors include the ability to include prioritizations from municipal officials in the selection of infrastructure location solutions, the method integrates decision-maker priorities with a spatial mapping approach to obtain solution locations, whereas previous works considering stakeholder preferences do not analyze a community spatially. The method provides index values plotted spatially for green and grey infrastructure solutions along with the different types of benefits to enable community leaders to visualize the basis of the location prioritizations and allow them to adapt to varying community priorities before making a final decision.
Previous spatial analysis-based studies have been conducted to determine potential sites for locating flood mitigation infrastructure and the best locations are given available funding. These include detailed analyses of individual sites for the suitability of infrastructure. It is well understood in the literature that green and grey infrastructure solutions can work well in combination in a community, but few studies include more detailed approaches in specifically selecting locations that consider both green and grey infrastructure (Alves et al., Citation2018b; Daxikar et al., Citation2012). These previous studies fail to consider green and grey infrastructure together in a location-based approach, which is necessary to comprehensively assess potential infrastructure locations to mitigate flood risk in a community. A holistic framework supported by spatial data is needed to support decision-makers in ranking and prioritizing grey and green infrastructure flood mitigation locations. This work presents such a framework. It can be customized for a given community and allows decision-makers to consider and visualize results along multiple dimensions. Providing multiple scenarios, including a large set of possible benefits for green and grey infrastructure, enables communities to comprehensively assess the potential benefits of varying infrastructure solutions in their analyses.
3. Methods
The proposed spatial mapping method considers multiple variables for both green and grey infrastructure to account for the range of benefits provided by these infrastructure solutions. These variables and benefits are then converted into spatial indices to allow comparison across variables. The values can be weighted based on decision-maker priorities. The resulting values are implemented through spatial mapping to enable analysis and visualization of the results across a community. The results highlight the locations that should be prioritized based on the defined variables and associated values for each potential location. The overall goal is to build a spatial mapping approach that accounts for the multiple potential benefits of varying infrastructure solutions in prioritizing locations for green or grey infrastructure investments to increase community flood resilience.
3.1. Defining Variables and Infrastructure Benefits
The variables used in the analysis are selected based on the literature and the varying potential benefits of green and grey infrastructure. Green infrastructure in particular has been identified to provide several benefits to the community in addition to managing flood waters (Li et al., Citation2020). One of the goals of the proposed approach is to be able to systematically and quantitatively include these co-benefits in the analysis. In previous work, these benefits have been broken down into three (Alves et al., Citation2018b) or four (Miller & Montalto, Citation2019) categories. The categories used in this study are based on the services the infrastructure provides, defined as regulating services, provisioning services, supporting services, and cultural services (Miller & Montalto, Citation2019). Variables are defined from the benefits within each of these service categories with additional consideration for the available data across a community. The variables used in this study are based on community leader priorities and the availability of data to analyze locations across Chatham County, GA.
The variables used in this analysis were found through a literature review of previous studies on green and grey infrastructure, including prior spatial analyses and multi-criteria decision analyses, and a consideration of the purposes and benefits of both infrastructure types. The variables associated with grey infrastructure benefits focus on helping as many people as possible, including socially vulnerable populations, while green infrastructure variables also include the additional social and environmental benefits of green infrastructure solutions that can be particularly important for marginalized communities. With a main purpose of flood reduction, three benefits are included for both green and grey infrastructure: reducing floods in high risk areas (Li et al., Citation2020), reducing predicted future flooding (Li et al., Citation2020), and reducing flooding in areas currently experiencing flooding (Daxikar et al., Citation2012). Additionally, with the goal of protecting critical infrastructure assets and benefitting the most people in a community particularly socially vulnerable populations, three more benefits are included for both green and grey infrastructure: protecting critical infrastructure (Li et al., Citation2020), supporting socially vulnerable populations (Li et al., Citation2020), and protecting the highest number of people possible. With the additional social and environmental benefits of green infrastructure as identified in the literature, these are included as green infrastructure benefits: air quality improvement, clean water access, food access, habitat protection, improving access to green spaces, and creating educational spaces (Alves et al., Citation2018b; Alves et al., Citation2019). The defined set of variables can be augmented or modified based on community priorities and data availability. As long as the variables can be converted into a spatial metric, e.g., the locations of specific facilities or assets such as power plants or grocery stores and census tract data that matches populations with specific geographic areas, the method is flexible to accommodate changes to the variables used in the analysis.
Some variables are represented as geographic points or polygons within the space of the study area, and other variables are indicated by zones that comprise different parts of the entire study area. For points or polygons, to prioritize an infrastructure solution location, a distance analysis is conducted (in this case using Euclidean distance), and depending on the variable, being close or far from the point or polygon is prioritized for locating new infrastructure. As an example, for green infrastructure, to have the benefit of improving air quality, being close to the green infrastructure solution location is preferred. For zones, zones are converted to raster data giving a value for each geographic cell in the study area, and the zones for which green or grey infrastructure would have a greater benefit are prioritized for locating new infrastructure. For example, higher risk flood zones are prioritized compared to lower priority lower risk flood zones. Other benefits such as livability enhancement that cannot be addressed spatially are not included in this spatial analysis. The resolution of the spatial analysis is defined by the size of the individual geographic cells covering the study area that is considered for infrastructure locations. Selection of cell size is discussed later in this paper as part of the mapping implementation. Each of the infrastructure benefits included in the analysis, their corresponding defined variables as part of four service categories (regulating, provisioning, supporting, and cultural), and the data sources used to define each of the variables are further described in the following.
3.2. Regulating Services
Regulating services helps maintain the environment for human life. The benefits in this category include aiding high flood volume areas, protecting flood-sensitive area road infrastructure and buildings, improving air quality, reducing hurricane damage, ensuring access to emergency routes, evacuation zone prioritizing, and relieving over-capacity storm drains. For this work, based on data available in the community, the benefits included in the analysis are flood reduction, predicting future flooding, considering Letter of Map Change (LOMC) parcels, air quality improvement, and protecting critical infrastructure. The variables addressing each of these benefits are outlined in . For each of the variables, the priority for that variable in selecting a location is indicated. For example, the table shows if higher risk locations are prioritized; or, for proximity-based variables, whether it is desired to be close or far for a potential infrastructure solution location. Applicability of the variable to green, grey, or both green and grey infrastructure is also given.
Table 1. Benefit categories, corresponding variables and data sources, applicability to green or grey infrastructure, and location priorities indicating whether being within a high or low risk zone or being close or far from the variable’s spatial locations is prioritized for an infrastructure solution.
For the variables used as part of regulating services, flood reduction at a location is measured based on flood risk and flood zone, with higher risk areas prioritized. The amount of sea-level rise considered in the analysis of the benefit of reducing predicted future flooding ranges from 0.3 m to 1.2 m by 2100 based on projections (Sweet et al., Citation2017). To address the uncertainty in this range of possible scenarios, separate analyses are conducted considering the areas projected to be inundated under the 0.3 m and 1.2 m scenarios. The results provide bounds on the impacts of flooding under the uncertainty of potential future climate outcomes. For this variable, it is desired for future flood mitigation infrastructure to be located close to these locations anticipated to be flooded. Letter of Map Change (LOMC) areas are places where residents have successfully petitioned the city for their homes to be marked at a lower flood risk to reduce insurance rates. These have previously been included as a stormwater infrastructure indicator (Daxikar et al., Citation2012), and are also included in this analysis as an indicator of actual local flooding conditions compared to generally designated flood zones. Data on this variable and other site location variables are provided by Savannah Area Geographic Information System (SAGIS). Air quality improvement is measured based on proximity to industry, where it is desired to be close to these locations to improve air quality in the community. Protecting critical infrastructure is measured based on proximity to critical community facilities, including hospitals, police stations, power facilities, and schools.
3.3. Provisioning Services
Provisioning services supply goods for human survival. Benefits in the analysis that fall into this category are clean water and access to food. Clean water access is measured by prioritizing locations more at risk of groundwater pollution. With data on locations of existing grocery stores and community gardens, locations far from these sites are prioritized for locating infrastructure to address the benefit of food access as green infrastructure solutions can include community gardens to reduce food insecurity in those areas.
3.4. Supporting Services
Supporting services focus on habitats that ensure wild plants and animals have needed spaces to survive and reproduce. Specific services in this category depend on local characteristics, such as what plants and animals are local and at risk due to a growing human population. Eliminating the green space that these species live in reduces pervious surfaces which can lead to more flooding. To account for supporting services in the analysis, areas that are current conservation zones are removed. Areas that are habitat areas and not designated for conservation are included as a benefit. Data for this variable is based on the Habitat Global Status indicated by NatureServe and implemented for the coast of Georgia by the Georgia Coastal and Marine Planner (GCAMP).
3.5. Cultural Services
Cultural services include anything else that is non-material and benefits human populations. The benefits in this category include aiding socially vulnerable communities; improving access to green space; creating an educational space for schools; and addressing other historic issues such as the mitigating risk for historically marginalized populations that are disproportionally experiencing the negative impacts of climate change. The benefits included in this analysis are supporting socially vulnerable populations, protecting the highest number of people possible, improving access to green spaces, and creating educational spaces for schools.
Several different indices have been developed to represent social vulnerability. The index used in this analysis is the Social Vulnerability Index (SVI) (CDC/ATSDR Social Vulnerability Index (SVI), Citation2022) which is designed as an indicator of how vulnerable the population in an area is to disaster. The SVI has been calculated for every county in the U.S., supporting this work and its extension to other communities by being available and able to be applied to different locations subject to flood risk across the country. The SVI includes several criteria such as age risk, as children and elderly, tend to need extra aid in the event of a disaster; and wealth and race risk, as poorer and BIPOC populations have historically had a more difficult time obtaining government relief after a disaster. These criteria are particularly relevant to flood resilience as indicators of population vulnerability during the response to a disaster, and for community recovery after a flooding event. Locations with populations with higher social vulnerability are prioritized in the methodology. The SVI uses data from the American Community Survey (ACS). Population counts from the ACS are included in the analysis to prioritize locations serving more people. The ACS rather than Census data is used for consistency with the SVI. Due to the uncertainty in estimating populations, ACS population values are published with an error margin calculated based on a 90% confidence interval. Analyses accounting for this uncertainty in population estimates are conducted later in this work. Considering the locations of existing green spaces, locations far from parks are prioritized as green infrastructure solutions can create new green spaces. Locations close to schools are prioritized to create educational opportunities.
3.6. Creating Spatial Indices
To analyze the range of potential infrastructure benefits spatially, each variable is converted to a spatial index for consistent analysis and comparison. The community area for analysis is divided into individual cells. Each cell represents a potential flood infrastructure solution location. With the varying units of all variables considered, to reduce the impacts of outliers, and to provide rankings and prioritizations of locations, variable values at each location are discretized into one of 20 bins such that the frequency of values is evenly distributed in each bin from low to high values for each variable. Twenty bins are chosen as a tradeoff between providing granularity in the results while considering the resolution of the data available. To be able to compare the different locations and facilitate communication of the results with community decision-makers, the divisions provide a score for each cell from 1–20 for that variable. The score indicates how well having new flood infrastructure at that location would aid in that benefit, with a higher score indicating a higher priority location. All scores are combined into an index value, by summing scores across benefits to rank the highest benefits across all locations in a community. The results are used to create two types of maps: one providing which locations should be prioritized for green, grey, or either type of infrastructure, and another highlighting the types of services that should be emphasized based on the specific scores in a green infrastructure design. The latter is particularly relevant given the range of possible green infrastructure designs and shows the benefits that would be most impactful for a green infrastructure solution to address at a particular location.
The above procedure provides results based on an equal weighting across all benefits. Likely not all the benefits are of equal importance to a community or decision-maker. In previous studies, e.g., (Alves et al., Citation2020) and (Vojinovic et al., Citation2017), a survey was created to assess stakeholders’ rankings for different benefits. To include community decision-maker priorities in the proposed method, the index values in the methodology can be weighted. This accounts for the varying priorities or preferences among decision-makers. As a demonstration, in this work, three stakeholders from Chatham County, GA, participated in this study, each with varying roles in the community: one in a more political role, one in a technical and system operation role, and another in a combined technical and political role.
Both weighted and unweighted results are calculated and plotted. For the unweighted scenario, the benefits are summed and different service types are evenly weighted. For the weighted scenario, stakeholders are asked via a questionnaire to rate on a scale from 1–10: preference for green versus grey infrastructure, the importance of each of the four service categories (regulating, provisioning, supporting, cultural), and the importance of each potential infrastructure benefit. These ratings are then converted into weighted indices for each cell as shown in Equation 1 and EquationEquation 2(2)
(2) .
is the weighted index value for a cell,
is the rating of the service category
,
is the number of service categories,
is the unweighted variable score for a cell,
is the rating of the variable within a service category that is used to weight that variable score,
is the number of variables within a service category,
is to standardize the score to an even value if desired (in this case,
, to make variable values up to 100),
or
is the rating by infrastructure type,
is the number of infrastructure types (in this case,
, for green and grey infrastructure),
is the rating of the variables relevant for grey infrastructure, and
is the number of grey infrastructure variables. Equations 1 and Equation2
(2)
(2) are calculated for each cell over the community area of interest, and EquationEquation 1a
(1a)
(1a) is calculated for each service category. For green infrastructure, with the desire to provide information on the specific service categories most important for a green infrastructure solution to address, the index value for green infrastructure consists of a two-step process, with specific values for each service category calculated in EquationEquation 1a
(1a)
(1a) and then combined into the green infrastructure index value in EquationEquation 2
(2)
(2) . These equations provide a straightforward way to combine multiple variable values, facilitating communication of the analysis process and results with community stakeholders. Equations 1 and Equation2
(2)
(2) provide the generalized calculation to incorporate stakeholder preferences (i.e., ratings between 1 and 10) to result in variable weightings. Unweighted analyses use the same equations by removing the rating variables (
,
,
,
, and
), or by simply setting the values of these variables equal to 1.
The result is a total index value for green or grey infrastructure at each location in the community, and the constituent service category index values for green infrastructure. Comparing and
, the higher resulting index value determines whether green and/or grey infrastructure is the best option for a certain cell. If the values are tied, both are recommended for either a joint design or as an option for the decision-maker. For the areas identified as recommended locations for green infrastructure, further analysis is conducted with the
values used to assess which of the services should be emphasized in a green infrastructure design: regulating, provisioning, supporting, and cultural. The highest service index values indicate which services would have the greatest impact and benefit for that location.
3.7. Mapping Implementation
The results of this study were implemented in ArcGIS Pro. Other mapping software can be similarly used. A raster analysis was performed to divide the community area into smaller area cells. A resolution of 100 m by 100 m was used as a balance between providing detail in locations and the ability to comprehensively analyze the community as a whole. Since this analysis focuses on green and grey infrastructure to address stormwater issues, undeveloped coastal marshes and conservation zones are removed from the extent of analysis.
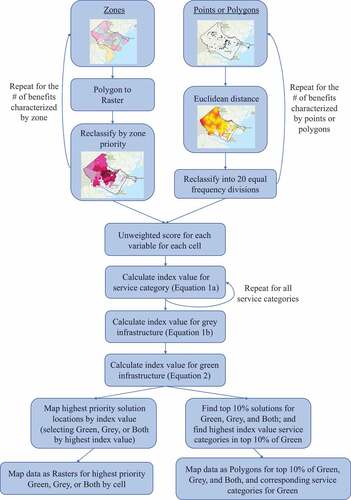
The resulting maps based on the index values indicate where green or grey infrastructure is recommended and what locations should be prioritized to maximize benefits from the infrastructure investment. Multiple locations are recommended to provide decision-makers with a range of possible locations. In addition, some land may not be available for development or suitable for certain projects. For example, not only open lots that are available for development are included in the analysis as some green and grey infrastructure solutions can occupy a small space such as a street edge. A more detailed analysis of the prioritized locations from the results of the proposed methodology is needed from a local stakeholder point of view to select final infrastructure locations. In addition, the location results are not the result of detailed hydrological analyses. The objective of this work is not to provide specific site analyses. Instead, the goal is to provide stakeholders with prioritized locations for investment looking across the community as a whole, and highlight areas with the greatest benefit to increase flood resilience for decision-makers to consider in development. In the results presented in this study, the top 10% of locations by total index value are presented. This number can be altered based on the number of options sought to be presented to community decision-makers as prioritized locations for infrastructure investments. A flowchart showing the steps of the proposed method is shown in . Included are the data inputs as zones, points, or polygons; processing steps including calculations of index values for green infrastructure, grey infrastructure, and individual service categories; and mapping data outputs, including rasters giving the highest index values for green infrastructure, grey infrastructure, or both for each cell in the study area, and polygons highlighting the prioritized top 10% of locations and corresponding service categories for green infrastructure.
Figure 1. Flowchart of the proposed spatial mapping methodology.
Once the top 10% of locations have been found using the proposed approach, each location can be analyzed for feasibility. Feasibility considerations include land availability at the top locations, and the specific infrastructure solutions that fit within the infrastructure type and/or service category. Time-dependent factors such as rate of growth for a particular green infrastructure solution versus rate of sea level rise can also be considered at this stage. Detailed hydrological analyses should then also be conducted along with cost-benefit analyses – including multiple benefits (Alves et al., Citation2019) – on those limited set of solutions and locations to select final infrastructure solutions and designs. Many of these latter steps are already well described in the literature, and are therefore outside the scope of this work. Instead, the authors are proposing that a spatial analysis as described in this work be conducted as an important first step in the planning process to maximize the benefits of green and grey infrastructure projects across multiple community factors.
In addition to supporting decisions for siting locations for current infrastructure projects, the resulting maps from the proposed methodology can also guide future planning. From the highlighted locations in the maps, a community can prioritize certain areas for future development, and work to obtain larger tracts of land in those areas to build larger-scale projects in the future. The results can also be adapted as variables of interest evolve, benefits that are prioritized shift, development occurs, or community characteristics change. The proposed approach is to enable these decisions to be made based on quantitative measures and a comprehensive assessment of the benefits of varying flood infrastructure options to the community.
For communities that do not have extensive spatial data, e.g., outside the United States, there are two approaches possible. The first is to reduce the number of variables used in the analysis based on the spatial data that is available. While this reduces the number of benefits that may be considered in selecting infrastructure locations, it is still an improvement upon existing site-specific methods that do not consider a community as a whole. The second approach if little to no spatial data is available, and an analysis of all possible locations across a community is not possible, is to apply the ideas from this work in a more qualitative manner. A community can consider the benefits that are relevant to their population and environment, then if multiple areas are available, select locations based on those that are best able to provide those benefits. This process takes a location-based approach while incorporating community preferences and priorities. The key is to consider multiple benefits and their locations when prioritizing areas for flood infrastructure investment.
4. Study Location
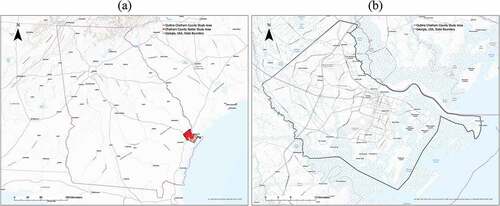
Chatham County, GA, is a coastal county on the Atlantic Coast of the United States. It is chosen as the study area for this work due to the ongoing collaboration of the research team with municipal officials, its flood risk, its desire to mitigate that risk including with new technologies and approaches, and as a demonstration of the results of the proposed approach combined with stakeholder input and preferences. Being on the coast, much of the county is composed of marshland that acts as a natural protectant of coastal flooding, as shown as the speckled regions in . With the focus on green and grey stormwater infrastructure in this study, undeveloped coastal marsh areas are excluded from the extent of analysis.
Figure 2. Study location of Chatham County, GA, USA: (a) Chatham County is highlighted on the coast of the state of Georgia. (b) Outline of study area of Chatham County, excluding undeveloped coastal marshes (speckled regions).
Chatham County has undertaken several steps to identify and mitigate flood risk across the community. The county has a population of 295,291 as of 2020, but community officials predict that the population will increase to 315,524 by 2030. To prepare for this population increase, the community is building more housing, which poses flooding concerns for the already frequently inundated community as it increases the population exposed to flood hazards and as the development would increase the number of impervious surfaces in the area. The Chatham Emergency Management Agency has published a Hazard Mitigation Plan including flood hazards and Future Land Use Maps including projections of future population and environmental scenarios (”MPC Comprehensive Plan,” Citation2021). The county has also invested in innovative smart sea level sensors that are being used to measure flooding events and to aid in emergency planning and response (Cobb et al., Citation2022). The county has built both green and grey flood infrastructure projects, including implementing various green infrastructure measures across the county in addition to their existing flood management systems. A recent public opinion poll showed a strong community preference for green infrastructure solutions.
The proposed methodology can be readily applied to other locations and communities subject to flooding. The study location of Chatham County is chosen in this work for illustrative purposes. In consideration of the generalizability of the proposed method, Chatham County is particularly well suited for this work due to the library of geographic information available through the Savannah Area Geographic Information System (SAGIS). While not all variables are necessary to conduct the analysis, geographic information is needed to implement the proposed method in other locations, particularly information of interest to stakeholders based on community priorities. If such information is available, the method applies to other communities and locations to assess and prioritize locations for flood infrastructure solutions.
5. Results
5.1. Weighted and Unweighted Maps
This section provides the resulting maps from implementing the proposed methodology for Chatham County. The three stakeholders from Chatham County, GA, participating in the study are indicated as Persons A, B, and C. Person A is in a more political role, working as an urban planner with significant community engagement. Person B is in a technical and system operation role working in floodplain management who is responsible for building, operating, and maintaining current systems. Person C is a planning supervisor who hears both political and technical perspectives throughout their job function and works with the objective of balancing current and future needs. First, the maps based on the rating responses from the three stakeholders are presented in .
Figure 3. Resulting map for Person A: (a) Gradient of location indices for selection of green, grey, or both infrastructure placement. (b) The top 10% of infrastructure index locations and the service categories that should be prioritized in selecting an infrastructure solution.
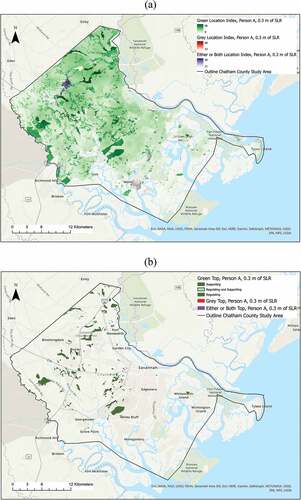
Figure 4. Resulting map for Person B: (a) Gradient of location indices for selection of green, grey, or both infrastructure placement. (b) The top 10% of infrastructure index locations and the service categories that should be prioritized in selecting an infrastructure solution.
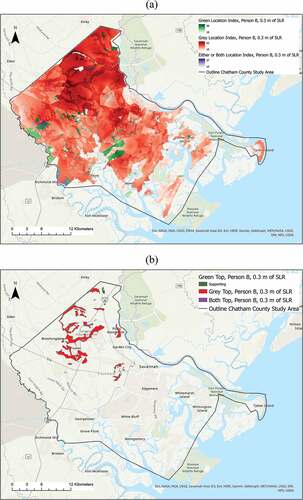
Figure 5. Resulting map for Person C: (a) Gradient of location indices for selection of green, grey, or both infrastructure placement. (b) The top 10% of infrastructure index locations and the service categories that should be prioritized in selecting an infrastructure solution.
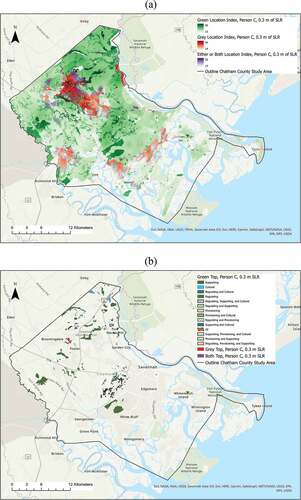
These are labeled as maps for Persons A, B, and C. Included are (a) maps showing the index values for each cell colored by selection for green (colored green), grey (colored red), or both (colored purple) infrastructure types. The color gradient indicates the magnitude of the index value with darker values depicting higher index values. Also shown are (b) maps showing the locations with the top 10% of index values. These are the prioritized locations for flood infrastructure placement that are highlighted by the proposed methodology. The top 10% of locations for grey and both infrastructure types are shown, and for the top 10% of locations for green infrastructure, additional indications of the service types that should be emphasized in a green infrastructure design are shown. The service types are shown with varying colors, lines, and their combinations. Supporting services are shown in green along with lines at 45 degrees, regulating in green along with lines at 135 degrees, cultural in blue, and provisioning in orange. These are shown in the legend along with their combinations.
In these figures, the results are based on projections of 0.3 m of sea level rise (SLR) by 2100, which is the most likely estimate to be met or exceeded (Sweet et al., Citation2017). Results for 1.2 m of SLR, the lower probability event but higher impact scenario, are presented later in this section. The authors analyze unweighted and weighted scenarios to test their hypothesis that incorporating community official weightings is necessary to obtain realistic results. If the results including varying weightings are not significantly different from each other or from the unweighted results, then the outcomes of this study would not lead to an emphasis on the importance of obtaining community input in the decision-making process. Otherwise, if significant differences are found, this result would motivate the need to include in the methodology input from across community stakeholders and potentially average preferences across the stakeholder responses to obtain a more balanced view of stakeholder preferences.
Comparing show how the results change based on stakeholder and decision-maker priorities. The resulting map for Person A () represents a stakeholder preference that heavily favors green infrastructure over grey infrastructure. This person’s job function as an urban planner means that they usually think in terms of longer time horizons and have frequent interactions with the community. With the many longer term benefits of green infrastructure, e.g., relating to health and education, and the community preference for green infrastructure solutions, this leads to a strong preference for green infrastructure for Person A. Further, supporting and regulating services are prioritized for these green infrastructure solutions. shows the results for Person B, who weighted green and grey infrastructure equally. This person works in floodplain management with responsibility for building, operating, and maintaining current systems, and selection for grey infrastructure dominates these maps. This result is due to the fewer benefits and associated variables for grey compared to green infrastructure, consistent with previous literature identifying the co-benefits of green infrastructure. In this case, having fewer variables makes it easier to achieve a high location index value. For green infrastructure, more benefits need to be rated higher for green infrastructure to be selected. This outcome supports decision-making in practice, as green infrastructure solutions tend to be more expensive than grey infrastructure solutions when considering initial investments, maintenance, and operation costs, and thus the community needs to prioritize these additional benefits to motivate higher investment in green infrastructure (Alves et al., Citation2019).
shows the results for Person C, who represents a middle ground between Persons A and B. In their job role as a planning supervisor, Person C needs to balance current and future needs, and the results align with someone who hears preferences and opinions from both political and technical perspectives. Both green and grey infrastructure locations are highlighted on the resulting maps, with a concentration of prioritized locations for grey infrastructure near the northwest part of the county and locations for green infrastructure distributed across the county. In addition to the geographical spread for potential green infrastructure locations, the types of services that should be prioritized in each of these locations also vary, showing the range of potential projects that would benefit the community in these locations. The input from the three stakeholders for this study represent a range of possible preferences relative to green and grey infrastructure, and give results representing the range of possible outcomes from the method. With this range, the resulting maps for Persons A, B, and C vary greatly. These differences show the importance of considering multiple viewpoints in the decision-making process, and motivate further analyses of the outcomes of the methodology under an unweighted scenario as well as using averaged ratings across the stakeholder responses. provides the resulting maps under these two scenarios.
Figure 6. Gradient of location indices for selection of green, grey, or both infrastructure placement under 0.3 m SLR (a) for an unweighted scenario and (b) using average ratings across stakeholder responses. The top 10% of infrastructure index locations and the service categories that should be prioritized in selecting an infrastructure solution (c) for an unweighted scenario and (d) using average ratings across stakeholder responses.
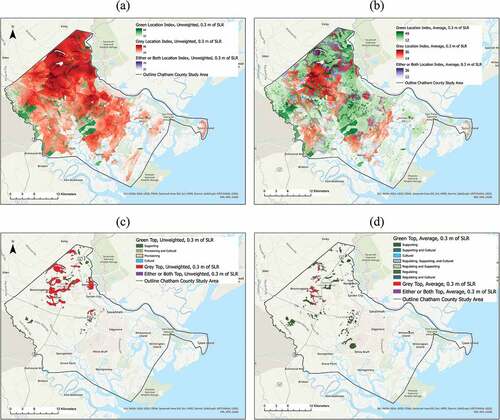
Comparing shows the significant influence of weights on the results. Without weighting, grey infrastructure solutions are prioritized (). This result is due to the fewer benefits and fewer corresponding variables for grey compared to green infrastructure. With fewer variables, it is easier to achieve a high location index value for grey infrastructure, and more benefits need to be rated higher for green infrastructure to be selected. If they are not, then grey infrastructure solutions are prioritized, as was seen in the results for Person B (). Accounting for stakeholder preferences and community priorities results in a more balanced selection of green and grey infrastructure across a community (), as the higher rated preferences and priorities for green infrastructure benefits lead to increased green infrastructure selections. In addition, several observations can be made in examining the locations in the top 10% by index value under both scenarios. The locations highlighted for grey infrastructure investments using averaged stakeholder ratings () are also present in the prioritized grey infrastructure locations in the unweighted analysis (). Several of the prioritized green infrastructure locations in are in the same locations as the prioritized grey infrastructure locations in , but with a green infrastructure solution selected instead. These locations are those that should be prioritized for flood infrastructure development, with the selection of infrastructure type based on community member and decision-maker preferences and priorities. Finally, the averaged rating map also includes additional locations that the unweighted analysis did not find as significant, highlighting the possibility of discovering important areas for locating flood infrastructure based on stakeholder input that might not otherwise have been identified.
5.2. Analyses Including Uncertainties in Climate Projections and Population Estimates
In the decision-making process for locating and building flood infrastructure, several variables considered are subject to uncertainty, including those related to environmental effects and population estimates. This section presents the results of analyses accounting for these uncertainties. Such an analysis is particularly important given the long-range projections associated with climate change and for these infrastructure investments that are intended to benefit populations.
First, the results presented thus far have been under a scenario of 0.3 m of sea level rise (SLR) by 2100. To address the uncertainty associated with these climate projections and assess the impact of varying predictions of SLR on the results, the analysis was also conducted under a 1.2 m SLR scenario. shows the resulting maps for the unweighted and averaged stakeholder ratings analyses for 1.2 m of SLR. Combined with the results under a 0.3 m SLR scenario, the maps provide a range of possible outcomes for the proposed methodology under varying climate projections in supporting decisions to locate flood infrastructure.
Figure 7. Gradient of location indices for selection of green, grey, or both infrastructure placement under 1.2 m SLR (a) for an unweighted scenario and (b) using average ratings across stakeholder responses. The top 10% of infrastructure index locations and the service categories that should be prioritized in selecting an infrastructure solution (c) for an unweighted scenario and (d) using average ratings across stakeholder responses.
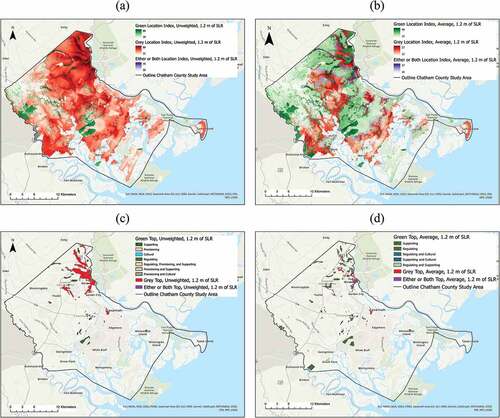
Comparing the results in to those in shows that the prioritized locations move towards the areas bordering major waterways under the 1.2 m SLR scenario, particularly in the northern portion of the county. While the 0.3 m SLR results prioritize many inland locations for flood infrastructure investment, fewer inland locations are selected under the 1.2 m SLR scenario. The reality is likely to fall somewhere between these two outcomes. The results show the importance of considering the range of possible future environmental and climate scenarios in the selection of flood infrastructure locations.
Another source of uncertainty in making flood infrastructure investment decisions arises from uncertainties in population estimates. The American Community Survey (ACS) provides population counts for each census tract. However, these values are subject to uncertainty due to sampling biases (the ACS asks detailed questions to a subset of the population that is intended to represent the entire population), and errors from respondents in not filling out the survey accurately. To account for this uncertainty, the ACS provides a margin of error for the population values for each census tract, providing the estimates of the population values within a 90% confidence interval.
The previous results were calculated using the mean estimated population values provided by the ACS. To analyze the impact of population estimate uncertainty on the results, three additional population value scenarios were considered: the estimated population value minus the margin of error (low estimate), the estimated value plus the margin of error (high estimate), and the high population estimates for census tracts within the top 20% of social vulnerability. The low estimate and high estimate provide bounds on the results. The use of high estimates for areas with high social vulnerability is based on previous literature showing that neighborhoods with higher population vulnerability have been historically undercounted in the Census (Tate, Citation2013). While such a specific study on uncertainty does not exist for ACS data, the possibility of undercounting vulnerable populations still exists in the ACS. Given the desire to provide increased flood protection for historically marginalized communities, it is important to investigate how the results might differ with the population adjustment for more vulnerable areas. show the results under the three population value scenarios for the unweighted and averaged stakeholder ratings cases, respectively.
Figure 8. Gradient of location indices for selection of green, grey, or both infrastructure placement under 0.3 m SLR in an unweighted analysis with (a) low population estimates, (c) high population estimates, and (e) high population estimates for more vulnerable census tracts. Top 10% of infrastructure index locations and the service categories that should be prioritized in selecting an infrastructure solution with (b) low population estimates, (d) high population estimates, and (f) high population estimates for more vulnerable census tracts.
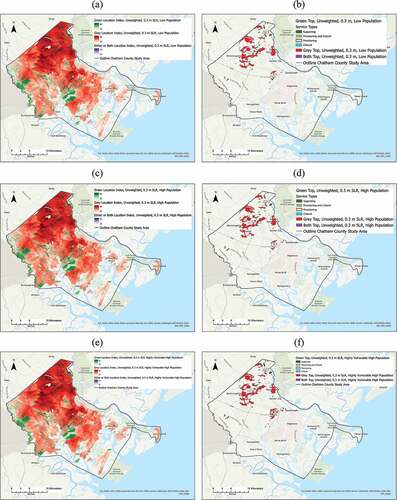
Figure 9. Gradient of location indices for selection of green, grey, or both infrastructure placement under 0.3 m SLR for the average stakeholder ratings analysis with (a) low population estimates, (c) high population estimates, and (e) high population estimates for more vulnerable census tracts. Top 10% of infrastructure index locations and the service categories that should be prioritized in selecting an infrastructure solution with (b) low population estimates, (d) high population estimates, and (f) high population estimates for more vulnerable census tracts.
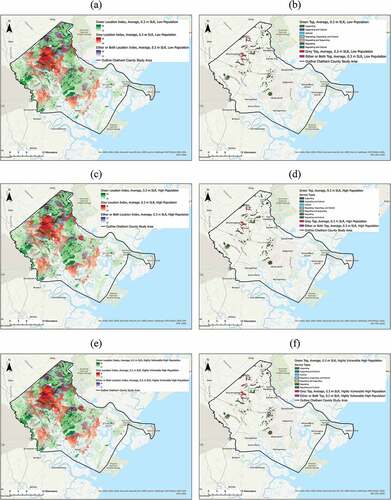
Despite relatively large potential errors in population estimates, with errors up to 25% of the population value in some cases, as seen in , including uncertainty in the population estimates does not have a large impact on the results. Small changes in index values at the decimal level were present, but there were no differences in the resulting maps to significantly alter a choice a decision-maker would make.
6. Conclusions
This paper presents a method to objectively and comprehensively compare green and grey infrastructure flood infrastructure through a spatial analysis across a community. These have not been previously able to be accomplished together to the best of the authors’ knowledge. This work is achieved by accounting for the varying benefits of green and grey infrastructure and through a detailed analysis of quantified spatial measures. Results select green, grey, or both infrastructure solutions for locations across an area, and highlight locations that should be prioritized for flood infrastructure investment to benefit the community. The results can be easily communicated with community stakeholders through maps showing prioritized locations for infrastructure, the type of infrastructure that is recommended, and the services that should be emphasized in an infrastructure design at that location. The highlighted locations are associated with specific quantitative index values to support the results. The method also allows for the inclusion of stakeholder preferences and community priorities. As the resulting selected locations and types of infrastructure solutions vary significantly based on individual ratings of infrastructure benefits, averaging weights across specific stakeholder ratings and including ratings from the broader public is recommended to minimize the impact of individual biases on the results.
This work is the first step in the process of designing and creating new flood infrastructure projects. Rather than locating flood infrastructure in an ad-hoc manner based on subjective measures or solely according to individual site assessments, the method provides a way to assess a community holistically accounting for multiple factors impacting community flood resilience. After the proposed methodology is implemented, specific site assessments should be conducted among the top prioritized locations to evaluate the feasibility of a project relative to topography, soil composition, land availability, etc. A cost-benefit analysis can also be performed to select between projects within the desired infrastructure type or between green or grey infrastructure projects if either or both were recommended. The results can also aid in the future planning of communities. A community would have the opportunity to include prioritized infrastructure locations in a Community Comprehensive Plan to allow for top flood infrastructure locations to be preserved for that use in the future.
Future iterations of this work can increase the number of benefits that are considered based on data availability, community priorities, and evolving infrastructure designs. Incorporating results from a detailed flood model of a community would also enhance the results. In this study, information from flood zones, sea level rise maps, and LOMC parcels were combined to achieve the best guess of the exact reality of flooding in the county with the available data. A dynamic flood model that includes climate change parameters and other weather conditions that affect flooding can be incorporated to lead to more accurate flood-specific results from the methodology. Future work of interest also includes implementing a similar methodology to analyze large offshore flood management solutions. This work at the same time minimizes concern about incorporating the uncertainty in population estimates in analyses as variations across population estimate values did not significantly change the resulting maps.
As communities continue to cope with the effects of climate change, the analysis using the proposed methodology can be continually rerun as community characteristics and priorities change over time. The resulting solution locations will then be adapted to the new current state of a community and its priorities. The proposed methodology offers a pathway to resilience that accounts for the myriad factors that impact community outcomes during and after flood events. It enables clear, comprehensive, and quantitative results to prioritize locations for green and grey infrastructure solutions across a community to increase flood resilience.
Data Availability Statement
The data and codes used during this study are available from the corresponding author by reasonable request.
Disclosure Statement
The Coalition for Disaster Resilient Infrastructure (CDRI) reviewed the anonymised abstract of the article, but had no role in the peer review process nor the final editorial decision.
Additional information
Funding
Notes on contributors
Michelle Reckner
Michelle Reckner is a second-year Ph.D. student at the Georgia Institute of Technology studying Infrastructure Systems Engineering. Reckner received her Bachelor of Mechanical Engineering degree from the University of Delaware with minors in Sustainable Infrastructure, Civil Engineering, and Sustainable Energy Technologies. Her research interests fall into disaster risk management and how infrastructure can support resilient communities.
Iris Tien
Iris Tien is Williams Family Associate Professor in the School of Civil and Environmental Engineering at the Georgia Institute of Technology. Tien received her Ph.D. in Civil Systems Engineering from the University of California, Berkeley. Tien’s research encompasses civil engineering, sensing and data analytics, stochastic processes, probabilistic risk assessment, and decision-making under uncertainty. Her recent work focuses on interdependent infrastructure systems modeling and analysis, and increasing the resilience of communities to a range of disaster events. Her published work has been selected as Editor’s Choice selections in both the ASCE Journal of Infrastructure Systems and the ASCE-ASME Journal of Risk and Uncertainty in Engineering Systems.
References
- Alves, A., Gersonius, B., Kapelan, Z., Vojinovic, Z., & Sanchez, A. (2019). Assessing the Co-Benefits of green-blue-grey infrastructure for sustainable urban flood risk management. Journal of Environmental Management, 239, 244–254. https://doi.org/10.1016/j.jenvman.2019.03.036
- Alves, A., Gersonius, B., Sanchez, A., Vojinovic, Z., & Kapelan, Z. (2018a). Multi-criteria approach for selection of green and grey infrastructure to reduce flood risk and increase CO-benefits. Water Resources Management, 32(7), 2505–2522. https://doi.org/10.1007/s11269-018-1943-3
- Alves, A., Patiño Gómez, J., Vojinovic, Z., Sánchez, A., & Weesakul, S. (2018b). Combining co-benefits and stakeholders perceptions into green infrastructure selection for flood risk reduction. Environments, 5(2), 29. https://doi.org/10.3390/environments5020029
- Alves, A., Vojinovic, Z., Kapelan, Z., Sanchez, A., & Gersonius, B. (2020). Exploring trade-offs among the multiple benefits of green-blue-grey infrastructure for urban flood mitigation. Science of the Total Environment, 703, 134980. https://doi.org/10.1016/j.scitotenv.2019.134980
- Boroushaki, S., & Malczewski, J. (2010). Using the fuzzy majority approach for GIS-based multicriteria group decision-making. Computers & Geosciences, 36(3), 302–312. https://doi.org/10.1016/j.cageo.2009.05.011
- Brody, S. D., Highfield, W. E., & Kang, J. E. (2011). Rising waters: the causes and consequences of flooding in the United States. Cambridge University Press.
- CDC/ATSDR Social Vulnerability Index (SVI). (2022, June 13). https://www.atsdr.cdc.gov/placeandhealth/svi/index.html
- CDC/ATSDR SVI Data and Documentation Download | Place and Health | ATSDR. (2021, August 27). https://www.atsdr.cdc.gov/placeandhealth/svi/data_documentation_download.html
- CDC/ATSDR SVI Fact Sheet | Place and Health | ATSDR. (2021, August 30). https://www.atsdr.cdc.gov/placeandhealth/svi/fact_sheet/fact_sheet.html
- Chatham county flood zones 2018. (n d). Retrieved August 26, 2022, from https://data-sagis.opendata.arcgis.com/datasets/SAGIS::chatham-county-flood-zones-2018/explore?location=31.970117,-81.038441,10.82
- Cobb, K. M., Clark, R., Deffley, N., Mathews, R., Lorenzo, E. D., Polepeddi, L., Chavan, A., Cone, T., Koval, J., Robel, A., Hyde, A., Ramirez, J. M. L., Tien, I., Park, K., McSorley, M., Shabaka, D., & McClain, M. (2022January24). Research to action frameworks for equitable coastal resilience: a case study from savannah, Georgia. 102nd American Meteorological Society Annual Meeting. https://ams.confex.com/ams/102ANNUAL/meetingapp.cgi/Paper/399502
- Daxikar, A., Hillier, T., Makarem, F., & Stone, S. (2012). Application of GIS technology in coastal flood hazard mitigation Solutions to Coastal Disasters 2008. https://doi.org/10.1061/40968(312)36
- De Sousa, M. R. C., Montalto, F. A., & Spatari, S. (2012). Using life cycle assessment to evaluate green and grey combined sewer overflow control strategies. Journal of Industrial Ecology, 16(6), 901–913. https://doi.org/10.1111/j.1530-9290.2012.00534.x
- Dong, X., Guo, H., & Zeng, S. (2017). Enhancing future resilience in urban drainage system: Green versus grey infrastructure. Water Research, 124, 280–289. https://doi.org/10.1016/j.watres.2017.07.038
- Garcia-Cuerva, L., Berglund, E. Z., & Rivers, L. (2018). An integrated approach to place Green Infrastructure strategies in marginalized communities and evaluate stormwater mitigation. Journal of Hydrology, 559, 648–660. https://doi.org/10.1016/j.jhydrol.2018.02.066
- GCAMP. (n d). Retrieved August 24, 2022, https://geospatial.gatech.edu/GCAMP/
- Georgia’s sea level rise—sea level rise. (n d). Retrieved February 22, 2022, from https://sealevelrise.org/states/georgia/
- Ghanbari, M., Arabi, M., Kao, S.-C., Obeysekera, J., & Sweet, W. (2021). Climate change and changes in compound coastal-riverine flooding hazard Along the U.S. coasts. Earth’s Future, 9(5), e2021EF002055. https://doi.org/10.1029/2021EF002055.
- Ghanbarpour, M. R., Salimi, S., & Hipel, K. W. (2013). A comparative evaluation of flood mitigation alternatives using GIS-based river hydraulics modelling and multicriteria decision analysis. Journal of Flood Risk Management, 6(4), 319–331. https://doi.org/10.1111/jfr3.12017
- Johansen, C., Horney, J., & Tien, I. (2017). Metrics for evaluating and improving community resilience. Journal of Infrastructure Systems, 23(2), 04016032. https://doi.org/10.1061/(ASCE)IS.1943-555X.0000329
- Kundzewicz, Z. W., Kanae, S., Seneviratne, S. I., Handmer, J., Nicholls, N., Peduzzi, P., Mechler, R., Bouwer, L. M., Arnell, N., Mach, K., Muir-Wood, R., Brakenridge, G. R., Kron, W., Benito, G., Honda, Y., Takahashi, K., & Sherstyukov, B. (2014). Flood risk and climate change: Global and regional perspectives. Hydrological Sciences Journal, 59(1), 1–28. https://doi.org/10.1080/02626667.2013.857411
- Li, L., Uyttenhove, P., & Van Eetvelde, V. (2020). Planning green infrastructure to mitigate urban surface water flooding risk – A methodology to identify priority areas applied in the city of Ghent. Landscape and Urban Planning, 194, 103703. https://doi.org/10.1016/j.landurbplan.2019.103703
- Martínez, C., Vojinovic, Z., & Sanchez, A. (2021). Multi-objective model-based assessment of green-grey infrastructures for urban flood mitigation. Hydrology, 8(3), 110. https://doi.org/10.3390/hydrology8030110
- Miller, S. M., & Montalto, F. A. (2019). Stakeholder perceptions of the ecosystem services provided by green infrastructure in New York City. Ecosystem Services, 37, 100928. https://doi.org/10.1016/j.ecoser.2019.100928
- MPC comprehensive plan. (2021). Retrieved April 22, 2022, from https://www.thempc.org/Comprehensive/Compplan#gsc.tab=0
- Nguyen, H. Q., Radhakrishnan, M., Bui, T. K. N., Tran, D. D., Ho, L. P., Tong, V. T., Huynh, L. T. P., Chau, N. X. Q., Ngo, T. T. T., Pathirana, A., & Ho, H. L. (2019). Evaluation of retrofitting responses to urban flood risk in Ho Chi Minh City using the Motivation and Ability (MOTA) framework. Sustainable Cities and Society, 47, 101465. https://doi.org/10.1016/j.scs.2019.101465
- Ruangpan, L., Vojinovic, Z., Plavšić, J., Doong, D.-J., Bahlmann, T., Alves, A., Tseng, L.-H., Randelović, A., Todorović, A., Kocic, Z., Beljinac, V., Wu, M.-H., Lo, W.-C., Perez-Lapeña, B., & Franca, M. J. (2021). Incorporating stakeholders’ preferences into a multi-criteria framework for planning large-scale Nature-Based Solutions. Ambio, 50(8), 1514–1531. https://doi.org/10.1007/s13280-020-01419-4
- SAGIS. (n d). Retrieved February 22, 2022, https://www.sagis.org/
- Shafique, M., & Kim, R. (2017). Green stormwater infrastructure with low impact development concept: A review of current research. DESALINATION AND WATER TREATMENT, 83, 16–29. https://doi.org/10.5004/dwt.2017.20981
- Sterzel, T., Lüdeke, M. K. B., Walther, C., Kok, M. T., Sietz, D., & Lucas, P. L. (2020). Typology of coastal urban vulnerability under rapid urbanization. PLOS ONE, 15(1), e0220936. https://doi.org/10.1371/journal.pone.0220936.
- Stormwater. (2021). ASCE’s 2021 infrastructure report card. https://infrastructurereportcard.org/cat-item/stormwater-infrastructure/
- Sweet, W., Horton, R., Kopp, R., & Romanou, A. (2017). Sea level rise. Publications. Agencies and Staff of the U.S. Department of Commerce. https://digitalcommons.unl.edu/usdeptcommercepub/581
- Tate, E. (2013). Uncertainty analysis for a social vulnerability index. Annals of the Association of American Geographers, 103(3), 526–543. https://doi.org/10.1080/00045608.2012.700616
- Tien, I. (2022). Recommendations for investing in infrastructure at the intersection of resilience, sustainability, and equity. Journal of Infrastructure Systems, 28(2), 02522001. https://doi.org/10.1061/(ASCE)IS.1943-555X.0000684
- Vineyard, D., Ingwersen, W. W., Hawkins, T. R., Xue, X., Demeke, B., & Shuster, W. (2015). Comparing green and grey infrastructure using life cycle cost and environmental impact: a rain garden case study in Cincinnati, OH. JAWRA Journal of the American Water Resources Association, 51(5), 1342–1360. https://doi.org/10.1111/1752-1688.12320
- Vojinovic, Z., Keerakamolchai, W., Weesakul, S., Pudar, R. S., Medina, N., & Alves, A. (2017). Combining ecosystem services with cost-benefit analysis for selection of green and grey infrastructure for flood protection in a cultural setting. Environments, 4(1), 3. https://doi.org/10.3390/environments4010003
- Young, K. D., Kibler, D. F., Benham, B. L., & Loganathan, G. V. (2009). Application of the analytical hierarchical process for improved selection of storm-water BMPs. Journal of Water Resources Planning and Management, 135(4), 264–275. https://doi.org/10.1061/(ASCE)0733-9496(2009)135:4(264)
- Zagonari, F., & Rossi, C. (2013). A heterogeneous multi-criteria multi-expert decision-support system for scoring combinations of flood mitigation and recovery options. Environmental Modelling & Software, 49, 152–165. https://doi.org/10.1016/j.envsoft.2013.08.004