
 ?Mathematical formulae have been encoded as MathML and are displayed in this HTML version using MathJax in order to improve their display. Uncheck the box to turn MathJax off. This feature requires Javascript. Click on a formula to zoom.
ABSTRACT
Communities in the United States are increasingly dependent upon aging infrastructure systems and challenged by more frequent and intense extreme weather events due in part to climate change. However, prioritizing resilience-related investments in these systems is hindered by the lack of performance metrics that objectively quantify the societal outcomes of infrastructure disruptions, such as power or water outages. This article outlines the process of developing an equity-focused resilience metric that captures the social consequences of infrastructure service disruptions on households. Theoretically grounded in the Capabilities Approach (CA) theory of human development, this metric focuses on estimating the burden of post-event adaptations taken by households to maintain their basic capabilities (e.g., ability to access food and water) and fulfill important household functionings (e.g., maintaining health and well-being). A travel cost method (TCM) that considers travel-related expenses, direct out-of-pocket expenses, and opportunity costs is presented as a way to measure the value of locations (e.g., grocery stores, emergency shelters, etc.) that provide services that enable households to maintain capabilities. A gravity-weighted model of accessibility is also discussed as a way to capture the value of having multiple potential service locations from which to choose and offers a way to capture important factors impacting a household’s ability to access important goods and services during outages. The proposed social burden metric equation incorporates the valuation principles of the TCM into the framework of the gravity model, resulting in a novel metric with strong methodological heritage. The article concludes by discussing the types of data needed to populate the proposed metric and future applications of this work that could inform the resilient infrastructure investments and planning necessary to mitigate the social burdens of power outages on vulnerable populations.
1. Introduction
In recent years, the United States has experienced a variety of extreme events and disasters that have caused disruptions to the delivery of critical public infrastructure services, such as electricity and water. While the West has been plagued by extreme heat, drought, and wildfire, the East has been battered by increasingly intense hurricanes, and the Gulf region has weathered a series of severe cold and ice storms, all resulting in significant power outages and cascading disruptions to other infrastructure systems (including water, transportation, and food systems among others) impacting hundreds of thousands of people (e.g., Ferman et al., Citation2021; Henry & Ramirez-Marquez, Citation2016; Morris & Cabanatuan, Citation2019; Mulcahy, Citation2021). Evidence suggests that disasters like these are becoming more frequent and, in some cases, more intense, due in part to climate change (e.g., Banholzer et al., Citation2014; Huq et al., Citation2007; Van Aalst, Citation2006).
At the same time, the nation is challenged by aging infrastructure systems. According to the American Society of Civil Engineers (Citation2021) report card, America’s infrastructure scored an overall C- (American Society of Civil Engineers, Citation2021), with systems like water and energy both scoring a C-, transit earning a D-, and roadways a D. These scores are in most cases an improvement over previous years, but still are an indication that major investments and improvements are needed to improve the nation’s infrastructure.
Together, the increasing frequency of disasters and the decreasing integrity of infrastructure systems paint a concerning picture for the millions of Americans who depend upon infrastructure services to support their well-being and livelihoods. It also underlines the importance of investing in more resilient infrastructure systems. In particular, improving the resilience of the nation’s electric power supply is a high priority for investment because other critical infrastructure systems – including water, food, transportation, health, defense, and safety – depend upon the electric grid to function and maintain essential human services Jeffers (Citation2021); Department of Homeland Security (DHS) (Citation2013).
A major impediment in deciding how and where to invest in resilient infrastructure systems, as well as how to regulate and incentivize such infrastructure systems on the public’s behalf, is the lack of metrics – in particular equity-focused metrics – available to measure system resilience. Such metrics would quantify the performance of an infrastructure system in terms of its ability to serve people and communities before, during, and after a disruptive event.
Particular to energy systems, a report published by Sandia National Laboratories (Citation2020) offers a literature review of existing energy sector resilience metrics and identifies a notable lack of metrics that capture the social consequences of infrastructure disruptions. The report describes how existing metrics that report reliability measures, often in terms of customer minutes interrupted (see Clark-Ginsberg, Citation2016), are ideal for capturing the provision of energy in normal operating situations. Such metrics, however, are ill-suited for capturing the provision of energy (or lack thereof) during extreme events that exceed design or operational limits. In fact, high-impact, low-probability events are often excluded from reliability measures because they are rare and difficult to model, resulting in an incomplete and misleading view of reliability to customers (Nateghi et al., Citation2016).
In addition to being unsuitable for quantifying the impacts of major events, existing reliability and resilience metrics also often assume homogeneity across affected populations (i.e., that the impacts of critical service disruptions are the same or at least similar across households) despite common knowledge that disasters disproportionately impact poor and marginalized populations (e.g., Benevolenza & DeRigne, Citation2019; Bethel et al., Citation2011; United Nations Carvallo et al., Citation2021; Inter-Agency Standing Committee, Citation2008; Marshall et al., Citation2020). For example, one measure by which utilities quantify power interruptions, energy not served (ENS; measured in kWh), implicitly suggests that each unit of power lost has uniform impacts for residential customers.
The limitations of such assumptions are evident when one considers a household with two elderly people who may depend upon electricity to refrigerate their medicine, power a wheelchair, or operate oxygen supply equipment. They may also depend heavily on services provided outside their home that may be disrupted during infrastructure outages, such as a local pharmacy or local food delivery service. This type of household may critically depend upon electricity and electricity-dependent infrastructure services, and electricity restoration is likely more urgent for them than for a household where a healthy young couple lives. Current resilience metrics fail to capture differences in the human, or social, consequences of service disruptions at the household level, an omission that is all the more concerning given the critical nature of the lifeline services that infrastructure enables and supports at the household levelIt is therefore essential that the social consequences of disruptions be incorporated into efforts to inform how we might mitigate the burdens of disasters experienced by our most vulnerable populations and prioritize major infrastructure investments in our nation in the coming years.
In recognition of the inequities experienced by different population groups as a result of infrastructure disruptions, we draw insight from a measurable definition of social equity offered by Opp (Citation2017) which is used to inform an equity-based approach toward measuring social burden. According to Opp, ‘… for a city to be labelled as socially sustainable, all people, regardless of race, ethnicity, gender, or income level must have the ability to enjoy equal access to the fruits of public investment while also being able to satisfy their basic human needs” (p.291). Applying this definition to the context of infrastructure disruptions affirms, at least in a general sense, the need to better understand, measure, and eventually address how disruptions impact the ability of different types of households to access goods and services.
This research seeks to meet the need for an objective metric that captures the social consequences of power outages and associated infrastructure service disruptions at the household level, as emphasized by the Sandia National Laboratories (Citation2020) report. More specifically, this article describes the process of developing a metric that builds upon previous work and methods, derived from scholars representing the disciplines of resilience engineering, sustainable development, environmental economics, and geographical sciences. Although this approach may be adapted to inform the social consequences of a variety of infrastructure disruption types, this paper is specifically focused on the outcomes of power outages on households, including concomitant infrastructure disruptions and the critical services they provide. The main objective is to offer policy-makers and practitioners an introduction to a social burden metric that may be used to ultimately inform more equitable and sustainable investment decisions regarding resilient infrastructure.
2. Measuring the impacts of infrastructure disruptions
While there is a preponderance of existing social and community metrics that utilize publicly available census data to identify areas containing vulnerable populations for proactive resilience planning purposes (see Aldrich & Meyer, Citation2015; Aldrich, Citation2012; Cutter et al., Citation2003; Sherrieb et al., Citation2010), there is a comparative lack of metrics that quantify the outcomes or consequences of infrastructure disruptions (including power outages) for diverse communities and households, such as impacts on physical and mental health and time spent without service (Orengo-Aguayo et al., Citation2019). While the former facilitates the identification of vulnerable communities, with the hope that the identification of these communities may result in improved resilience outcomes for them, the latter offers information that can be proven to have a positive social resilience outcome. There are a couple of exceptions to this. For example, Li et al. (Citation2020) use sentiment and behavioral analysis of Twitter data to assess the varying mental and behavioral impacts of individuals during the 2019 Manhattan power outage. While this approach lends some insight into the social impacts of the power outage at the individual level, the findings are largely subjective and therefore challenging to integrate into a resilience metric. Perhaps more relevant is Yang et al. (Citation2021), who evaluated the societal impacts of a water system disruption, defining the ‘societal impact’ as the percentage of the population in different levels of needs satisfaction, defined in terms of the amount of water they can access. Although focused primarily on water disruptions, this work offers a quantitative approach to understanding the spatial distribution and severity of infrastructure disruption. Attempts to apply this method to a power system or other types of critical infrastructure, however, would prove challenging, as the minimum levels of service for satisfying other types of basic needs are not nearly as well defined as those for water usage.
A common technique used by economists to understand the impacts of infrastructure disruptions is the Willingness to Pay (WTP) approach to indirectly measure the value of infrastructure provision (Shawhan, Citation2019; Sullivan et al., Citation2018). In the context of infrastructure resilience, the WTP model is often used to determine the Value of a Lost Load (VoLL), to capture the damage and macroeconomic costs of a power interruption by asking customers how much they would pay to either avoid a blackout or be guaranteed a higher level of supply security based on hypothetical outage scenarios (Schröder and Kuckshinrichs, Citation2015; Miller, Citation2016). Estimates of WTP summed across consumers can be used in investment decisions in electric power supply continuity and resilience. By choosing those investments that provide the greatest net present value (i.e., the total difference between discounted willingness to pay and discounted investment costs), society can make the most efficient investment decisions. However, the efficient choice may not be the most equitable one. Consumer WTP depends, among other things such as the price of other goods and their tastes and preferences, on income (Miller, Citation2016). Simply put, for a given amount of taste or preference for electricity provision, a wealthier consumer can pay more than a poorer one. If electricity consumers can be thought of as voting with their dollars for electricity provision, then richer consumers have more votes. Thus, WTP and a desire or need for electricity provision are separated by the influence of income. WTP, therefore, represents a poor measure of equity since it favors wealthy consumers.
In consideration of these existing approaches, this study seeks to propose a new metric that objectively quantifies the social burdens or consequences of infrastructure disruptions on a household, with equity as a central focus. This metric, unlike existing approaches, is developed to emphasize the needs of different household types and capture the impacts from a broad set of infrastructure service disruptions, primarily power but also concomitant disruptions in other systems, both inside and outside the home.
3. The evolution of the social burden concept
A resilience metric that captures the consequences or burden experienced by members of a community seeking to satisfy basic needs during infrastructure disruptions was first developed by Jeffers et al. (Citation2018) as part of a broader analysis of potential power grid investments (notably, the citing of microgrids), influenced by the conceptual definition of energy burden, which itself is an equity-informing metric of household energy affordability. This analysis was conducted by Sandia National Laboratories, funded by the US Department of Energy, to inform resilience-enhancement options in Puerto Rico following Hurricane Maria in 2017. The metric considers the geographic distribution of various critical infrastructure points (e.g., hospitals, grocery stores, gas stations, etc.) in relation to the geographic distribution of a population. In this metric, different infrastructure points were assumed to offer value to communities, based on the types of services (i.e., medical, food, fuel, etc.) they provided and their service capacity. For example, large grocery stores were assumed to offer high value in terms of their ability to provide food resources, whereas they were assumed to provide a relatively lower value to the service of medication. The burden of a household to access a given infrastructure service point was defined as a function of the effort required of a household to access the infrastructure service location divided by that household’s ability to access those services. Effort was proportional to the weighted linear (‘as the crow flies’) distance between a given population and a service-providing facility (i.e., an increase in the distance between the population location and infrastructure point resulted in an exponential increase in effort). Ability was proportional to the median household income of each population group, reflecting the assumption that wealthier populations will be more adaptable or capable of accessing services. As a result, burden would increase as a result of higher effort or lower ability, and decrease as a result of either lower effort or higher ability. Burden was calculated between each population group and infrastructure service location pair, and all the burden scores for each population were then summed to create an overall Burden score for that population. The overall Burden scores for the populations were then used as the basis for analyzing and comparing the potential benefits or impacts of different grid investment scenarios. First, a baseline was defined using the burden resilience metric as if no additional grid investments were made. This baseline burden was then compared to scenarios of distributed resilience improvements to the power grid to inform investments in microgrids that most effectively decreased the burden of accessing critical services by the Puerto Rican population during future power outages.
Here, we present the social burden metric using the formulation in Wachtel et al. (Citation2021), which is based upon the work of Jeffers et al. (Citation2018). This formulation represents the social burden of adapting to a service disruption, summed across households in a population group. The effort term is modified to not only capture the distance between the population and service providing location, but also to consider the value of the service provided by infrastructure points as well as the additional time and effort spent at each location to receive the needed service. We have restructured this formulation using terms that are utilized in the modified version of the metric proposed later in this paper:
Where:
Bp,s = Social Burden for population group p to adapt to a disruption in service category s. [persons ∙ hours ∙ dollars−1]
= population of each household h
αh= Attainment Ability, or the resources household h has at their disposal for fulfilling needs [dollars]
In practice, the units of this restructured social burden formulation are the number of people disrupted multiplied by their total hours spent fulfilling needs, divided by a dollar-based measure of attainment ability.
In a separate line of academic research, Clark et al. (Citation2018) offer a service-based perspective of infrastructure resilience that emphasizes the role of infrastructure in enabling and supporting human well-being. This view is offered as an alternative to methods that classify the criticality of infrastructure primarily based upon considerations of physical condition and vulnerability to threats. It also offers a process by which resilience investments may be prioritized based upon justifications grounded in human development theory, specifically the Capabilities Approach (CA). The paper argues that the value of an infrastructure service should be based upon the significance of that service for fulfilling important household needs or capabilities.
The CA has been used by national and international agencies, notably the United Nations Development Program (UNDP), as a theoretical framework for measuring human development outcomes across nations (e.g., the Human Development Index, or HDI). Its primary principle is that well-being is about outcomes rather than incomes. In other words, the focus is not on the resources themselves but on what an individual is able or capable of accomplishing with them. As Clark, Seager, and Chester explain, the application of the CA in public policy implies that policies should be assessed according to their impact on people’s capabilities. For example, the focus should be on whether a policy enables people to be healthy, and whether the means necessary for this capability, such as access to clean water, healthcare, protection from infections and diseases, and basic knowledge on health issues, are available. Using the same line of reasoning for the context of infrastructure suggests that interventions or investment strategies should be assessed and prioritized based on their ability to provide important end services to people and communities.
We propose the use of the CA (in the context of critical infrastructure) as articulated by Clark et al. (Citation2018) to inform an equity-focused concept of social burden applied by Jeffers et al. (Citation2018). The goal is to use this theoretical grounding to help justify and expand upon the assumptions made in the original formulation of the social burden metric. This theoretical approach enables a deeper understanding of the impacts of infrastructure disruptions on the well-being of households and communities, which may be used to assess the relative value of service-providing locations within communities. It is important to note that although the CA is traditionally applied to the context of measuring the success of human development over the long term (i.e., a human lifetime) we seek to apply the concept of capabilities to the context of acute disaster resilience (i.e., where the timeframe being considered is often hours, days, or weeks). In particular, we propose using the loss of human capabilities at the household scale (i.e., constrained or limited capability sets) as a means by which to assess and quantify the human consequences of infrastructure service losses, both inside and outside the home, to help justify and inform how social burden may be quantified. Because this application of the CA is focusing on the short-term, day-to-day activities of a household, it requires adaptations to be made to the CA framework so that it may be applied in the context of disaster resilience.
We begin by providing a brief review of the CA theory to describe how it has been previously applied to infrastructure systems and disaster events in the scholarly literature. We then present a modified CA framework for measuring the loss of human capabilities for households following infrastructure disruption events. Next, we outline perspectives on quantifying the accessibility of critical infrastructure services, based on insights from the CA. In the final section, we articulate the need for particular types of data to populate the CA-informed metric and provide a summary of some potential and impactful applications of the social burden metric as it relates to informing future infrastructure investments.
4. The capabilities approach theory
The Capabilities Approach (CA) (see ) was developed and popularized by economist and philosopher Amartya Sen and philosopher Martha Nussbaum (e.g., Nussbaum, Citation2003; Sen, Citation2005). The CA offers an alternative to traditional economic perspectives of development, eschewing both utility (i.e., subjective experience) and income-based measures in favor of outcome-based understandings of well-being (i.e., what people are able to do and to be). It is this theoretical premise that motivated the development of the Human Development Index (HDI), a metric that seeks to provide a measure of well-being that reflects desired outcomes including ‘a long and healthy life’, ‘knowledge’, and ‘a decent standard of well-being’ (Osmani, Citation2016). From the perspective of the CA, the indicators included in the HDI – life expectancy at birth, expected years of schooling and mean years of schooling, and GNI per capita – are understood as indicators of achieved human functionings. Functionings – often expressed as people’s ‘beings or doings’ (Sen, Citation1992) – can best be understood as human outcomes: the activities or states of being that people ultimately undertake. These functionings arise from the combination of people’s capabilities, or the choice set of the possibilities of ‘what a person [might be] able to do or be,’ and people’s freedom of choice between these functionings (Sen, Citation2005, p. 153).
Figure 1. The capabilities approach framework.
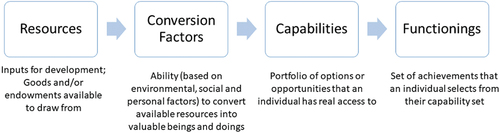
People’s capabilities, moreover, depend on the combination of resources available to them (including but not limited to financial resources, endowments, and personal belongings) and conversion factors that impact their ability to convert available resources into desired functionings. These conversion factors are often classified into three main groups – personal characteristics, social characteristics, and environmental characteristics (Robeyns, Citation2005) – that facilitate or hinder efforts to transform resources into desired capabilities. Personal conversion factors include inherent characteristics or attributes of an individual, such as gender, disability, intellect, and overall health. Social conversion factors include the broader characteristics of the society in which an individual lives, including formal social constrictions such as governmental regulations or public policies as well as more informal characteristics such as gender expectations, class hierarchies, and informal social norms. Environmental conversion factors include characteristics of both the physical and built environment, including natural features such as proximity to fresh water and constructed features such as buildings and bridges (Sen, 2000; Nambiar, Citation2013; Robeyns, Citation2005).
Consider the example of a person that has a bicycle (i.e., the resource of a bicycle) that they wish to use to get around their city (i.e., to realize the functioning of mobility). The degree to which a bicycle facilitates mobility depends on personal conversion factors such as physical fitness, social conversion factors such as laws or social norms permitting bicycling, and environmental conversion factors such as smooth roads or bike paths. In summary, people with well-developed capabilities have the tools they need to live ‘a good life,’ whereas those poor in capabilities struggle to do so (Sen, Citation1999).
Although not typically included in the context of human development theory, the CA has been applied to the context of vulnerability and resilience (United Nations Development Programme (UNDP), Citation2014). Those with larger resources and capability sets are also considered to be more resilient since they have more options or opportunities to achieve valuable things. For example, one might have the capability to walk and drive to work each day. If the option to drive is not that person is still able to get to work by walking. In other words, they are more adaptable to changing circumstances in the short term because they have more than one pathway for being mobile, and therefore have a greater capacity to achieve long-term goals.
5. The capabilities approach applied to infrastructure
Infrastructure systems are generally considered an important factor contributing to human development (e.g., Haenssgen & Ariana, Citation2018). In particular to the CA, environmental conversion factors in the built environment include electricity, transportation, and communication networks and systems that enable the transmission of information, goods, and people (Robeyns, Citation2020). These systems are often critical to the achievement of desired capabilities, as they interact with other environmental, social, and personal conversion factors to improve the ease with which people can access resources to achieve important capabilities. For example, if an individual lives in an area with high-quality infrastructure, say smooth and safe roads or sidewalks, as well as reliable electricity and clean drinking water, they will likely face fewer challenges in accessing goods and services they need day to day (i.e., their capability set will be larger), compared to the same individual living in an area with poor infrastructure. Infrastructure is just one of many important determinants of capability sets and conversion factors; other factors contributing to household-level outcomes include the health and physical fitness of household members and social constructs such as race or ethnicity, which may influence – albeit often more subtly – how a household utilizes or depends upon critical infrastructure.
There have been only a couple of instances within the scholarly literature where the CA has been used to inform infrastructure investments and resilience planning, particularly at the household level. Day et al. (Citation2016) used the CA to conceptually examine the role of energy services in the context of alleviating energy poverty. This work provides a framework for understanding the relationship between electricity-dependent household services and discrete, day-to-day household activities such as washing hands, staying warm, or preparing and storing food. The authors propose a distinction be made between these kinds of specific household activities (‘secondary capabilities’) and the long-term basic capabilities (e.g., having good health, feeling secure, etc.), which tend to be the focus of capability-related work. Day et al., therefore, emphasize the importance of energy-enabled services in achieving basic household functionings, but also suggest the need to consider alternative routes to realize the capabilities of households dealing with energy poverty, such as through community-level efforts, rather than focusing on supply-side or domestic solutions alone.
Additionally, Dargin and Mostafavi (Citation2020) refer to the CA as their underlying theory for investigating subjective well-being impacts (i.e., measures of emotional well-being) of infrastructure disruptions following Hurricane Harvey. Their empirical findings showed uneven consequences for subjective well-being (i.e., feelings of anxiousness or helplessness) related to general infrastructure disruption types (i.e., transportation, food, solid waste, water) for different household demographics. To our knowledge, Dargin & Mostafavi’s study is the only CA-premised empirical examination of the relationships between sociodemographic population factors and the well-being impacts of infrastructure services at the household level; however, their use of subjective measures of well-being (i.e., reported stress and anxiety during outages) deviates from established CA measures (Robeyns, Citation2017), which tend to use more objective, outcome-based measures (e.g., life expectancy and income) to assess achieved well-being (i.e., functioning).
From the CA perspective, the subjective approach is lacking due to two key constraints: adaptive preferences and reference groups (Robeyns, Citation2017). The term adaptive preferences refer to the process by which people’s expectations and perceptions of well-being adjust according to their situation. In other words, people base their subjective assessments of well-being on their reality, and those subjective assessments may change, sometimes significantly, as people’s circumstances change. For example, people who experience a prolonged power outage may adjust to living without power and gauge their subjective well-being based on their expectations of life during the outage; accordingly, this reported subjective well-being during the outage may necessitate an asterisk indicating ‘given the outage circumstances’. Well-being also depends on the fate of reference groups (i.e., points of comparison). If a person’s reference group experiences an improvement in their living standards that exceeds their own, then their subjective well-being may decline, despite the objective improvements in their own circumstances (Robeyns, Citation2017). For example, Person A and Person B might both receive new kitchen appliances (i.e., an objective improvement in circumstances). If Person B receives far better appliances than Person A, Person A may report that their subjective well-being decreased, despite the objective improvement in their personal circumstances, because they are comparing their new circumstances to those of Person B. Together, these two constraints have significant implications for the application of the happiness approach to infrastructure disruptions, as respondents may be affected by the degree to which the outage is ‘normalized’ as well as the experiences of those around them. Given the impact of adaptive preferences and reference groups on perceptions of well-being, we argue that more objective, outcomes-based measures are needed to quantify the social impacts of infrastructure disruptions in a manner that can practically inform resilience planning and investments.
6. A capabilities approach for understanding the impacts of infrastructure disruptions
This research extends beyond prior work by applying the CA specifically to disaster events – acute emergency situations in which people face challenges in fulfilling basic needs due to infrastructure disruptions and must adapt. Specific to the context of a disaster situation, the CA posits that individuals or households with limited resources (e.g., those living in poverty, in poor health, or with less social support) or limited conversion factors (perhaps do not own a car or are immobile) will likely result in less adaptive capacity during an infrastructure disruption event compared with households with more resources or more conversion factors. These differences in the ability of households to adapt will therefore likely result in significant differences in the ability of households to fulfill needs, causing potential large social burden disparities between households. Capturing these differences in impacts across households is essential for more accurate measurements of the consequences of disruptions, which are often required to justify and prioritize resilience investments to protect and mitigate the burdens on the most vulnerable populations.
Therefore, we modify the CA theory outlined previously into a more specific application (illustrated in ) that allows us to conceptualize the linkages between resources that households need to function and are typically provided through infrastructure systems, and the impact on households when these services are disrupted. This means that the ‘capabilities’ portion of the framework becomes more specific to the household, in terms of the household services that become unavailable due to the infrastructure disruption (i.e., lighting, refrigeration, running water, heating/cooling), which are under normal circumstances dependent upon functioning infrastructure services (like electricity or delivery of water) and the resulting impacts on capabilities and functionings. Specifically, the disrupted services map to the impact on capabilities that are critical for maintaining essential functionings (i.e., keeping warm, storing food, keeping clean).
Figure 2. Capabilities approach framework applied to the impact of infrastructure disruptions on household functioning with an example disruption in water delivery provided graphically.
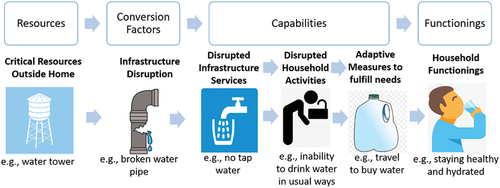
A key aspect of our framework is the consideration of the ways in which households adapt their behaviors to fulfill functionings by using other capabilities within their capabilities set, such as using a generator to provide electricity to refrigerate food or medicine at home, traveling to buy prepared food or bottled drinking water outside the home, or perhaps having food or water delivered. All these possible adaptations taken together ultimately determine a household’s ability (or inability) to maintain important household functionings during a disaster event.
The consideration of adaptive household measures in our framework is worth discussing a bit further because it is key to the development of an equity-focused social burden metric. That is, it allows for an objective and tangible assessment of household well-being during disruptions through the quantification of the additional time and monetary costs required for households to maintain basic functionings, a concept reflected in the field of environmental economics via an approach known as the Travel Cost Method (TCM). The TCM uses a combination of travel-related expenses (e.g., cost of gas or public transit), direct out-of-pocket costs (e.g., costs to access a destination, such as a state park), and the opportunity cost of time (e.g., hours spent en route to a destination) to place a monetary value on locations of interest (Tietenberg & Lewis, Citation2018). This approach has been applied to study a multitude of problems across a wide variety of disciplines (e.g., Das, Citation2013; Hwang et al., Citation2021; Zhang et al., Citation2015).
Within the context of our work, the premises underscoring the TCM may be used to estimate the additional burden arising from households’ adaptive behaviors in disruption events, reflecting the assumption that infrastructure disruptions may force households to spend more time, more money, or both to maintain household functionings. Infrastructure disruptions may result in greater travel-related costs, as households may need to travel more frequently or travel longer distances to fulfill needs (e.g., people may travel to a laundromat instead of doing laundry at home, or they may have to travel farther if a local grocery store is closed due to disruptions). Disruptions may also result in higher opportunity costs. For example, households may spend more time traveling to meet needs or wait in longer lines due to increased demand for services outside the home. Moreover, they may have to spend more time to complete tasks within the home (e.g., washing dishes or clothes by hand rather than using a dishwasher or washing machine). Disruptions may also result in greater direct, out-of-pocket costs such as paying inflated prices for high-demand goods like water or fuel or perhaps relying on more expensive delivery-based services (e.g., having groceries or prepared meals delivered to their doorsteps) to meet important needs during disruption events. Households fortunate enough to have backup resources such as a generator may incur additional direct expenses, as the extra costs associated with purchasing a generator and purchasing fuel to power the generator during the disruption can be quite substantial. While likely conservative in terms of quantifying the total household impacts, the consideration of costs associated with household adaptations allows for an objective – and arguably richer – understanding of how a variety of infrastructure disruptions impact specific activities within different types of households.
7. Quantifying social burden in terms of accessibility
A key aspect of the definition of social equity, provided earlier, is having equal access and ability to satisfy basic needs. Accessibility can generally be defined as the ease of moving from an origin to a destination, the ease of reaching or interacting with spatially distributed locations and activities of interest (Geurs & van Eck, Citation2001). Accessibility is relevant to infrastructure disruptions because during a disaster event, the disruption of services may ultimately result in households having to access goods and services typically fulfilled within the home from locations outside their homes in order to maintain desired outcomes (e.g., going to a local store or public service facility in order to ensure access to clean drinking water). For capabilities that are typically fulfilled outside the home (e.g., obtaining food at a local grocery store), disruptions in infrastructure services may cause households to access those goods and services from facilities much farther away.
In terms of the CA theory, the disruption of infrastructure services constrains the conversion factors upon which households rely; while the desired capabilities of a household may not have changed, their ability to access the goods and services supporting these capabilities might be greatly constrained. In these kinds of disruption events, wherein the domestic provision of infrastructure services is greatly crippled or altogether halted, the accessibility of local destinations that provide goods and services assumes enhanced importance, becoming the primary (or, in some cases, only) conversion factors or pathways that enable households to achieve important capabilities. As such, ensuring the accessibility of local resources – that ‘facilities, goods and services … are … within safe physical reach for all sections of the population’ (World Health Organization, Citation2015) – is of critical importance to the overall well-being of households and communities.
A framework offered by Geurs and van Eck (Citation2001) outlines four key components to the concept of accessibility: a land use component, a transportation component, a temporal component, and an individual component. Aspects of land use include the spatial distribution of people, resources, and opportunities; for the purpose of our work, this component essentially identifies 1) where people are located, and 2) where destinations of interest are located (i.e., infrastructure service points where people can obtain resources that are no longer available at home). Transportation is primarily concerned with the location of origins and destinations in relation to one another, encompassing concepts such as physical distance (both Euclidean, i.e., linear, distance and network distance), the time required to travel these distances, and the costs of mobility. These two components of accessibility effectively encompass the concept of ‘physical accessibility’; accordingly, the TCM essentially provides a metric by which to quantify the costs (both time and monetary) associated with this physical accessibility.
While important, physical accessibility alone does not offer a full perspective of a household’s accessibility to goods and services; these factors also interact with temporal considerations and individual characteristics. The temporal aspect is the availability of opportunities and resources at various points in time, such as changes in the weather or traffic that can make accessing things more challenging. This may be particularly important during infrastructure disruptions caused by extreme weather events. The individual aspect of accessibility, in this case defined at the household level, includes the needs, abilities, and opportunities of different demographic and socioeconomic groups.
Aligning this conceptualization of accessibility with the outcome-oriented framework of the CA, spatially distributed resources (i.e., the land use component of accessibility), may be viewed as necessary but insufficient drivers of well-being. Their existence is important, but their value and importance are derived from the ability of people to get to and capitalize upon these resources (reflecting both the transportation and temporal components of accessibility). The efficacy with which people transform resources into desired capabilities, however, may vary both across and within communities based on personal and household characteristics and circumstances, as well as a multitude of personal, social, and environmental conversion factors. These kinds of individual characteristics (i.e., the fourth component of accessibility), are therefore of critical importance to any kind of meaningful assessment and quantification of accessibility.
In addition, there are two other aspects of the CA that offer important insights as to the type of method that might be most appropriate for a theoretically grounded approach to social burden. First, the CA emphasis on individual conversion factors – the personal characteristics such as age and physical ability that facilitate or hinder people’s abilities to turn the presence of resources into meaningful capabilities – closely aligns with the component of accessibility reflecting individual characteristics. Accordingly, a metric reflecting this tenet of the CA is one that enables these kinds of individual conversion factors – as well as the unique needs of different people – to be incorporated. Second, the CA’s particular emphasis on the importance of choice suggests that there is inherent value in people having choices of where to go to meet certain infrastructure needs during an emergency. While an individual ultimately ends up utilizing a single infrastructure location (i.e., someone in need of medical care might only go to a single hospital to get the necessary medical care), the principle of choice indicates that there is value in them having multiple potential locations to choose from. Accordingly, a metric of accessibility grounded in the human capabilities lens would capture the value of multiple infrastructure points rather than just one single infrastructure point, therein demonstrating the value of options and choice.
Collectively, these two components of the CA suggest that a gravity-weighted model of accessibility may be particularly well suited to reflect the tenets of the CA, as such models reflect both the value of having multiple infrastructure points from which to choose and the salience of differing conversion factors. Derived from Newton’s law of universal gravitation (Crymble et al., Citation2018), gravity-weighted models of accessibility are used to measure the accessibility of origin locations (e.g., population centers) to destination locations (e.g., infrastructure service points). Within these models, each destination location is assumed to offer some potential value, but the value of a destination location to a given origin point decreases exponentially as the distance between the origin and destination (i.e., that each infrastructure service point offers some potential benefit to each population center, but that the actual realized benefit decreases exponentially as the distance between the population and the infrastructure point increases).
Reflecting the first CA tenet, the importance of choice, the gravity-weighted model does not make presumptions about the actual travel choices that individuals might make (i.e., it does not assume that all people are perfectly rational actors who will select travel destinations based on the lowest-cost locations). Instead, accessibility as calculated by the gravity-based model sums the accessibility of all resource locations in a given geographic area. This approach reflects the multitude of choices that are available to an individual at any given moment, capturing the benefits from all potential locations where people might go (and their ability to choose between them). Reflecting the second CA tenet, the importance of individual characteristics and conversion factors, the gravity weighted model offers the flexibility of being able to differentially ‘weight’ the distance between particular populations and destinations of interest; different weighting factors for populations can, for example, be used to reflect a population’s diverse conversion factors (e.g., vehicle ownership) that may facilitate or hinder accessibility.
8. An equity-focused social burden metric
Based upon our modified CA framework, an equity-focused social burden metric would capture both the significance and severity of need as well as inequities experienced in fulfilling those needs by different types of households. Therefore, we redefine the social burden metric presented earlier by Jeffers et al (Citation2018) to reflect these key aspects. In this new formulation, burden of a household to access a given infrastructure service point is defined as a function of a household’s relative needfor accessing a particular service type divided by that household’s accessibility to those services. Thus, for a population group with similar household characteristics , we offer the following modified basic equation for quantifying the social burden of infrastructure disruptions:
The components are defined as:
Bp,s = The social burden for population group p to achieve capability type s [hours]
Ap,s = Accessibility of population group p to capability type s [hours−1]
Np,s = The relative need of population group p to achieve capability type s [unitless]
In practice, the units of the new formulation for social burden are the total hours spent fulfilling needs. Note that social burden has been redefined slightly as the burden to a collection of households as opposed to a collection of individuals, hence there is a difference in units for equation (2) compared to equation (1). All else equal, households that have a higher relative need to fulfill capabilities will have a higher burden, and households that have lower accessibility to fulfill capabilities will also have a higher burden. Note that Equationequation (2)(2)
(2) can be presented as a summation across different household types, which enhances the distributional equity utility of the metric by enabling varying need and ability levels to be incorporated into the overall metric.
Quantification of the need term in Equationequation (2)(2)
(2) can be based on survey or focus group responses, which simplifies the use of this burden equation within practical applications and allows for empirical, context-specific information about population groups. Currently, the need term is unitless, although future formulations may consider units such as liters for water or calories for food.
The accessibility term in Equationequation (2)(2)
(2) represents the conversion factors that either limit or enhance a person’s ability to achieve basic capabilities. These can be related to in-home limitations to functioning, such as failure of a key appliance, or limitations external to the home such as the closure of service-providing infrastructures. Accessibility is based on a gravity-weighted model, to incorporate all four aspects of accessibility, as discussed in the previous section, and is commonly formulated as:
Where:
vs,,j = the value contributed to achieving capability s at each destination j [unitless]
xh,,j = the distance between household h and destination j [meters]
fh(-) = the ‘friction of distance’, a function weighting the distance between household h and destination j. This function contains parameters that vary by household h and may account for environmental conditions like weather or traffic [hours−1]
An adaptation to the TCM that considers opportunity costs in addition to travel and direct costs is utilized to further align the friction of distance function with the capabilities framework and to capture additional time spent by households within the home to adapt, when travel may not be necessary. For example, the additional time needed to wash dishes by hand instead of using a dishwasher. Namely, we define the friction of distance function as:
Where:
β = exponential scaling factor of the cost to access service location j from household h [unitless]
bj = total direct costs for household h to achieve capability via service location j [hours]
ch,j = opportunity costs (i.e., time costs) for household h to achieve an important capability via service location j; this may vary from household to household, based on a variety of conversion factors (vehicle access, efficiency, etc.) [hours]
It is important to note that the travel, direct and opportunity costs described above are presented in units of hours, reflecting the time spent maintaining capabilities. However, the TCM commonly utilizes units of dollars for these terms. This requires a unit conversion that is not presented here.
Finally, substituting Equationequation (3)(3)
(3) and equation (Equation2
(2)
(2) ) into Equationequation (1)
(1)
(1) yields an equation for social burden that is grounded in theory, yet highly similar in structure to the Jeffers et al. (Citation2018) formulation:
The most notable differences between the above modified version of the metric and the original Jeffers et al. (Citation2018) formulation are the following:
Addition of the Np,s term in the numerator to reflect the variable need of populations for different capabilities.
Removal of the αh term from the denominator, which reflects the variable ability of households in a simplified manner.
Addition of the β scaling parameter, which adjusts the sensitivity to distance within the total travel costs.
Addition of an option to include opportunity costs, ch,j,which allows us to capture in-home adaptations for achieving capabilities that do not require travel.
While the Jeffers et al. (Citation2018) formulation was grounded in practical experience, the updated formulation in Equationequation (5)(5)
(5) is firmly grounded in the CA as well as insights from environmental economics and geographical sciences. Given the differing origins of the two formulations, their similarities are striking. Both formulations allow for the inclusion of adaptations taken by households to achieve capabilities through travel, although the modified version can capture additional time spent in the home achieving capabilities even if travel is not necessary or unavailable. In both formulations, linear increases in distance from service-providing locations result in non-linear increases in burden, albeit with the inclusion of a scaling factor in the theory-based formulation. Both formulations reflect a reduction in social burden with an increase in choices or redundancy of service-providing locations, thereby reflecting an optionality value. These similarities lead to a potential to unite theory and practice, ultimately enabling increased quantitative rigor in a practice (social valuation of infrastructure resilience) dominated by qualitative ambiguity.
9. Social burden: from theory to practice
To develop an equity-focused measure of social burden that captures the various social consequences experienced by households during infrastructure disruptions, this research draws from the rich theoretical insights of the CA by informing how infrastructure investments may be justified and assessed in a human-centric fashion. That is, it provides a theoretically grounded guiding framework for assessing what types of infrastructure investments may offer the most significant potential for mitigating burdens for vulnerable populations and communities. The application of the CA framework to infrastructure disruptions at the household level also illuminates the potential for understanding and quantifying household-level burdens through the identification of additional time and monetary expenses incurred by households adapting to disrupted capabilities. Although likely conservative in terms of capturing all of the social consequences of interrupted services and capabilities at the household level, we argue that it provides a more objective and potentially accurate approach for quantifying the consequences of disruptions, as compared to existing approaches that depend upon measures of subjective well-being or hypothetical WTP methods.
To implement and refine this approach and metric, we propose the collection and analysis of empirical data (through focus groups, interviews, or surveys) on the additional time and monetary expenses incurred by households of different types (e.g., across incomes, race, and other household characteristics) that have experienced significant infrastructure disruptions. The information collected would be framed through the lens of the CA, asking participants to identify the services (i.e., lighting, heating, running water), capabilities (i.e., the ability to stay warm, cook, and clean), and ultimately functionings (i.e., maintenance of health and well-being) that were impacted by particular disruption events, indicating which types of service disruptions were most impactful to their household, as well as reporting the particular adaptations needed to cope with disrupted household capabilities. Disruption-specific questions, including those asking respondents to estimate the time and monetary costs associated with adaptive behaviors (e.g., traveling to a store, waiting in line, and/or cost of buying items or services), will clarify and strengthen the relationship between actual incurred costs to infrastructure service types, linked to socio-economic and demographic characteristics of household and population types. This would include infrastructure services and capabilities related to food, water, sanitation, heating/cooling, lighting, communications, medicine, and health services, among others.
The result of this empirical household-level data collection and analysis would reveal an objective or outcomes-based value of infrastructure service types that can inform context-specific strategic resilience planning and infrastructure investments that account for heterogeneous needs within populations, with particular sensitivity to those of vulnerable populations. Analysis of this type of data would reveal significant inequities of household outcomes experienced during particular disruption events (evaluated ex-post), which may be compared to and potentially complement metrics for evaluating social vulnerability (assessed ex ante). Moreover, the time and monetary-based social burden information will be critical for informing a spatially explicit model, which may be used to assess social burden before an event occurs to prompt more proactive planning and/or investments. The revised metric formula, designed to reflect the significance or value of infrastructure service types, from the capabilities perspective of households, would reveal a human-centric, community-based, articulation of needs and preferences upon which decision-makers and practitioners may act. In particular, we expect that this metric would be most useful for local government agencies (i.e., City and County officials) and emergency planners seeking ways to reduce impacts from future disruption events, as well as utilities that want to inform strategies for prioritizing the provision or restoration of services during and after events. One potential challenge is that the social burden metric may reveal existing or past inequities, which may damage the perception or reduce trust between service providers and their customers. On the other hand, institutions utilizing techniques like this may be favored by customers who are looking for more transparent and responsible service providers.
Based upon the development of the social burden metric described above, a series of case studies involving data collection at the household level has commenced. At the time this article was written, data collection and analysis had been conducted in Puerto Rico to understand the social burden of prolonged power outages in vulnerable communities near San Juan following Hurricane Maria in 2017, and an island-wide study had been undertaken to understand the household-level health and well-being impacts consequences power outages (see Clark et al. Citation2022). Additional surveys have been conducted in San Antonio, Texas, and across the broader state of Texas to understand the impacts of infrastructure disruptions following Winter Storm Uri that occurred in February 2021. Future work on this topic includes continued data analysis through additional case studies to implement and assess this more theoretically justified and nuanced approach to social burden analysis.
Disclosure statement
The Coalition for Disaster Resilient Infrastructure (CDRI) reviewed the anonymised abstract of the article, but had no role in the peer review process nor the final editorial decision.
Additional information
Funding
Notes on contributors
Susan Spierre Clark
Susan Spierre Clark, Ph.D. is an assistant professor in the Department of Environment and Sustainability, as well as the Director of the Sustainability Leadership M.A. program in the College of Arts and Sciences at the University at Buffalo. Dr. Clark also serves as Chair of the Erie County Community Climate Change Task Force. She holds a PhD in Sustainability from Arizona State University, an M.S. in Earth System Science from the University of New Hampshire, as well as a B.A. in Atmospheric Science from the University at Albany.
Sara K.E. Peterson
Sara K. E. Peterson is a Ph.D. candidate in Geography at the University at Buffalo, where she studies the human impacts of power outages and consequent infrastructure disruptions. She holds a Master of Science degree in Geographic Information Systems from the University at Buffalo and a Bachelor of Arts degree in Geography from Dartmouth College.
Michael A. Shelly
Michael A. Shelly, Ph.D. is the RENEW Environmental/Sustainability Economist and a Research Assistant Professor. His research areas include plastics recycling, tire recycling, the climate implications of waste, and the social burden of power outages. Prior to UB, Dr. Shelly worked in environmental consulting for two decades, and before that in economic consulting specializing in the energy industry, and in the economics/strategy department at Unilever. plc. Dr. Shelly holds a Ph.D. in Economics from the University of Edinburgh, a Master’s in Economics from the University of Warwick and a Bachelor of Science in Economics with Geography from Queen Mary, University of London.
Robert F. Jeffers
Robert Jeffers, Ph.D. is a senior resilience advisor for the Energy Security and Resilience Center at the National Renewable Energy Laboratory based out of Golden, Colorado. Jeffers previously worked at Sandia National Laboratories, where he led research focused on distributed systems integration, power systems R&D, grid modernization, and developing a body of resilience research. He holds B.S. and M.S. degrees in electrical engineering from Virginia Tech. and a Ph.D. from Washington State University focused on dynamic simulation for integrated water and energy resource planning.
References
- Aldrich, D. P. (2012). Building resilience: Social capital in post-disaster recovery. University of Chicago Press.
- Aldrich, D. P., & Meyer, M. A. (2015). Social capital and community resilience. The American Behavioral Scientist, 59(2), 254–269. https://doi.org/10.1177/0002764214550299
- American Society of Civil Engineers. (2021). 2021 report card for America’s infrastructure. Retrieved from: www.infrastructurereportcard.org
- Banholzer, S., Kossin, J., & Donner, S. (2014). The impact of climate change on natural disasters. In Reducing disaster: Early warning systems for climate change (pp. 21–49). Springer. https://doi.org/10.1007/978-94-017-8598-3_2
- Benevolenza, M. A., & DeRigne, L. (2019). The impact of climate change and natural disasters on vulnerable populations: A systematic review of literature. Journal of Human Behavior in the Social Environment, 29(2), 266–281. https://doi.org/10.1080/10911359.2018.1527739
- Bethel, J. W., Foreman, A. N., & Burke, S. C. (2011). Disaster preparedness among medically vulnerable populations. American Journal of Preventive Medicine, 40(2), 139–143. https://doi.org/10.1016/j.amepre.2010.10.020
- Carvallo, J. P., Hsu, F. C., Shah, Z., & Taneja, J. (2021). Frozen out in Texas: Blackouts and Inequity. The Rockefeller Foundation. Retrieved July 28, from https://www.rockefellerfoundation.org/case-study/frozen-out-in-texas-blackouts-and-inequity/#:~:text=About%2010%25%2D11%25%20of,compared%20to%20predominantly%20white%20areas.
- Clark-Ginsberg, A. (2016, March). What’s the difference between reliability and resilience. Department of Homeland Security, 1932–4537.
- Clark, S., Peterson, S., Rivera-Gutiérrez, R., Zambrana-Rosario, A. C., & Shelly, M. (2022). Impact of Infrastructure Disruptions on Puerto Rican Household Capabilities, Health, and Well-Being. Natural Hazards Center Public Health Grant Report Series, 21. Natural Hazards Center, University of Colorado Boulder. https://hazards.colorado.edu/public-health-disaster-research/impact-of-infrastructure-disruptions-on-puerto-rican-household-capabilities-health-and-well-being
- Clark, S. S., Seager, T. P., & Chester, M. V. (2018). A capabilities approach to the prioritization of critical infrastructure. Environment Systems and Decisions, 38(3), 339–352. https://doi.org/10.1007/s10669-018-9691-8
- Crymble, A., Dennett, A., & Hitchcock, T. (2018). Modelling regional imbalances in English plebeian migration to late eighteenth‐century London. The Economic History Review, 71(3), 747–771. https://doi.org/10.1111/ehr.12569
- Cutter, S. L., Boruff, B. J., & Shirley, W. L. (2003). Social vulnerability to environmental hazards. Social Science Quarterly, 84(2), 242–261. https://doi.org/10.1111/1540-6237.8402002
- Dargin, J. S., & Mostafavi, A. (2020). Human-centric infrastructure resilience: Uncovering well-being risk disparity due to infrastructure disruptions in disasters. Plos One, 15(6), e0234381. https://doi.org/10.1371/journal.pone.0234381
- Das, S. (2013). Travel cost method for environmental valuation. Center of Excellence in Environmental Economics, Madras School of Economics, Dissemination Paper, 23.
- Day, R., Walker, G., & Simcock, N. (2016). Conceptualising energy use and energy poverty using a capabilities framework. Energy Policy, 93, 255–264. https://doi.org/10.1016/j.enpol.2016.03.019
- Department of Homeland Security (DHS). (2013). NIPP 2013: Partnering for critical infrastructure security and resilience. Retrieved from https://www.cisa.gov/sites/default/files/publications/national-infrastructure-protection-plan-2013-508.pdf
- Ferman, M., Sparber, S., & Limón, E. (2021). 2 million Texas households without power as massive winter storm drives demand for electricity. The Texas Tribune. Retrieved from https://www.texastribune.org/2021/02/15/rolling-blackouts-texas/
- Geurs, K. T., & van Eck, J. R. R. (2001). Accessibility measures: Review and applications. Evaluation of accessibility impacts of land-use transportation scenarios, and related social and economic impact.
- Haenssgen, M. J., & Ariana, P. (2018). The place of technology in the capability approach. Oxford Development Studies, 46(1), 98–112. https://doi.org/10.1080/13600818.2017.1325456
- Henry, D., & Ramirez-Marquez, J. E. (2016). On the impacts of power outages during Hurricane Sandy—a resilience-based analysis. Systems Engineering, 19(1), 59–75. https://doi.org/10.1002/sys.21338
- Huq, S., Kovats, S., Reid, H., & Satterthwaite, D. (2007). Reducing risks to cities from disasters and climate change. Environment and urbanization, 19(1), 3–15. https://doi.org/10.1177/0956247807078058
- Hwang, J., Bi, X., Morales, N., & Camp, E. V. (2021). The economic value of freshwater fisheries in Florida: An application of the travel cost method for black crappie fishing trips. Fisheries Research, 233, 105754. https://doi.org/10.1016/j.fishres.2020.105754
- Inter-Agency Standing Committee. (2008). Human rights and natural disasters: Operational guidelines and field manual on human rights protection in situations of natural disasters. Brookings-Bern Project on Internal Displacement.
- Jeffers, R. F. (2021, March 5). Perspectives on equitable energy resilience [PowerPoint slides]. Sandia National Laboratories (SAND2021-1377 PE). Retrieved from https://www.energy.gov/sites/default/files/202105/2.2_SETO_Resilience_Workshop_Valuing_Resililience_Bobby_Jeffers.pdf
- Jeffers, R. F., Baca, M. J., Wachtel, A., DeRosa, S., Staid, A., Fogleman, W. E., & Currie, F. M. (2018). Analysis of microgrid locations benefitting community resilience for Puerto Rico. Sandia National Lab.(SNL-NM), Albuquerque, NM (United States).
- Li, L., Ma, Z., & Cao, T. (2020). Leveraging social media data to study the community resilience of New York City to 2019 power outage. International Journal of Disaster Risk Reduction, 51, 101776.
- Marshall, J., Wiltshire, J., Delva, J., Bello, T., & Masys, A. J. (2020). Natural and manmade disasters: vulnerable populations. In Global health security (pp. 143–161). Springer. https://doi.org/10.1007/978-3-030-23491-1_7
- Miller, R. L. (2016). Economics Today (18th ed.). Pearson.
- Morris, J. D., & Cabanatuan, M. (2019). PG&E: Massive power shut-off to hit 800,000 customers, could extend nearly a week. San Francisco Chronicle.
- Mulcahy, S. (2021). Many Texans have died because of the winter storm. Just how many won’t be known for weeks or months. The Texas Tribune. Retrieved from https://www.texastribune.org/2021/02/19/texas-power-outage-winter-storm-deaths/
- Nambiar, S. (2013). Capabilities, conversion factors and institutions. Progress in Development Studies, 13(3), 221–230. https://doi.org/10.1177/1464993413486547
- Nateghi, R., Guikema, S. D., Wu, Y., & Bruss, C. B. (2016). Critical assessment of the foundations of power transmission and distribution reliability metrics and standards. Risk Analysis, 36(1), 4–15. https://doi.org/10.1111/risa.12401
- Nussbaum, M. (2003). Capabilities as fundamental entitlements: Sen and social justice. Feminist economics, 9(2–3), 33–59. https://doi.org/10.1080/1354570022000077926
- Opp, S. M. (2017). The forgotten pillar: A definition for the measurement of social sustainability in American cities. Local Environment, 22(3), 286–305. https://doi.org/10.1080/13549839.2016.1195800
- Orengo-Aguayo, R., Stewart, R. W., de Arellano, M. A., Suárez-Kindy, J. L., & Young, J. (2019). Disaster exposure and mental health among Puerto Rican youths after Hurricane Maria. JAMA Network Open, 2(4), e192619. https://doi.org/10.1001/jamanetworkopen.2019.2619
- Osmani, S. R. (2016). The capability approach and human development: Some reflections. UNDP. Retrieved from http://hdr.undp.org/en/content/capabilityapproach-and-humandevelopment-some-reflections.
- Robeyns, I. (2005). The capability approach: A theoretical survey. Journal of Human Development, 6(1), 93–117. https://doi.org/10.1080/146498805200034266
- Robeyns, I. (2017). Wellbeing, freedom and social justice: The capability approach re-examined. Open Book Publishers.
- Robeyns, I. (2020). Wellbeing, place and technology. Wellbeing, Space and Society, 1, 100013. https://doi.org/10.1016/j.wss.2020.100013
- Sandia National Laboratories. (2020). Performance metrics to evaluate utility resilience investments (SAND2021-5919). Retrieved from https://www.synapseenergy.com/sites/default/files/Performance_Metrics_to_Evaluate_Utility_Resilience_Investments_SAND2021-5919_19-007.pdf
- Sen, A. (1992). Inequality reexamined. Clarendon Press.
- Sen, A. (1999). Commodities and capabilities. OUP Catalogue.
- Sen, A. (2005). Human rights and capabilities. Journal of Human Development, 6(2), 151–166. https://doi.org/10.1080/14649880500120491
- Shawhan, D. L. (2019). Using stated preferences to estimate the value of avoiding power outages: A commentary with input from six continents. In P. Larsen, H. Sanstad, A. H, K. H. LaCommare, & J. H. Eto (Eds.) Frontiers in the Economics of Widespread, Long-Duration Power Interruptions: Proceedings from an Expert Workshop (IV1–32). Berkeley Lab
- Sherrieb, K., Norris, F. H., & Galea, S. (2010). Measuring capacities for community resilience. Social Indicators Research, 99(2), 227–247. https://doi.org/10.1007/s11205-010-9576-9
- Sullivan, M., Collins, M. T., Schellenberg, J., & Larsen, P. H. (2018). Estimating power system interruption costs: A guidebook for electric utilities. United States. https://doi.org/10.2172/1462980
- Tietenberg, T., & Lewis, L. (2018). Environmental and natural resource economics. Routledge.
- United Nations Development Programme (UNDP). (2014). Human development report 2014: Sustaining human progress-reducing vulnerabilities and building resilience. United Nations. Retrieved from http://hdr.undp.org/en/content/human-development-report-2014.
- Van Aalst, M. K. (2006). The impacts of climate change on the risk of natural disasters. Disasters, 30(1), 5–18. https://doi.org/10.1111/j.1467-9523.2006.00303.x
- Wachtel, A., Melander, D., & Jeffers, R. (2021). Measuring Societal Infrastructure Service Burden. Web. https://doi.org/10.2172/1846088
- World Health Organization. (2015, May 19). Accessibility. Retrieved from https://www.who.int/gender-equity-rights/understanding/accessibility-definition/en/
- Yang, Y., Tatano, H., Huang, Q., Liu, H., Yoshizawa, G., & Wang, K. (2021). Evaluating the societal impact of disaster-driven infrastructure disruptions: A water analysis perspective. International Journal of Disaster Risk Reduction, 52, 101988.
- Zhang, F., Wang, X. H., Nunes, P. A., & Ma, C. (2015). The recreational value of gold coast beaches, Australia: An application of the travel cost method. Ecosystem Services, 11, 106–114. https://doi.org/10.1016/j.ecoser.2014.09.001