
 ?Mathematical formulae have been encoded as MathML and are displayed in this HTML version using MathJax in order to improve their display. Uncheck the box to turn MathJax off. This feature requires Javascript. Click on a formula to zoom.
ABSTRACT
The purpose of this research paper is to implement a machine learning model with the integration of the supply chain occupational reference (SCOR) model to develop an artificial intelligence-based system for resilient and sustainable supplier selection for a pharmaceutical company. Initially, the SCOR 4.0 model with the integration of Best Worst Method (BWM) has been used to develop the framework of customer satisfaction and to identify the critical elements of the suppliers. Later, the gradient boosting machine learning model has been implemented to classify the supplier as well as rank the suppliers from best to worst based on the acceptability score. The result shows that the gradient boosting algorithm performs well as a classifier, where the supplier with the most acceptability score represents the best supplier and the supplier with the least acceptability score represents the worst supplier. This study contributes to our understanding of how and when integrated SCOR and machine learning models can help improve supplier selection.
1. Introduction
Suppliers are an important component of the supply chain because their performance has an indirect and significant impact on customer satisfaction. Over the last two decades, resilience and sustainability concerns have grown in importance in SCM (Ghamari et al., Citation2021). The idea of sustainability has emerged as an essential way of thinking across a variety of business domains as a direct result of the rising awareness of social occupations and the preservation of the natural environment.Apart from that, the company supply chain is increasingly threatened by pandemics, natural, man-made, or mechanical hazards such as surges, seismic tremors, fires, transportation mishaps, strikes, attacks, and so on. These disasters interrupt the supply chain, which harms firms through lost productivity, revenue, competitive advantage, profitability, and so on. As a consequence of this, it is necessary to take a resilient approach to the supply chain to secure the buyer from disruptions and deficiencies. Since a supplier can affect the overall performance of a supply chain, companies must take resilience in supplier selection decisions to reduce risk (Amindoust, Citation2018; Didier et al., Citation2018; Ghamari et al., Citation2021; Zhaoa et al., Citation2021).
The SCOR model was established by the Supply Chain Council (SCC) to monitor chain performance to acquire a competitive advantage and improve organizational performance. It establishes a common language for deciding, organizing, and implementing supply chain procedures (Delipinar & Kocaoglu, Citation2016; Munson & Santa-Eulalia, Citation2014). The SCOR model has been successfully used in a variety of sectors, including the pharmaceutical industry, to identify efficient supplier solutions and this model can be used in conjunction with other Multi-Criteria Decision Making (MCDM) tools and methods to facilitate supplier selection (Es-Satty et al., Citation2020). Nevertheless, in today’s digital era, there are fundamental changes in the structure of supply chains such as the integration of new technology. Supply chain structure development with evolving technologies is critical for staying up with the times. The new supply chain requirements should be precisely determined, and new metrics should be carefully determined, taking into account new requirements. Digital technology and information systems are newly treated as two new metrics in the SCOR model, and this novel model is known as SCOR 4.0, which is a structured three-level hierarchical framework to analyze supply chain performance (Ayyildiz & Taskin Gumus, Citation2021). Previously researchers have widely used different MCDM methods such as AHP, Hybrid Best Worst Method (BWM), Fuzzy Topsis, Pythagorean fuzzy AHP, or other decision-making models with the traditional SCOR model for supplier selection (Ayyildiz & Taskin Gumus, Citation2021; Huang et al., Citation2021; Lima-Junior & Carpinetti, Citation2016; Nazim & Yaacob, Citation2017). Nevertheless, MCDM procedures frequently result in enormously complicated models that are challenging to handle and analyze.
Machine learning (ML) has recently attracted more attention as a result of its effectiveness in a variety of applications ranging from image categorization to a variety of decision-making challenges. The applications of ML approaches have increased dramatically in recent years due to the explosion of data. In a predictive setting, methods such as data envelopment analysis supervised learning, and unsupervised learning has shown very outstanding performance (Tavana et al., Citation2016). Furthermore, machine learning can tolerate inaccuracies, uncertainty, and imprecise information to achieve robustness when replicating human decision-making behavior. These functions not only solve the problem of scalability and rapidity, but they also reduce the drawbacks of earlier approaches and meet the demands of ever more difficult supplier networks (Sepehri, Citation2020). The developments of artificial intelligence (AI) have drawn the attention of many researchers, considering how they can be used in supplier risk management (Abdulla et al., Citation2019; Batta, Citation2020; Mirkouei & Haapala, Citation2014). However, as the amount of data that needs to be processed expands the efficiency of the traditional methods decreases. Because of this, researchers came up with several approaches such as machine learning, big data analysis, and cloud computing that have a high capability to analyze and interpret enormous amounts of data. To give this research a new dimension, we implemented machine learning with the integration of SCOR 4.0 implemented.
The object of this research is to develop a machine learning model-based supplier selection system with the integration of the SCOR 4.0 model. First, we developed a 3-level based SCOR 4.0 model to identify the supplier performance related criterion and attributes for a local pharmaceutical company. Secondly, To calculate the weights of each attribute and criterion, BWM has been used for all the 3 levels of the SCOR 4.0 model. Finally, we implement a gradient boosting machine learning algorithm to classify the supplier and find out the most potential supplier.
2. Literature review
2.1. SCOR model for supply chain performance evaluation
Identifying relevant and appropriate criteria for supplier performance assessment is one of the most challenging parts of supplier selection (Alavi et al., Citation2021). A company’s performance is heavily dependent on the performance of its suppliers. For this, the evaluation of a supplier’s performance for development should be linked with the entire supply chain’s performance evaluation. The SCOR model is one way of performance measurement of the supply chain that is frequently used by practitioners. The Supply Chain Council (SCC) established this model back in 1996, which provides a hierarchy of performance evaluation criteria (Lima-Junior & Carpinetti, Citation2016). Hwang et al. (Citation2008) created a SCOR model based on three-level performance metrics to evaluate the supply chain process and enhance the performance of sourcing. The researchers used a regression model to examine the performance metrics. Raut et al. (Citation2012) suggested a hierarchical approach based that incorporates AHP and Data Envelopment Analysis (DEA) and considers both the quantitative and qualitative factors for supplier selection. Authors suggested that the most likely candidates for such programs are the highly efficient and low efficient suppliers. Badi and Ballem (Citation2018) used BWM for supplier selection in the pharmaceutical supply chain in Libya. The researchers considered five different criteria such as cost, quality, supplier profile, flexibility, and delivery for supplier selection. The study’s results showed that price is the most important factor, followed by quality in second place and the company’s profile in third. Along the same line, Oroojeni Mohammad Javad et al. (Citation2020) implemented BWM to find the green supplier Khouzestan Steel Company located in Iran. The researchers proposed a three-step method that helps the company decision-makers rank different suppliers and choose the one with the best green innovations abilities.
With the right deployment of resources, these vendors with efficient infrastructure could achieve high-performance levels. In another research, Lu et al. (Citation2016) created a framework using the SCOR model for evaluating the performance of humanitarian supply chains. For performance evaluation, the researchers developed a 14 metrics-based SCOR model addition to this, numerous decision-making strategies for dealing with the process of supplier evaluation, particularly in the context of supplier selection, have been presented in the relevant body of academic literature (Ayyildiz & Taskin Gumus, Citation2021; Luitzen et al., Citation2001; Wendler-Bosco & Nicholson, Citation2020; Wu & Barnes, Citation2018). Mañay et al. (Citation2022) used the SCOR model with the integration of MCDM to assess the supply chain performance of the Ecuadorian flower industry. The authors measure the performance level of each construct and identified the external factors that need to be improved. Jain et al. (Citation2022) used the SCOR model as the basic performance evaluation hierarchy. In this research, the authors assessed the sustainability performance of a company’s e-waste supply chain to meet the sustainability goal. In another research, Huang et al. (Citation2021) applied Data DEA and SCOR model to evaluate the operational efficiency of ports. The authors analyzed the operational efficiency of different key ports of different cities based on the ship’s inward and outward. Along the same line, He and Zhu (Citation2022) developed a risk indicator system using DEA and SCOR model for the elderly care service industry to enhance risk management capabilities.
2.2. Machine learning for supplier selection
In recent years, a variety of strategies have emerged, each based on a different set of criteria, to identify the best possible suppliers. The MCDM approach is one of the methods that is utilized the most frequently. However, the drawback of existing multi-criteria supplier selection and performance evaluation models for development is the model itself. Methods such as the Analytic Hierarchy Process (AHP), the Analytic Network Process (ANP), and the Fuzzy Analytic Hierarchy Process (Fuzzy AHP) are used in the majority of the studies and these methods require decision-makers to make judgments based on comparisons. Even though these methods are good for dealing with vague or qualitative information, they often restrict the number of factors and suppliers that can be examined at analyzed the same time (Park et al., Citation2010; Pilkington & Mahmoud, Citation2016; Zeydan et al., Citation2011; Zhao et al., Citation2021). With the rise of AI, ML has been used in several ways in various domains of supply chain management, such as selecting, evaluating, and developing resilient and sustainable suppliers. Mirkouei and Haapala (Citation2014) investigated how to choose the most suitable supplier for a biomass supply chain by taking into account both qualitative and quantitative aspects. The researchers implemented Decision Tree (DT) for supplier classification and Support Vector Machines (SVM) to identify the potential supplier. Along the same line, Abdulla et al., (Citation2019) proposed a hybrid supplier selection model by combining AHP and the machine learning model. The researchers applied a DT classifier to classify the good and bad suppliers. In another research, Cavalcante et al. (Citation2019) proposed a data-driven model combined with a SML model for resilient supplier selection. The findings imply that this model can be useful for identifying portfolios of hidden, high-risk suppliers and for prioritizing risk mitigation actions. Islam et al. (Citation2021) investigated the influences of forecasting methods on supplier selection. The researchers suggested a model with two stages for both the selection of suppliers and the distribution of orders. They applied Relational Regressor Chain (RRC) method for better forecasting accuracy and identification of suitable suppliers and order quantities. In another research, Ayyildiz and Taskin Gumus (Citation2021) proposed a three-level based SCOR 4.0 model for the evaluation of supply chain performance. The researchers integrated hybrid BMW and Pythagorean fuzzy AHP with the SCOR 4.0 model to find out the weights of the metrics. Alavi et al. (Citation2021) proposed a model based on MCDM and machine learning for sustainable supplier selection under uncertainty. The proposed decision support system can be used for supplier risk assessment to manage uncertainties in the field of health care, manufacturing, or other sectors. Zhang et al. (Citation2016) investigated the Ranking Neural Network (RankNet) ML model for supplier evaluation and selection as well. In their research, new suppliers were taken into account for each customer order, even when the customer placed multiple orders. The ML model that was developed as a result of this research improved with time because it was able to acquire knowledge from previous experiences, and the more data that was available, the simpler it became. A Multi-Agent Systems (MASs) method has been proposed by Ghadimi et al. (Citation2019) to address sustainable supplier performance evaluation and selection procedures. These processes aim to establish an appropriate structure of communication channels, organized exchange of information, and clarity among suppliers and manufacturers. In another research, Mustafa et al. (Citation2020) implemented several ML models such as artificial neural network (ANN), DT classifier, bayesian classifiers, and k-nearest neighbor (KNN). They developed a data set consisting of 1000 supplier profiles and classify the data using these ML models to identify the risky suppliers. Along the same line, Sepehri (Citation2020) This study proposed a framework for predicting supplier future value that incorporates contract history data, interpersonal value, and supply network attributes for supplier selection and managing relationships. The researchers implemented Clustering techniques and DT for supplier performance evaluation, selection, and relationship management.
The relevant literature on supplier selection used in this research is mentioned in , followed by existing research gaps and the contribution of this research.
Table 1. Summary of relevant themes in supplier selection literature.
The above discussion shows that despite a gradually growing body of knowledge on resilient and sustainable supplier selection, till now no research has used the integration of SCOR 4.0 and ML approach together that focuses on assessing supplier performance evaluation and selection. To bridge this gap, we adopted the application of SCOR 4.0 and a supervised machine learning approach to rank the supplier based on their profile and identify the most potential suppliers. The adoption of SCOR 4.0 and gradient boosting machine learning model that could rank the supplier based on their profile and identify the most potential supplier. The contribution of this study is summarized as follows:
Integration SCOR 4.0, and machine learning approach to select the best resilient and sustainable supplier.
Implementation of SCOR 4.0 to develop the assessment framework of supply chain performance evaluation and customer satisfaction.
Implementation of a supervised machine learning model (gradient boosting) to rank the suppliers and find out the best supplier.
Demonstrate the efficacy of SCOR 4.0 integrated ML approach in supply chain management.
3. Case study: pharmaceutical industry
In the pharmaceutical sector, the challenge of sustainable supplier selection is crucial. Global business organizations have become increasingly concerned about the environmental impact of their manufacturing and other practices during the past few decades. Thus, sustainability factors are integrated into the supplier selection process to create a green supplier selection. This issue is enhanced by the fact that the pharmaceutical sector is unique from other industries in that patient care is its primary objective (Stević et al., Citation2020). Managing and selecting pharmaceutical raw materials, and supplies for vital healthcare services has a significant impact on the quality and form of patient care and accounts for a significant proportion of supply chain expenses (Ishizaka et al., Citation2022). Apart from that, the COVID-19 pandemic’s severe shortage of essential medical supplies created significant procurement difficulties in the healthcare supply chain. The discussion on how to improve supply chain resilience in healthcare has picked up steam because maintaining the availability of such items during disruptions is essential. Healthcare supply chains now have more interdependencies and efficiency awareness due to expanding demand, rising costs, and more competition. As a supply network’s complexity rises, risk also does as well (Craighead et al., Citation2020; Hossain et al., Citation2016). Hospitals across the world have been impacted by the severe shortage of essential medical supplies like personal protective equipment, ventilation systems, and medicines for COVID-19 treatment (Chamola et al., Citation2020). During this pandemic, supply chain resilience is significantly impacted by the purchasing decisions made by pharma companies and medical supply manufacturers, as well as by suppliers (Spieske et al., Citation2022). Considering these concerns, we have chosen the pharmaceutical industry as our research field.
4. Methodology of research
This section describes the detailed research methodology of our approach. This research was conducted in a structured way with several stages. The detailed research methodology is presented in the following followed by a detailed description of each phase.
Figure 1. Research methodology.
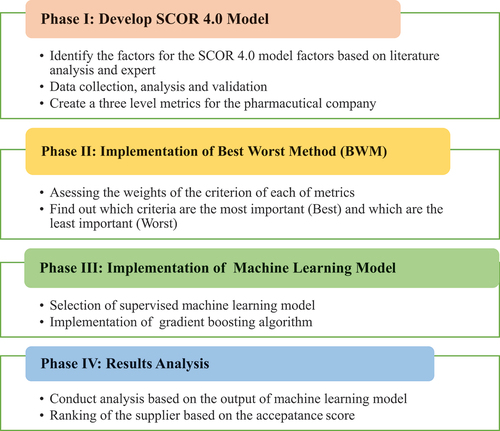
4.1. Phase I: development of the SCOR 4.0 model
This section discusses the development strategies of the SCOR 4.0 model for our research.
4.1.1. Data collection and analysis
Data collection and analysis include identification, screening, eligibility, and final selection. The findings were analyzed using a combination of theory-driven and data-driven approaches. For our data collection, a survey and interview were conducted with different local industry experts, academicians, and researchers via face-to-face and phone calls interviews. However, regarding the inclusion and exclusion criteria, industry experts work in the supply chain area for pharmaceutical companies, while academic experts conduct extensive research in this area are chosen. As a result, these experts are capable of understanding supplier data, evaluation criteria, and selection criteria effectively. A paper-based survey form was sent out to ten experts, of which one was unwilling to participate, and three have not completed the entire survey. Finally, we proceed with the survey input from six experts. These experts have direct experience in the area of subject interest as well as decent managerial experience (two of them for a period of five years), while others have extensive hands-on experience. Our experts have been selected from a wide range of educational backgrounds and with different levels of managerial and industry experience to ensure that we take into account every individual’s point of view in the selection process. This resulted in a reduction in bias and was sufficient for the purpose. Through their years of experience, the experts in are capable of figuring out which factors are most important when choosing a supplier.
Table 2. Supply chain expert’s profiles from industry and academia.
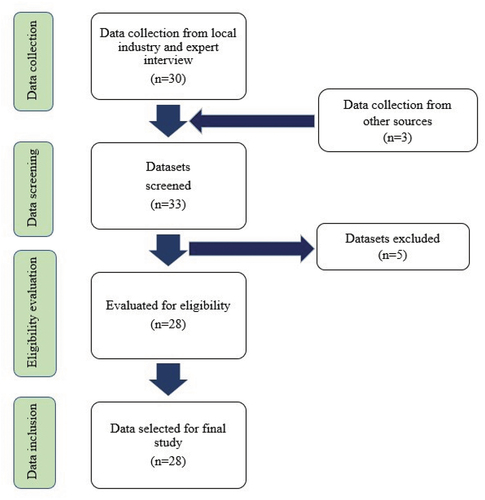
illustrates the strategy for the data collection and analysis process. We collected data from different local pharmaceutical companies, and academic and industry experts. Initially, we received a screened data set of 33 suppliers from different local suppliers of a pharmaceutical company. We screened all the data sets and excluded the data which were not closely related to this research. In the next step, we evaluated our existing data to check eligibility. We validated the data by fitting it into a normal distribution. Finally, we had a data set of 28 suppliers which were eligible for this research.
Figure 2. Strategy for data collection and analysis process.
4.1.2. Data validation
After data collection, we validated the data using the normal distribution. In this phase, we evaluated the eligibility of the gathered data using MINITAB statistical software and fit in the normal distribution. Here the null hypothesis represents that data is normally distributed and the alternative hypothesis represents that data is not normally distributed. We used the p value from the normal distribution of every distinct criterion. A statistically significant result is one with a p-value greater than 0.05, in that case, the null hypothesis is accepted which means the alternative hypothesis is rejected. As we have a total of 41 criteria, all p-values were determined individually. We have found all our p-value to be greater than 0.05, which signifies that the given data is normally distributed.
4.1.3. Create SCOR 4.0 model
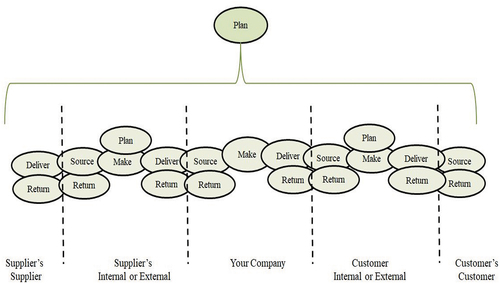
The SCOR model is a screening tool for supply chain performance management. It helps users understand how an organization runs its business and figure out which parts are most important to better customer experience and satisfaction (Munson & Santa-Eulalia, Citation2014). In 1996, the Supply Chain Council (SCC) came up with the idea of the SCOR model to help businesses improve the efficiency of their supply networks and give a process-based way to measure the performance of the supply chain (Ayyildiz & Taskin Gumus, Citation2021). Plan, Source, Make, Deliver, and Return are the five management processes that makeup SCOR which are further broken down into categories, elements, tasks, and activities. In addition, performance attributes and metrics are the two types of components that comprise the performance section of the SCOR model. A performance attribute is a compilation of metrics that are utilized in the process of describing a strategy, whereas an attribute is utilized in the process of evaluating the objectives of a strategy (Ayyildiz & Taskin Gumus, Citation2021). shows the visual representation of the SCOR model.
Figure 3. Framework of SCOR model (Zangoueinezhad et al., Citation2011).
We identified the performance attributes and developed a 3-level based SCOR 4.0 model for the pharmaceutical industry from a detailed literature review and face-to-face interviews with academic and industry experts. shows the 3 levels SCOR 4.0 model where level 1 defines the process that is used to describe the high-level configuration in a supply chain and level 2 differentiates the level 1 process based on strategies and tactics. Finally, the level 3 processes represent the step needed to be performed to accomplish the level 2 process.
Table 3. SCOR 4.0 model for the pharmaceutical industry.
4.2. Phase II: implementation of best worst method (BWM)
This section discusses the detailed implementation procedure of BWM for this research work.
4.2.1. Best worst method (BWM)
Rezaei (Citation2015) introduced BWM as an MCDM approach for calculating the weight of each criterion by minimizing the number of pairwise comparisons between criteria and inconsistent preferences. It is also possible to use it to determine the importance weights of the criteria that are employed in the stages of a problem. BWM can also be applied to the solution of a variety of decision-making issues arising in the real world, including those of business, healthcare, and engineering. In theory, this strategy can be applied in any situation in which the objective is to rank a group of options and pick one of those rankings as the best option (Pamučar et al., Citation2020). In this research, we chose BWM because of its calculation flexibilities and decision-making properties.
To determine the weight of the criteria for the ML model, we applied BWM to all three levels of the SCOR 4.0 model. The steps for finding the weights of each criterion are given below.
Step 1: Determine the set of decision criteria (C1, C2, C3, … … Cn).
Step 2: Identify the Most Important (Best) and Least Important (Worst) criteria.
Step 3: Make a pairwise linguistic comparison using the linguistic scale as shown in . shows the scales of linguistic terms and constructs the best to another vector, AB = (AB1, AB2, AB3 … . ABn) where ABj represents the level of importance of the most important criteria B over criterion (Ayyildiz & Taskin Gumus, Citation2021).
Table 4. Linguistic scale for best worst method (BWM).
Step 4: Similarly, to Step 3, make a pairwise comparison with the worst criterion to the other criterion and develop the others to the worst vector.
where shows the level of importance of criterion j over the least important criterion W (Ayyildiz & Taskin Gumus, Citation2021).
Step 5: Determine the optimal weight of each of the criteria (W1, W2, W3, …… …Wn). The main objective of Step 5 is to find the optimal weights of the criteria to maximize the disparity between and
have to be minimized. The following mathematical problem can be constructed by incorporating nonnegative constraints as well as the constraint for the total sum of all weights (Ayyildiz & Taskin Gumus, Citation2021).
This mathematical model can be represented as EquationEquation (1)(1)
(1) as follows:
Subject to
4.2.2. Calculation of the weights of the criterion
As stated earlier, we applied BWM to find the optimal weights and rank of the criterion. To rank this type of large matrix, each level needs to be weighted. In this study, first, we found out the weights of the level 1 criterion both from industry and academic experts and reviewed the survey data to find out the importance of each criterion in terms of weightage. After that, we followed the weight calculation steps of BWM mentioned in section 4.2.1 both for level 2 and level 3, respectively. We needed at least three criteria in the MCDM models to find out the weights. But in our level 2, we had some metrics where the criteria are only 2. In that case, we took expert opinions. shows the terms used in level 1. The glossary of level 2 and level 3 metrics are given in in the appendix section.
Table 5. Glossary of level 1 metric.
After the implementation of BWM for level 1 metrics, We obtained the weights for REL, FLEX, RES, COS, DT, IS, SER as 0.26087, 0.156522, 0.015622, 0.078261, 0.026087, 0.034783, 0.286957 respectively. We also got the value of for level 1 matrices as 0.05217. represents the weight of the criteria of level 1 metrics.
Table 6. Weight of level 1 criterion.
shows the final weights of the SCOR 4.0 model. A ranking was also done to find out the best and most important criteria in each of the groups of metrics.
Table 7. Final weight calculation using BWM.
4.3. Phase III: implementation of machine learning model
This section discusses the selection and implementation of the ML model in this research.
4.3.1. Gradient boosting machine learning (ML) model
Machine Learning (ML) is a popular topic right now for businesses looking for novel ways to use data to improve their operations. Companies can forecast market changes with the help of machine learning and can ensure that the forecasts are correct and updated by constantly receiving new data (Judith & Daniel, Citation2018). Many different algorithms are used in machine learning to improve operations and explain information with possible outputs. The ML model learns to predict the output using the training data. After the model has been trained, it will respond to specific input by returning the desired output when that input is given (Allgurin & Filip, Citation2018). The ML model is broken into three major parts. The first part is the decision process, where the model inputs some labeled or unlabeled data (Zhang, Citation2017). Based on these data, it predicts a pattern for their decision-making process. Followed by a decision process, an error function helps the model rectify the error and store necessary information in the memory to assist in future decision-making (Batta, Citation2020). An example of supplier selection using machine learning is illustrated in .
Figure 4. Supplier selection using machine learning (Cavalcante et al., Citation2019).
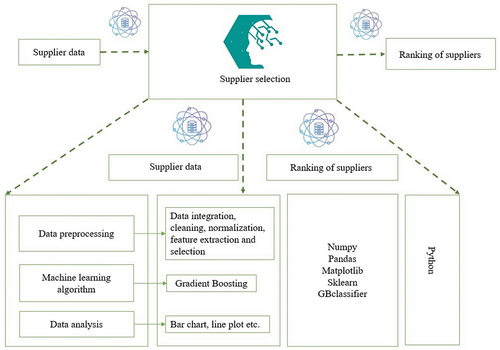
In this research, we selected the gradient boosting ML model because it uses advanced regularization that helps to improve model generalization abilities. Gradient boosting is a highly effective scalable end-to-end tree boosting system and a widely used ML method. The concept of boosting came from the sense that a weak learner can be improved (Bentéjac et al., Citation2021; Dorogush et al., Citation2018). Apart from that, if the iterative approach is not appropriately regularized, this algorithm may undergo from over-fitting (Bentéjac et al., Citation2021). The attributes of gradient boosting are listed below.
Learning rate
Depth (maximum) of the tree
The rate of subsampling for random samples size
Number of features
The minimum of samples needed to segment an internal node
Algorithm 1
Represents the gradient boosting pseudo code that we have implemented in this research.
Algorithm 1. Gradient boosting.
4.4. Phase IV: results analysis
In this section, the experiment results are presented and discussed with suitable illustrations.
4.4.1. Confusion matrix of gradient boosting
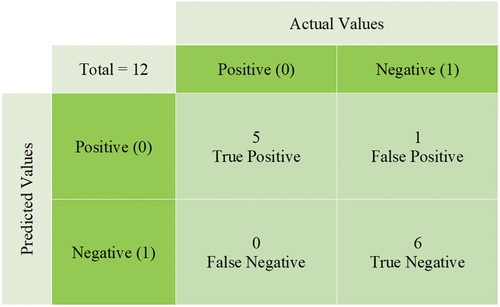
The confusion matrix visualizes the performance of a classification model. shows a 2 × 2 confusion matrix for the gradient boosting algorithm. Here we had a total of 12 predicted values that aligned the actual value for true positive (TP) and true negative (TN). One data point was falsely predicted for the Gradient Boosting algorithm. This false positive value causes Type-I error due to the prediction of the opposite sign datapoint. The model predicted one opposite signed value, whereas there was no false negative (FN) value which means no value was falsely predicted.
Figure 5. Confusion matrix of gradient boosting algorithm.
4.4.2. Ranking of the suppliers
As discussed earlier, we applied the gradient boosting ML algorithm to find out the acceptance score of the suppliers. To prevent our model from overfitting, we divided the train and test dataset into a 70:30 ratio (Roshan et al., Citation2022). We also applied feature extraction and feature selection to increase the accuracy of the model, eliminate redundant data and boost the learning process. Initially, we fitted our supplier data in a data frame and fitted X and Y with the supplier ratings and the ranking of the criteria obtained from BWM shown in . We fitted the X and Y training dataset with the gradient boosting classifier with an ‘n’ estimator of 10 and a random state of 30. After finally fitting the model, the feature importance was determined between the supplier ratings and the rank of the BWM. In this way get the feature importance score, which shows how the data are related compared to all the suppliers. Now in our case, as the rank was used for the training dataset, the less the score the better the supplier is. To visualize the result, we converted the score to an acceptance score which made it easy for us to understand that the highest weight is the best supplier. Furthermore, we have normalized the acceptance score within the range of 0 to 1, where 1 represents the best supplier. shows the supplier’s acceptance score for the gradient boosting algorithm and the acceptance scores in descending order.
Table 8. Acceptance score for gradient boosting.
5. Discussion of the results
The section provides an explanation and interpretation of the results by comparing them with the previous studies. Previously many research works have been conducted where the SCOR model with the integration of MCDM has been used for supplier selection and very few research works have been performed only using machine learning techniques for supplier selection and performance evaluation. Previously Wilson et al. (Citation2020) implemented random forest and Zhao et al. (Citation2021) used K fold cross-validation machine learning algorithm for supplier selection. In this perspective, the proposed model in this paper is the first unified approach, where the SCOR 4.0 model with the integration of gradient boosting machine learning algorithm has been implemented for supplier selection. In this research, we considered 28 different raw material suppliers of a local pharmaceutical company. For this, we grouped the main criterion of the suppliers under 7 categories which are reliability, flexibility, cost, responsiveness, digital technology, information systems, and services. Extra metrics, such as digital technology and information systems, are included in the SCOR model to construct the SCOR 4.0 model with a hierarchical metric framework. The BWM has been used to determine the most and least important criteria of the SCOR 4.0 model. We developed the level 1 metrics based on reliability, flexibility, cost, responsiveness, digital technology, information systems, and services. Level 2 and level 3 metrics have been developed based on level 1 metrics. As discussed earlier, we used BWM to find out the weights of level 2 and level 3 metrics. For this purpose, we used 9 different linguistic variables to perform the pairwise comparison between the criterion of each level of metrics. After the final weightage calculation for the criterion of each level of metrics, we applied the gradient boosting ML algorithm to rank the supplier. represents the acceptance scores and the rank of the 28 suppliers in descending order. From , we can also evaluate the performance of the suppliers. Among all the 28 suppliers, Supplier number 20 (S20) and supplier number 3 (S3) ranked at the position of 1 with an acceptance score of 1.0. So, we can conclude that S21 and S3 are the best performing supplier. Apart from that, Supplier number 21 (S21) ranked 27 with an acceptance score of 0.89955, which represents the weakest performed supplier among all the 28 suppliers. To measure the performance of our implemented gradient boosting model, we have calculated the accuracy and error rate of our algorithm from the confusion matrix. shows the values of true positive = 5, false positive = 1, false negative = 0, and true negative = 6. So, our implemented gradient boosting model has an accuracy of 91.6% in supplier selection and the error rate is 8.4%. The performance calculation of gradient boosting algorithm of our research has shown in in the appendix section. Sepehri (Citation2020) used the K fold cross-validation machine learning technique for supplier selection, where the researchers were able to achieve 92.83% accuracy. Because their dataset was larger compared to ours. However, in our study, we were able to achieve the precession percentage of 83.33% which measures the correctly predicted number of suppliers, whereas the precision percentage achieved by (Sepehri, Citation2020) was 70.1%. The findings of the experiment demonstrate that using SCOR 4.0 in combination with machine learning can assist in identifying risk-free suppliers based on any supplier dataset. The decision-makers in charge of policy can acquire evaluations of which suppliers or combinations of suppliers are the most critical in terms of the risks and can impact supply chain performance. Therefore, the implementation of resilient and sustainable supplier selection in conjunction with artificial intelligence-based decision-making strategies has the capability of composing a reliable system of supplier selection in any manufacturing environment.
6. Implications
This section discusses the implications of this research from theoretical, practical, and company perspectives.
6.1. Theoretical contribution and practical implication
This investigation has several implications for supplier development strategies. The primary objective of supplier development is to identify prospective suppliers who can enhance a company’s past performance and future capabilities. Firstly, machine learning can improve supply chain risk management methods because it permits the minimization of complexities in risk management models through the analysis of historical data and predicted outcomes, which can substitute a variety of simplifying hypotheses. Secondly, because the proposed model is based on a process of learning, it has the potential to make the decision-making process more flexible and can dynamically analyze previous data to make better decisions. Finally, the methodologies illustrated in this cannot only can improve existing connections but also uncover potentially high-value partnerships in a supplier network based on historical patterns of profiles and value outcomes. Compared to the existing literature on resilient and sustainable supplier selection, this study appears to be the first to use SCOR 4.0 and machine learning to select the most potential supplier. This study also demonstrates the effectiveness and scalability of machine learning in the domain of supply chain management. The methodology presented in this research has academic as well as industrial uses. The insights gained from this artificial intelligence-based setting show both the flexibility and power of machine learning techniques for making decisions in supplier management that are flexible and proactive. Companies can be more efficient with their resource allocation when they have a clear understanding of their suppliers’ different profiles and divide them into groups that are easy to manage. Additionally, this methodology can be applied in a variety of industrial scenarios that can assist policymaker’s intake decisions while taking into account the choice of suppliers under diverse circumstances. In addition, humanitarian organizations operating mostly in distant places can gain direct insights from this study’s findings. In conclusion, the proposed methodology contributes significantly to academic and industrial environments.
6.2. Implication for company executives and policymakers
This research demonstrates an in-depth insight into choosing the most potential suppliers for a pharmaceutical company. This research will help policymakers in an organization determine which potential suppliers can be included in their supply chain. This study’s methodology will be a useful resource for decision-makers seeking to comprehend the impact of diverse supplier selection criteria and sub-criteria. This snapshot would act as a standard for firms in the same field and can enhance the company’s overall growth and future capabilities. The methodologies described in this study give a lens for purchasing corporations to not only strengthen existing connections but also to uncover potentially high-value partnerships in a supplier network based on historical profiles and performance outcomes of any supplier.
7. Conclusion and future works
With the advancement of globalization, it is becoming increasingly apparent that the supply chain must incorporate resilience to gain a sustainable competitive benefit. The interconnected imperatives of resilience to disruption and sustainability in evaluating and selecting suppliers’ performance have become a serious strategic problem. In recent years, environmental pressures have made the supply chain and its management essential for organizations to remain competitive in the marketplace. However, a company’s supply chain is exposed to a greater number of risks, including those posed by nature, humans, and technology. These risks include pandemics, floods, earthquakes, accidents involving transportation, labor strikes, and terrorist attacks. These disasters cause supply chain disruptions, which are detrimental to organizations due to lost productivity, revenue, competitive advantage, profitability, etc. To protect the buyer from shortages and disruptions, it is essential to implement a resilient supply chain strategy for supplier selection. The fundamental objective of this investigation is to develop a model that incorporates a novel method for the selection of resilient and sustainable suppliers. The proposed methodology is divided into two phases. At the very first, the SCOR 4.0 model was created and the evaluation criteria’s relative weights were solved by using BWM. The final weights of those criteria are then employed to rank the best and the most important criteria of each of the group metrics. In the second phase, the gradient boosting ML algorithm is implemented to rank the supplier based on the criteria of the group metrics. The cognitive ambiguity of experts can be collected separately and then added to the model, which is one of the advantages of the hybrid method. The SCOR model is more flexible when it comes to processing information, which is another competitive advantage of the method shown.
In this research, there are some limitations. We have considered the supplier only related to pharmaceutical sectors. So, in the future other sectors can be explored. Apart from that, we have applied only a gradient boosting algorithm for supplier ranking. In the future, researchers can combine the proposed model with other Machine learning algorithms like Random Forest (RF), Decision Tree (DT), Support Vector Machine (SVM), etc. Additionally, the usage of rule-based systems learning algorithms such as deep learning approaches, which could be useful in identifying numerous causalities and enhancing model performance, would also be advantageous.
Disclosure statement
The Coalition for Disaster Resilient Infrastructure (CDRI) reviewed the anonymised abstract of the article, but had no role in the peer review process nor the final editorial decision.
Additional information
Funding
Notes on contributors
Md Muzahid Khan
Md Muzahid Khan is a Lecturer in the Department of Military Institute of Science and Technology, Dhaka, Bangladesh. His research interests include supply chain management, sustainability quantification, healthcare and machine learning.
Imranul Bashar
Imranul Bashar completed his bachelor's in Industrial and Production Engineering from the Military Institute of Science and Technology, Dhaka, Bangladesh. His research interests include supply chain management, machine learning, and healthcare.
Golam Morshed Minhaj
Golam Morshed Minhaj completed his bachelor's in Industrial and Production Engineering from the Military Institute of Science and Technology, Dhaka, Bangladesh. His research interests include supply chain analytics and healthcare.
Absar Ishraq Wasi
Absar Ishraq Wasi completed his bachelor's in Industrial and Production Engineering from the Military Institute of Science and Technology, Dhaka, Bangladesh. His research interests include supplier management, data science, and optimization.
Niamat Ullah Ibne Hossain
Niamat Ullah Ibne Hossain is an assistant professor in the Department of Engineering Management at Arkansas State University, USA. His main research interests include machine learning, model-based systems engineering (MBSE)/SysML, data analytics, systems dynamics simulation, and systems resilience, risk & sustainability management.
References
- Abdulla, A., Baryannis, G., & Badi, I. (2019). Weighting the key features affecting supplier selection using machine learning techniques. International Conference on Transport and Logistics. University of Niš. December, 1–6. https://doi.org/10.20944/preprints201912.0154.v1
- Alavi, B., Tavana, M., & Mina, H. (2021). A dynamic decision support system for sustainable supplier selection in circular economy. Sustainable Production and Consumption, 27(February), 905–920. https://doi.org/10.1016/j.spc.2021.02.015
- Allgurin, A., & Filip, K. (2018). Exploring machine learning for supplier selection-A case study at bufab Sweden AB. 1–81.
- Amindoust, A. (2018). A resilient-sustainable based supplier selection model using a hybrid intelligent method. Computers & Industrial Engineering, 126(September), 122–135. https://doi.org/10.1016/j.cie.2018.09.031
- Amiri, M., Hashemi-Tabatabaei, M., Ghahremanloo, M., Keshavarz-Ghorabaee, M., Zavadskas, E. K., & Banaitis, A. (2020). A new fuzzy BWM approach for evaluating and selecting a sustainable supplier in supply chain management. International Journal of Sustainable Development and World Ecology, 00(00), 1–18. https://doi.org/10.1080/13504509.2020.1793424
- Ayyildiz, E., & Taskin Gumus, A. (2021). Interval-valued pythagorean fuzzy AHP method-based supply chain performance evaluation by a new extension of SCOR model: SCOR 4.0. Complex & Intelligent Systems, 7(1), 559–576. https://doi.org/10.1007/s40747-020-00221-9
- Badi, I., & Ballem, M. (2018). Supplier selection using rough bwm-mairca model : A case study in pharmaceutical supplying in libya. Decision Making: Applications in Management and Engineering, 1(2), 1–18. https://doi.org/10.31181/dmame1802016b
- Batta, M. (2020). Machine learning algorithms - a review. International Journal of Science and Research (IJ international Journal of Science and Research (IJ, 9(1), 381. https://doi.org/10.21275/ART20203995
- Bentéjac, C., Csörgő, A., & Martínez-Muñoz, G. (2021). A comparative analysis of gradient boosting algorithms. In Artificial Intelligence Review (Vol. 54, Issue 3). Springer Netherlands. https://doi.org/10.1007/s10462-020-09896-5
- Cavalcante, I. M., Frazzon, E. M., Forcellini, F. A., & Ivanov, D. (2019). A supervised machine learning approach to data-driven simulation of resilient supplier selection in digital manufacturing. International Journal of Information Management, 49, 86–97. https://doi.org/10.1016/j.ijinfomgt.2019.03.004
- Chamola, V., Hassija, V., Gupta, V., & Guizani, M. (2020). A comprehensive review of the COVID-19 pandemic and the role of IoT, drones, AI, blockchain, and 5G in managing its impact. IEEE Access, 8, 90225–90265. https://doi.org/10.1109/ACCESS.2020.2992341
- Craighead, C. W., Ketchen, D. J., & Darby, J. L. (2020). Pandemics and supply chain management research: Toward a theoretical toolbox*. Decision Sciences, 51(4), 838–866. https://doi.org/10.1111/DECI.12468
- Delipinar, G. E., & Kocaoglu, B. (2016). Using SCOR model to gain competitive advantage: A literature review. Procedia - Social and Behavioral Sciences, 229, 398–406. https://doi.org/10.1016/j.sbspro.2016.07.150
- Didier, M., Broccardo, M., Esposito, S., & Stojadinovic, B. (2018). A compositional demand/supply framework to quantify the resilience of civil infrastructure systems (Re-CoDes). Sustainable and Resilient Infrastructure, 3(2), 86–102. https://doi.org/10.1080/23789689.2017.1364560
- Dorogush, A. V., Ershov, V., & Gulin, A. (2018). CatBoost: Gradient boosting with categorical features support. https://doi.org/10.48550/arXiv.1810.11363
- Es-Satty, A., Lemghari, R., & Okar, C. (2020). Supply chain digitalization overview SCOR model implication. 2020 13th International Colloquium of Logistics and Supply Chain Management, LOGISTIQUA 2020, 2–4. https://doi.org/10.1109/LOGISTIQUA49782.2020.9353936
- Ghadimi, P., Wang, C., Lim, M. K., & Heavey, C. (2019). Intelligent sustainable supplier selection using multi-agent technology: Theory and application for industry 4.0 supply chains. Computers & Industrial Engineering, 127(September 2018), 588–600. https://doi.org/10.1016/j.cie.2018.10.050
- Ghamari, R., Mahdavi-Mazdeh, M., & Ghannadpour, S. F. (2021). Resilient and sustainable supplier selection via a new framework: A case study from the steel industry. In Environment, development and sustainability (Vol. 24, Issue 8). Springer Netherlands. https://doi.org/10.1007/s10668-021-01872-5
- He, J., & Zhu, J. (2022). Evaluation on risk factors of elderly services from the perspective of integrated SCOR model. International Journal of Information Systems in the Service Sector, 14(1), 1–18. https://doi.org/10.4018/IJISSS.2022010102
- Hossain, N. U. I., Nur, F., & Jaradat, R. M. (2016). An analytical study of hazards and risks in the shipbuilding industry. In Proceedings of the international annual conference of the American society for engineering management (pp. 1–8). American Society for Engineering Management.
- Huang, T., Chen, Z., Wang, S., & Jiang, D. (2021). Efficiency evaluation of key ports along the 21st-century maritime silk road based on the DEA–SCOR model. Maritime Policy & Management, 48(3), 378–390. https://doi.org/10.1080/03088839.2020.1773558
- Hwang, Y. D., Lin, Y. C., & Lyu, J. (2008). The performance evaluation of SCOR sourcing process—the case study of Taiwan’s TFT-LCD industry. International Journal of Production Economics, 115(2), 411–423. https://doi.org/10.1016/J.IJPE.2007.09.014
- Ishizaka, A., Khan, S. A., Kheybari, S., & Zaman, S. I. (2022). Supplier selection in closed loop pharma supply chain: A novel BWM–GAIA framework. Annals of Operations Research. https://doi.org/10.1007/s10479-022-04710-7
- Islam, S., Amin, S. H., & Wardley, L. J. (2021). Machine learning and optimization models for supplier selection and order allocation planning. International Journal of Production Economics, 242, 108315. https://doi.org/10.1016/J.IJPE.2021.108315
- Jain, V., Kumar, S., Mostofi, A., & Arab Momeni, M. (2022). Sustainability performance evaluation of the E-waste closed-loop supply chain with the SCOR model. Waste Management, 147, 36–47. https://doi.org/10.1016/J.WASMAN.2022.05.010
- Judith, H., & Daniel, K. (2018). Machine learning for dummies. Journal of the American Society for Information Science, 35(5). https://doi.org/10.1002/asi.4630350509
- Lima-Junior, F. R., & Carpinetti, L. C. R. (2016). Combining SCOR® model and fuzzy TOPSIS for supplier evaluation and management. International Journal of Production Economics, 174, 128–141. https://doi.org/10.1016/j.ijpe.2016.01.023
- Lu, Q., Goh, M., & De Souza, R. (2016). A SCOR framework to measure logistics performance of humanitarian organizations. Journal of Humanitarian Logistics and Supply Chain Management, 6(2), 222–239. https://doi.org/10.1108/JHLSCM-09-2015-0038
- Luitzen, D. B., Eva, L., & Pierangela, M. (2001). A review of methods supporting supplier selection. European Journal of Purchasing & Supply Management, 80(3), 66–73. https://doi.org/10.1002/ad.1077
- Mañay, L. O. R., Guaita-Pradas, I., & Marques-Perez, I. (2022). Measuring the supply chain performance of the floricultural sector using the SCOR model and a multicriteria decision-making method. Horticulturae, 8(2), 168. https://doi.org/10.3390/horticulturae8020168
- Mirkouei, A., & Haapala, K. R. (2014). Integration of machine learning and mathematical programming methods into the biomass feedstock supplier selection process. FAIM 2014 - Proceedings of the 24th International Conference on Flexible Automation and Intelligent Manufacturing: Capturing Competitive Advantage via Advanced Manufacturing and Enterprise Transformation, January, 443–450. https://doi.org/10.14809/faim.2014.0443
- Munson, A. D., & Santa-Eulalia, L. A. D. (2014). A Systematic literature review of the supply chain operations reference (SCOR) model application with special attention to envrionnmental issues a systematic literature review of the supply chain operations reference (SCOR) model application with spec. January. https://doi.org/10.13140/RG.2.1.3618.7606
- Mustafa, S. K., Engin, E., Belkız, T., & Turan, P. (2020). Supplier selection with machine learning algorithms. Logistics 4 0, (Issue December 2020). https://doi.org/10.1201/9780429327636-3
- Nazim, R., & Yaacob, R. A. I. R. (2017). Criteria for supplier selection: An application of AHP-SCOR integrated model (ASIM). International Journal of Supply Chain Management, 6(3), 284–290.
- Oroojeni Mohammad Javad, M., Darvishi, M., & Oroojeni Mohammad Javad, A. (2020). Green supplier selection for the steel industry using BWM and fuzzy TOPSIS: A case study of Khouzestan steel company. Sustainable Futures, 2(October 2019), 100012. https://doi.org/10.1016/j.sftr.2020.100012
- Pamučar, D., Ecer, F., Cirovic, G., & Arlasheedi, M. A. (2020). Application of improved best worst method (BWM) in real-world problems. Mathematics, 8(8), 1342. https://doi.org/10.3390/MATH8081342
- Park, J., Shin, K., Chang, T. W., & Park, J. (2010). An integrative framework for supplier relationship management. Industrial Management & Data Systems, 110(4), 495–515. https://doi.org/10.1108/02635571011038990
- Pilkington, S. F., & Mahmoud, H. N. (2016). Using artificial neural networks to forecast economic impact of multi-hazard hurricane-based events. Sustainable and Resilient Infrastructure, 1(1–2), 63–83. https://doi.org/10.1080/23789689.2016.1179529
- Raut, R. D., Bhasin, H. V., & Kamble, S. S. (2012). Supplier selection using integrated multi-criteria decision-making methodology. International Journal of Operational Research, 13(4), 359–394. https://doi.org/10.1504/IJOR.2012.046223
- Rezaei, J. (2015). Best-worst multi-criteria decision-making method. Omega, 53, 49–57. https://doi.org/10.1016/J.OMEGA.2014.11.009
- Roshan, V., Stewart, J. H. M., Joseph, R., & Stewart, H. M. (2022). Optimal ratio for data splitting. Stat Anal Data Min: The ASA Data Sci Journal, 15(4), 15. https://doi.org/10.1002/sam.11583
- Sepehri, S. (2020). Supplier selection and relationship management : An application of machine learning techniques. Ontario, Canada: Brock University. https://dr.library.brocku.ca/handle/10464/14831
- Spieske, A., Gebhardt, M., Kopyto, M., & Birkel, H. (2022). Improving resilience of the healthcare supply chain in a pandemic: Evidence from Europe during the COVID-19 crisis. Journal of Purchasing and Supply Management, 28(5), 100748. https://doi.org/10.1016/J.PURSUP.2022.100748
- Stević, Ž., Pamučar, D., Puška, A., & Chatterjee, P. (2020). Sustainable supplier selection in healthcare industries using a new MCDM method: Measurement of alternatives and ranking according to COmpromise solution (MARCOS). Computers & Industrial Engineering, 140, 106231. https://doi.org/10.1016/j.cie.2019.106231
- Tavana, M., Fallahpour, A., DiCaprio, D., & Santos-Arteaga, F. J. (2016). A hybrid intelligent fuzzy predictive model with simulation for supplier evaluation and selection. Expert Systems with Applications, 61, 129–144. https://doi.org/10.1016/J.ESWA.2016.05.027
- Wendler-Bosco, V., & Nicholson, C. (2020). Port disruption impact on the maritime supply chain: A literature review. Sustainable and Resilient Infrastructure, 5(6), 378–394. https://doi.org/10.1080/23789689.2019.1600961
- Wilson, V. H., Prasad, A. N. S., Shankharan, A., Kapoor, S., & Rajan, J. A. (2020). Ranking of supplier performance using machine learning algorithm of random forest. International Journal of Advanced Research in Engineering and Technology, 11(5), 298–308. https://doi.org/10.34218/IJARET.11.5.2020.031
- Wu, C., & Barnes, D. (2018). Design of agile supply chains including the trade-off between number of partners and reliability. International Journal of Advanced Manufacturing Technology, 97(9–12), 3683–3700. https://doi.org/10.1007/S00170-018-2205-5
- Zangoueinezhad, A., Azar, A., & Kazazi, A. (2011). Using SCOR model with fuzzy MCDM approach to assess competitiveness positioning of supply chains: Focus on shipbuilding supply chains. Maritime Policy & Management, 38(1), 93–109. https://doi.org/10.1080/03088839.2010.533715
- Zeydan, M., Çolpan, C., & Çobanoģlu, C. (2011). A combined methodology for supplier selection and performance evaluation. Expert Systems with Applications, 38(3), 2741–2751. https://doi.org/10.1016/j.eswa.2010.08.064
- Zhang, X. -D. (2017). Chapter 6 machine learning. A Matrix Algebra Approach to Artificial Intelligence, 45(13), 223–235.
- Zhang, R., Li, J., Wu, S., Meng, D., & Deng, Y. (2016). Learning to select supplier portfolios for service supply chain. Plos One, 11(5), e0155672. https://doi.org/10.1371/journal.pone.0155672
- Zhaoa, P., Jia, S., & Xuea, Y. (2021, October). Resilient-sustainable supplier selection and order allocation under multi-tier supplier network. Researchgate.Net, https://www.researchgate.net/profile/Shoufeng-Ji/publication/355788632_Resilient-sustainable_supplier_selection_and_order_allocation_under_multi-tier_supplier_network/links/617e09c4eef53e51e10c4b17/Resilient-sustainable-supplier-selection-and-order-alloca
- Zhao, L., Qi, W., Zhu, M., & Xie, L. (2021). A study of supplier selection method based on SVM for weighting expert evaluation. Discrete Dynamics in Nature and Society, 2021, 1–11. https://doi.org/10.1155/2021/8056209
Appendix
Table A1. Glossary of level 2 and 3 metrics.
Table A2. Performance calculation of gradient boosting algorithm.