?Mathematical formulae have been encoded as MathML and are displayed in this HTML version using MathJax in order to improve their display. Uncheck the box to turn MathJax off. This feature requires Javascript. Click on a formula to zoom.
ABSTRACT
Transportation systems, such as railways, are considered critical infrastructure. It is essential to identify potential hazards that can affect the functionality of these systems and quantify metrics that can be used for resilience-informed decision-making. This paper develops an integrated probabilistic model for seismic multi-hazard risk and restoration assessment of railway systems by accounting for the effects of seismic waves propagation, liquefaction and landslide as main phenomena affecting the integrity of distributed networked infrastructure; this is done via a GIS-based user interface. An illustrative case study is then presented to assess the seismic risk and restoration of the Tehran-Sari railway in Iran. The implementation results demonstrate the capability of the presented methodology to quantify physical metrics (including combined damage state of network components, component- and system-level functionality and restoration) and economic loss. These metrics can assist officials with implementing retrofit plans to reduce loss and improve the resilience of railway system segments.
1. Introduction
Transportation systems provide a chain of alternatives to support the mobility of people and goods as one of the most crucial infrastructure systems. They not only connect businesses and the chains of support supplies and services but also offer accessibility to vital resources for daily activities. Besides, when an emergency occurs, these systems play a vital role in survivor evacuation, rescue operations, and community reconstruction and recovery. Nevertheless, these systems might encounter various risks from potential hazards, ranging from natural and technological events to intentional human-caused acts. Interruptions in the service of these systems can hence result in cascading events within the systems and/or other interconnected lifelines. In addition, direct damage to the physical transportation infrastructure can lead to indirect loss to other systems including social and economic systems. It has been revealed in some research that the frequency of disasters, whether natural or human-made, has increased to an unprecedented level over the last decades (Guha-Sapir et al., Citation2012). The impacts of these events on transportation systems have been intensified due to increased system complexity and interdependency, and urbanization in potentially vulnerable areas (Faturechi & Miller-Hooks, Citation2015).
In the line with the above concerns, it is a well-accepted fact that damaging earthquakes being always among the most severely destructive natural hazards can induce a considerable amount of property, environmental, social and economic loss to a region or even extend to a country. Substantial lifeline damage observed in past earthquakes, such as Loma Prieta, 1989; Northridge, 1994; Kobe, 1995; Tohoku, 2011, has highlighted a vital need to adopt proper mitigation, recovery and adaptation strategies which can help a community to improve the integrity, sustainability, resilience of its infrastructure and lifeline systems (Roohi & Hernandez, Citation2020; Roohi et al., Citation2020). To achieve this objective, evaluating the current condition of infrastructure and identifying its vulnerability is an essential step in pre-disaster mitigation efforts. This requires estimating the seismic damage and consequent losses of lifeline systems that are crucial for emergency planners, government, and financial organizations. In recent years, many studies have addressed seismic vulnerability and resilience of lifeline systems including gas distribution systems (Farahani et al., Citation2020, Citation2020b; Koike et al., Citation2004), interdependent buildings and infrastructure networks (Dolce et al., Citation2021; Estêvão, Citation2019; Rangrazjeddi et al., Citation2022), electric power (Liu et al., Citation2021; Poulos et al., Citation2017), water distribution system (Roohi et al., Citation2022; Shojaeian et al., Citation2021) and railway networks subject to shaking, liquefaction and tsunami (Decò et al., Citation2013; Lai et al., Citation2014; Zhu et al., Citation2020).
Railways as one of the most important infrastructures are characterized by their wide spatial distribution (Kameda, Citation2000). These systems consist of several components: tracks, embankments, stations, tunnels and bridges, whose seismic performance and vulnerability are vastly different. Railway systems are generally subjected to various seismic hazards since they may pass through different geographical regions with various seismic characteristics. The need for seismic loss estimation has long been recognized and led to the development and advancement of risk and loss estimation methodologies. These methodologies often employ a probabilistic view of seismic hazard and vulnerability modeling (Lai et al., Citation2014). Shinozuka et al. (Citation2000) developed a methodology to estimate the effects of earthquakes on the performance of railway systems by integrating bridge and other structural performance models within a transportation network model. Since bridges are often considered vulnerable components of the railways, Shinozuka et al. (Citation2000) also investigated the seismic performance of retrofitted bridges. Kothalkar & Kadam (Citation2016) conducted a seismic vulnerability assessment of railways network to evaluate the seismic susceptibility of existing railway bridges by developing fragility curves for different damage states ranging from slight to complete damage. There are also studies in the literature focusing on indirect economic loss assessment; for example, a study performed by Tsuchiya et al. (Citation2007) evaluated the economic loss of the railways’ disruption subject to the hypothetical Tokai-Tonankai earthquake in Japan.
Despite recent studies in seismic risk modeling of railway networks, further research is still required to understand the seismic multi-hazard impacts on railway networks around the globe, especially in underdeveloped and developing countries. This highlights the need to develop methodologies and platforms that can provide a probabilistic measure for seismic vulnerability assessment by accounting for the effects of seismic wave propagation, liquefaction and landslide, as the three main phenomena affecting the integrity of distributed networked infrastructure subject to earthquakes.
The authors address the needs highlighted from previous exposition by developing an integrated probabilistic seismic multi-hazard risk and restoration modeling method of approach for resilience-informed decision-making in railway networks located in under-developed countries and communities. The methodology is capable of i) accounting for the effects of seismic wave propagation, liquefaction, and landslide, which are three main phenomena affecting the integrity of distributed networked infrastructure and ii) quantifying physical metrics (including component- and system-level functionality and restoration) and economic loss which assist officials with developing and implementing retrofit plans to reduce immediate loss and improve the resilience of railway system segments or developing recovery plans that could identify resources (e.g., construction material, labor, and accelerated construction equipment) needed for replacement of segments that are predicted to be the most vulnerable components of the railway network. The methodology consists of 1) railway and bridge inventory data collection, 2) seismic multi-hazard analysis, 3) physical damage and restoration analysis and 4) loss estimation, which can be implemented in a manner consistent with the HAZUS methodology. The methodology is illustrated using a real-world case study on seismic multi-hazard risk and restoration assessment of the Tehran-Sari railway, which is considered one of the most critical national segments in the Iran railway network (IRN). IRN is vulnerable to multi-hazards associated with frequent destructive earthquakes, and limited studies have addressed the multi-hazard seismic assessment of this network. Also, a GIS-based user interface is developed to comprehensively evaluate the seismic risk of the IRN by taking into account the effective components.
The remainder of this paper is organized as follows. First, the proposed method of approach and its implementation are discussed in detail. This is followed by a section presenting an illustrative case study to demonstrate the real-world implementation of the methodology. The paper ends with a discussion section presenting the implications of the results and challenges of implementing the methodology in underdeveloped countries.
2. Methodology
This section presents an integrated probabilistic seismic multi-hazard risk and restoration modeling method of approach for resilience-informed decision-making in railway networks. In particular, the main objective is to account for the multi-hazard effects of earthquakes consisting of seismic waves propagation, liquefaction and landslide. The individual and combined effects of these three seismic-induced hazards can significantly disrupt the integrity of distributed networked infrastructure including railways network. The methodology subsequently estimates the probabilistic measure of the combined damage state of network components, quantifies component- and system-level functionality and restoration of and performs an economic loss analysis. The methodology consists of the following four steps: 1) railway and bridge inventory data collection, 2) seismic multi-hazard analysis, 3) physical damage and restoration analysis and 4) loss estimation. The methodology can be implemented in a manner consistent with the HAZUS guideline. The following are the main steps of the methodology being discussed in more detail.
2.1. Railway and bridge inventory data collection
The methodology begins by collecting railway network infrastructure inventory data which includes the geographical location of various components of railway systems (e.g., railway segments, bridges, tunnels) and the classification of these components according to FEMA standards (FEMA, Citation2012). Location data and shapefile map of the network components are the primary data needed for GIS-based analyses. The attribute values of inventory data are then used as input to the following steps to evaluate the physical damage and loss to network components.
2.2. Seismic multi-hazard analysis
The second step is to perform a seismic multi-hazard analysis. This requires first investigating site conditions for the entire distributed network, which consists of fault and seismic condition of the study region of interest, liquefaction and landslide potential map, and dynamic properties of soil. These data and information are required to perform probabilistic seismic hazard analyses (PSHA). PSHA begins by describing the magnitude, location, and timing of earthquakes that cause structural damage. A source model composed of earthquake scenarios given by
is then developed, where each scenario has magnitude
, location
and rate
. Each scenario can be written as a function of its magnitude, location and rate as follows:
From the scenario location, distance to site, , can be determined. With
and
, the distribution of possible ground-motion levels for each scenario can be obtained using an attenuation relationship as follows:
PSHA can be performed by combining ground motion prediction models through logic trees and quantify seismic intensity measures consisting of PGA and spectral acceleration (e.g., 1.0 sec spectral acceleration). In addition, this step requires quantifying potential earth science hazards (PESH) parameters such as permanent ground deformation (PGD) and transient ground displacement (TGD). PGD is caused by liquefaction (lateral spreading and ground settlement) and landslide can be assessed by using the available liquefaction and landslide susceptibility maps and employing HAZUS guideline for evaluating the probability of liquefaction and landslide for a given susceptibility category. The probability of liquefaction for a given susceptibility category can be calculated as
where is the conditional liquefaction probability for a given susceptibility category at a specified level of PGA, Pml is the proportion of the map unit susceptible,
is the groundwater correction factor, and
is the moment magnitude correction factor. The expected value of liquefaction-induced PGD can be stated here as a function of PGA (Sadigh et al., Citation1986). Also, the landslide-induced permanent ground displacements are determined using EquationEquation (4)
(4)
(4) :
where is the expected displacement factor,
is the induced acceleration (in a decimal fraction of
’s), and
is the number of cycles. A relation derived from the results of (Makdisi et al., Citation1978) is used to calculate downslope displacements. Also, TGD results from seismic wave propagation and its impact can be estimated using 1.0 sec spectral acceleration, which is an output of PSHA.
2.3. Physical damage and restoration analysis
The third step is to perform damage and restoration analysis by i) estimating the exceeding probability for each damage state given PESH parameters (i.e., PGD and TGD) for each network component including nodes and links and ii) using the exceeding probability of damage estimates to quantify the functionality of system components days following an event. The following two subsections discuss these two steps in more detail.
2.3.1. Physical damage analysis
Damage analysis can be performed using fragility functions, assuming that infrastructure components having similar characteristics would perform identical subject to a given hazard event. Thus, fragility functions associated with various damage states are assigned to each component given its structural characteristics. A fragility function relates a given hazard intensity measure to the conditional probability of reaching or exceeding a particular damage state i, given by DS (i). Damage states consist of insignificant (or none), DS (1); moderate, DS (2); extensive, DS (3) and complete, DS (4). The fragility functions are often described by a lognormal cumulative distribution function given by:
where, is the median value of PESH parameter at which the railway component reaches the threshold of damage state, DS.
is the standard deviation of the natural logarithm of
parameter for DS.
is the standard normal cumulative distribution function. The damage analysis process should account for infrastructure components’ vulnerability to various
parameters as railways are vulnerable due to PGDs only, but bridges are vulnerable subject to both PGDs and TGDs. Therefore, the probability of exceeding each damage state for bridges must be combined to accurately account for the combined effects of
parameters and obtain the combined probability of exceeding a specific damage state
given by
and calculated using the following equation:
where is the
parameter index, and
is the number of
parameters considered in damage analysis. The combined probabilities for exceeding various damage states are then used to calculate discrete damage state probabilities, given by
, as follows:
2.3.2. Restoration analysis
The discrete damage state probabilities, are used to estimate the functionality of network components and determine the functionality of each component. Functionality is defined as a component’s capacity to serve its intended objectives consisting of structural integrity, safety, and utilities. The pre- and post-even functionality of a component i, is denoted by
and
, respectively, in which functionality states can be categorized into nonfunctional and functional states (i.e., in a broader classification) using a damage-to functionality model. It can also be estimated using restoration curves to estimate the functionality of each component which gives exceeding probability of damage states days following an event. If the damage-to-functionality models or restoration curves are not available for infrastructure components, the restoration curves can be employed to quantify the functionality percentage given by
where in restoration percent for damage state
at time
after an event.
2.4. Loss estimation
The final step is to employ the most probable damage state obtained from the combined discrete damage states probability calculation of Step 3 to perform an economic loss analysis. Direct economic loss estimation of the railway systems depends on the components’ locations and associated seismic hazard intensity measures. The economic loss of each segment, represented by , is calculated based on the probabilities of being in a particular damage state (
), the damage ratios (
) for each damage state,
, and the replacement value of the component.
s are computed by multiplying the compounded damage ratio (
) by the replacement value (
), for
segment as follows:
where the compounded damage ratio () is evaluated as a probabilistic combination of damage ratios as follows:
where is the probability of being in the damage state
. .
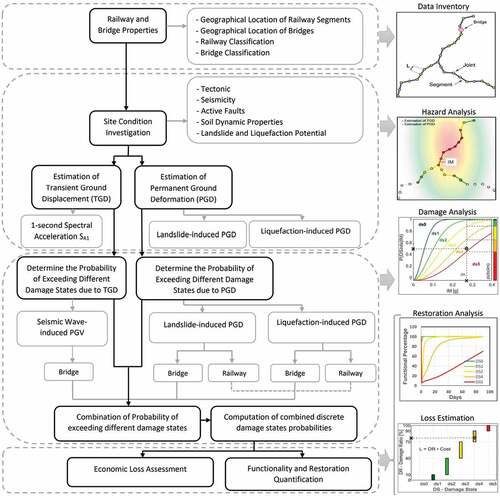
Figure 1. The step-by-step graphical framework of the current study.
3. Illustrative real-world implementation of the methodology
This section presents an illustrative case study to demonstrate the real-world implementation of the presented methodology in Section 2. First, a case study of Tehran-Sari railway in Iran is introduced. Then, a step-by-step discussion is presented on implementing the method of approach. This is followed by presenting the result obtained from seismic risk assessment.
3.1. Railway and bridge inventory data collection
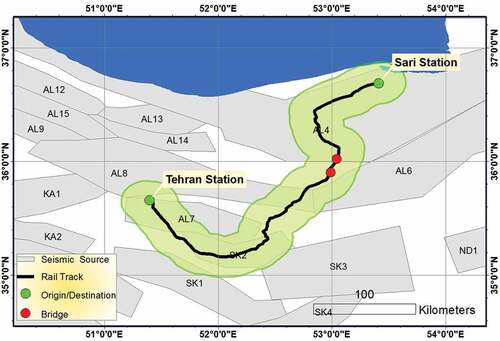
The IRN has the form of a star-shaped network where Tehran is located in the central area as a hub, and other regions are connected to it directly, as shown in . Importantly, Iran lies at the crossroads of East-West and North-South transportation corridors that are either active or potentially active. The western, northern and southern railways extension links to Turkey, Azerbaijan, and the Persian Gulf ports of Bandar Imam and Bandar Abbas, respectively. The north-east corridor connects Mashhad to Sarakhs as part of the Silk Road railway to link to the landlocked Central Asian Countries (The Railways of Islamic Republic of Iran, Citation2005).
Figure 2. The physical network of Iran railway network (The Railways of Islamic Republic of Iran, 2005).
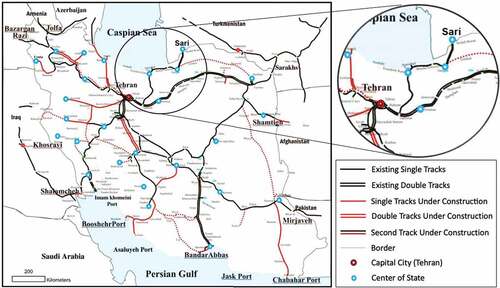
The northern railway is a line to the Caspian Sea that ends at the terminal of Amirabad and Bandar Torkaman and is part of a North–South corridor; it connects Russia and Scandinavia to the Persian Gulf and the Indian Ocean. The northern railway consists of 382 km of railroad passing through two different geographical conditions. The first one passes through high-mountain areas with the highest level point at Gadook by 2112-m height from the sea level, and the second one passes through plain areas with around 60-m height from the sea level. Both the mentioned geographical conditions could potentially cause landslide and liquefaction to occur (The Railways of Islamic Republic of Iran, 2005). This contrast between different parts of the northern railway is the main reason for selecting the Tehran-Sari railway as a case study here. The properties of the mentioned route are shown in and .
Figure 3. Satellite and aerial picture of the Tehran-Sari railway.
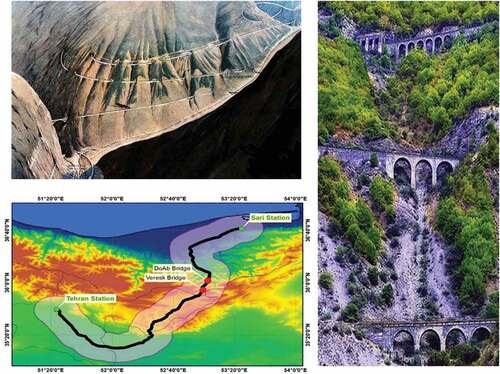
Table 1. The Tehran-Sari railway properties.
From a different point of view, railway transportation systems consist of numerous structural components located in diverse natural and built environments. Among the engineered components, bridges are seismically vulnerable structural components that should receive even further attention in a preventive disaster management strategy. In this aim, two critical bridges of the case studied, Veresk Bridge and DoAb Bridge, are considered to assess from a seismic vulnerability point of view. The Veresk Bridge – constructed in 1937 – is one of the most famous masonry arch bridges in the world. It is located in the Veresk district of Mazandaran Province. The bridge stands 110-m tall, and its arch measures 66 m long. It is made of cement mortar, sand, and brick with no reinforcement in its structure. The DoAb Bridge – constructed in 1934 – is a seven-span, non-reinforced masonry arched bridge, which is 140 m in length and 5 m in width. The properties of the mentioned bridges shown in are presented in (Ahamri et al., Citation2016).
Figure 4. Left: DoAb Bridge; Right: Veresk Bridge. both bridges are located on the map in .
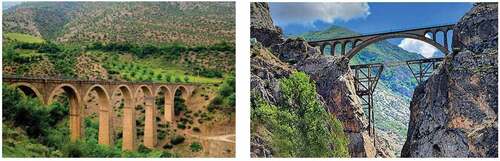
Table 2. The Tehran-Sari railway properties of the two studied bridges (Ahamri et al., Citation2016).
3.2. Seismic multi-hazard analysis
The railway loss estimation depends on the seismic hazard parameters, i.e., peak ground acceleration (PGA) and permanent ground deformation (PGD). These parameters are determined over the following sections.
3.2.1. Probabilistic seismic hazard analysis
In the current study, PGA is used as the ground motion parameter for the quantification of the seismic shaking according to the HAZUS methodology. Although the PGA is a commonly employed parameter in seismic hazard analyses, other ground-shaking intensity measures like Arias Intensity (AI) can also be employed in seismic risk assessment projects. In some studies, AI has been proven to be an effective predictor of damage potential (Campbell & Bozorgnia, Citation2010; Chousianitis et al., Citation2018; Foulser-Piggott & Goda, Citation2015).
Seismic hazard analysis for evaluating PGA can be performed through a deterministic or probabilistic approach. In a deterministic seismic hazard analysis (DSHA) a particular earthquake scenario is assumed based on which the hazard is then estimated (Reiter, Citation1991). A probabilistic seismic hazard analysis (PSHA) considers the uncertainties of earthquakes in an explicit manner. Some of the most critical uncertainties are the earthquake size, location, and time of occurrence. In this study, a PSHA is carried out employing the R-CRISIS Version 18.4.2 platform (R-CRISIS, Citation2018) in order to determine PGA. Source geometry, source seismicity and attenuation relationship are the necessary data for performing a PSHA. In terms of source geometry, seismic area sources of the studied region are presented in using the available data (Karimiparidari, Citation2014).
Figure 5. Seismic area sources of studied region using available data (Karimiparidari, Citation2014).
The source seismicity data is based on the study conducted (Karimiparidari, Citation2014). These seismic parameters have been calculated using historical data (before 1996) and instrumental records (after 1996). Seismic parameters of the employed seismic sources in the current study, consisting of the Poisson model and Gutenberg–Richter parameters, are presented in . and
indicate that the Gutenberg–Richter parameters and Mobs are the maximum observed magnitude in the considered seismic province. Since a 200 km radius around the railway is considered an active region in R-CRISIS, 25 main area sources contribute to the PSHA.
Table 3. Seismic parameters of the employed seismic sources in the current study (Karimiparidari, Citation2014).
The logic tree method is employed to determine the required PGA. For this aim, appropriate attenuation models are defined as the third input for R-CRISIS. Seven attenuation relations for the Alborz region with the respective user-defined weights applied are presented in . The final seismic hazard map based on R-CRISIS and PSHA method is shown in .
Figure 6. The final seismic hazard map analyzed using R-CRISIS.
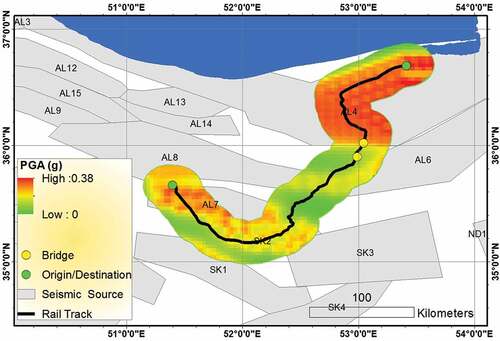
Table 4. The applied attenuation models and assigned weights.
Table 5. Summary of the attenuation models used in this study.
3.2.2. Permanent ground deformation
The high seismicity potential of Iran is prone to cause many geotechnical seismic hazards. The geographical and geological variety of the country, the existence of different mountain ranges, and coastal areas with sandy soils, among other reasons, are the main factors that make Iran a country where landslides and liquefaction can occur during or after an earthquake (Farahani et al., Citation2020a). The ground failures, caused by geotechnical seismic phenomena such as liquefaction (lateral spreading and ground settlement) and landslide, are localized in particular prone geographic zones. In this study, PGD is calculated and mapped using the HAZUS methodology (FEMA, Citation2012).
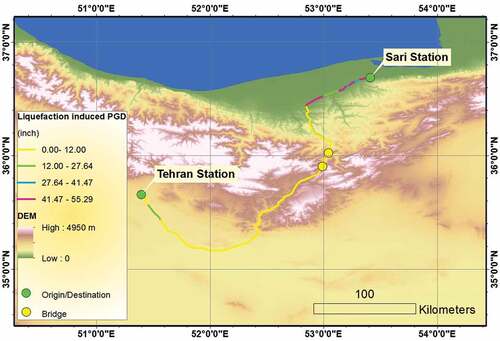
Liquefaction is the most critical hazard due to ground failure that can threaten infrastructure. In this study, the Iran liquefaction susceptibility map is used in order to calculate the liquefaction-induced PGD. This map is provided by the information from the International Institute of Earthquake Engineering and Seismology (IIEES), as shown in . The liquefaction-induced deformation map of the studied case is presented in . This map was obtained using liquefaction-induced PGD analyses described in Sec. 2.2.
Figure 7. Liquefaction susceptibility map of the current studied region (Komakpanah & Farajzadeh, Citation1996).
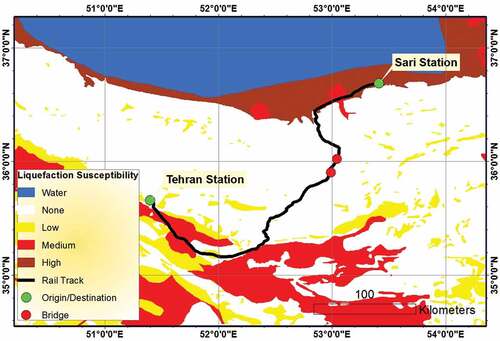
Figure 8. Liquefaction-induced deformation map of the Tehran-Sari railway and two mentioned bridges (30 m DEM is used).
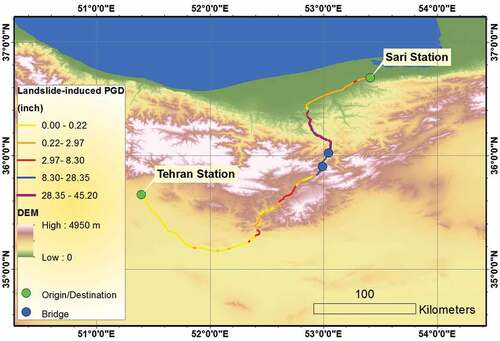
Based on Newmark’s model and ground motion data, two main approaches are used for earthquake-induced landslide hazard assessment: (i) the probabilistic approach (Chousianitis et al., Citation2016; Del Gaudio et al., Citation2003; Rathje & Saygili, Citation2011), which computes Newmark displacement for the standard probability of exceedances using a ground motion parameter, and (ii) the deterministic approach (Du & Wang, Citation2016; Saygili & Rathje, Citation2009), which considers a particular scenario high magnitude earthquake event. In contrast to the deterministic approach, which is dependent on a specific seismic scenario, the probabilistic approach considers various uncertainties associated with co-seismic landslide hazards. The landslide hazard evaluation requires the characterization of the landslide susceptibility of a region or sub-region’s soil/geologic conditions. For this purpose, we use the Iran landslide susceptibility map by the ‘Geological Survey of Iran’, 2001, as shown in , and critical acceleration at any location according to the HAZUS methodology. Finally, the landslide-induced displacement map of the Tehran-Sari railway and Veresk and DoAb bridges is carried out using GIS-based analyses as presented in . This map was obtained using landslide-induced PGD analyses described in Sec. 2.2.
Figure 9. Landslide susceptibility map of the current studied region (Geological Survey of Iran, 2001).
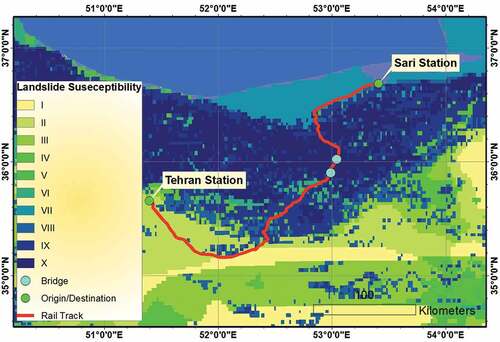
Figure 10. Landslide-induced displacement map of the Tehran-Sari railway, and Veresk and DoAb bridges.
3.3. Physical damage and restoration analysis
3.3.1. Physical damage analysis
According to the HAZUS methodology, the fragility curves are driven by potential earth science hazards (PESH) parameters (e.g., PGD and PGA). Damage functions or fragility curves for all railway system components are modeled as lognormal functions that give the probability of reaching or exceeding different damage states. Damage states are related to damage ratio, which is defined as the ratio of repair to replacement cost. Damage states describing the level of railway component damage are categorized into the slight, minor, moderate, extensive and complete categories. Each fragility curve is characterized by a median value of the ground motion (or failure) and an associated dispersion factor (lognormal standard deviation). Ground motion is quantified in terms of PGA, and ground failure is quantified in terms of PGD. The conditional probability of being in, or exceeding, a particular damage state (DS) given the PESH parameter is defined by Equationequation (6)(6)
(6) .
Different damage states’ definition for railway tracks (referring to the assembly of rails, ties and fastenings, and the ground on which they rest) and railway bridges are presented in , respectively. Also, the medians and dispersions of the related fragility curves are presented in . show the fragility curves of railway tracks and railway bridges, respectively.
Figure 11. Fragility curves of railway tracks (FEMA, Citation2012).
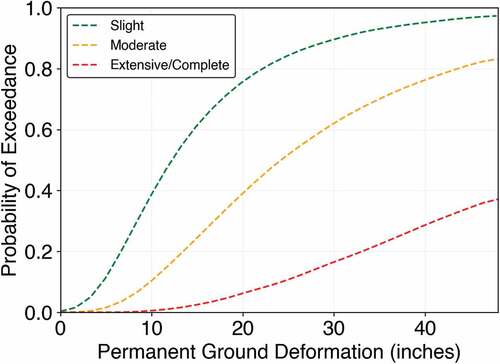
Figure 12. Ground shaking standard fragility curves for conventionally designed major bridges (FEMA, Citation2012).
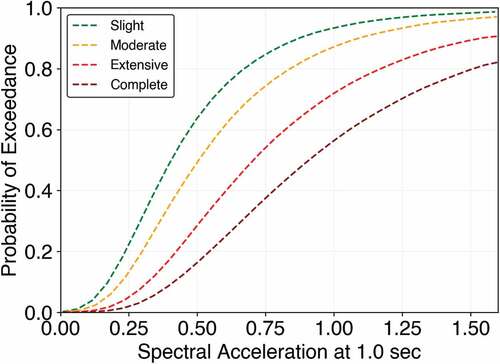
Table 6. Damage state definition of railway tracks (FEMA, Citation2012).
Table 7. Damage states definition of railway bridges (FEMA, Citation2012).
Table 8. Standard fragility curves properties of railway tracks (FEMA, Citation2012).
Table 9. Standard fragility curves properties of railway bridges (FEMA, Citation2012).
In order to evaluate the damage state of the studied bridges, ground shaking medians and PGD medians for the ‘standard’ fragility curves are modified according to the HAZUS recommendation. According to the properties of the studied bridges, such as the number of spans (N), width of the span (W), length of the bridge (L), and the skew angle (), PGD median modifiers are equal 1, and consequently, the values of the PGD medians are not changed in the modification process. Hence, the PGD medians and the dispersion
0.2 are used to evaluate ground failure-related damage state probabilities. However, for modifying the ground shaking medians of standard fragility curves, EquationEquation (13)
(13)
(13) is employed using two modification factors evaluated by EquationEquation (14)
(14)
(14) and (Equation15
(15)
(15) ).
where, is a modification factor related to the skew angle of the bridge,
is a factor that modifies the piers’ 2-dimensional capacity to allow for the three-dimensional arch action in the deck, and N is the number of bridge spans. Hence, the new ground shaking medians and the dispersion
0.6 are employed to evaluate the ground shaking-related damage state probabilities, as shown in . The results of seismic hazard analysis for both bridges, which are used as input motion properties for risk analyses, are presented in . For a multi-hazard assessment, combined exceeding probabilities are computed using EquationEquation (6)
(6)
(6) and presented in . As a result, the functionality of bridges is evaluated by combining the probability of exceeding of each damage state.
Table 10. Modified properties used in fragility analyses of bridges.
Table 11. Intensity measures used for bridges risk assessment (obtained from seismic hazard analysis results).
Table 12. Estimated shake-only, PGD-only and combined probability of exceeding of various damage states for bridge components of Tehran-Sari railway network.
As shown in , a map of the Tehran-Sari railway’s expected damage states is presented by computing the combined discrete damage states probabilities presented in Equationequation (7)(7)
(7) , (Equation8
(8)
(8) )and (Equation9
(9)
(9) ). Based on these equations, no damage state is estimated for both the Veresk and DoAb bridges, as presented in and . The figure shows that extensive damages are expected mostly in the plain sector where the probability of liquefaction (because of proximity to the Caspian Sea and high level of groundwater table level) and the shake intensity measure (i.e.,
) are high.
Figure 13. Expected damage state map for the Tehran-Sari railway. The figure shows extensive damages are expected mostly in plain sector where the probability of liquefaction and the shake intensity measure are high.
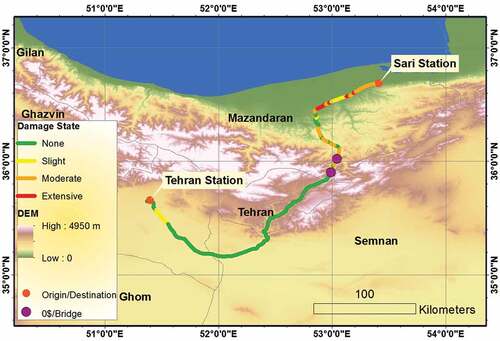
Table 13. Combined exceeding probability of various damage states obtained from estimated damage probabilities subject to shaking, liquefaction and landslide.
3.3.2. Restoration analysis
As discussed in Section 2.3.2, restoration analysis is performed to estimate the functionality of the Tehran-Sari railway track based on the functionality of various segments. The analysis is performed using discrete restoration functionality curves from the HAZUS guideline. These functions assume normal distributed functions for restoration. The discrete restoration functions used in this study are given in . Based on the mentioned restoration function and using EquationEquation (10)(10)
(10) , the functionality percentage of various segments were obtained and used to estimate the functionality of entire railway tracks as presented in . In the figure, the minimum and maximum values report the lowest and highest functionality estimated obtained for various segments and the mean value reports the functionality of the entire railway track. In addition, presents the system-level restoration curve for the railway network providing functionality percentage of the systems days following a design basis earthquake scenario. The results show that immediately after the event the system-level functionality can drop to 77.5% and after 90 days the functionality can recover to about 98.7%, close to pre-event functionality level. This metric allows understanding the immediate and post-event loss of functionality for the system, which can provide valuable information for management and planning for the railway system.
Figure 14. Functionality percentage of the railway tracks obtained based on HAZUS discrete restoration functions. The reported minimum and maximum values show the lowest and highest functionality for various segments and the mean value reports the functionality of the entire railway track.
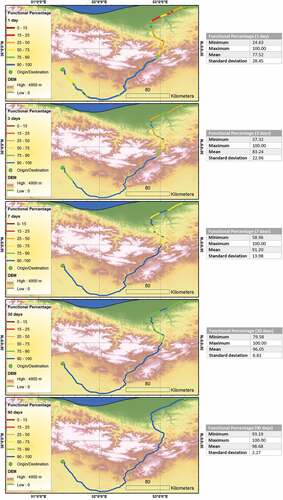
Figure 15. System level restoration curve for Tehran-Sari railway network providing functionality percentage of the systems days following a design basis earthquake scenario.
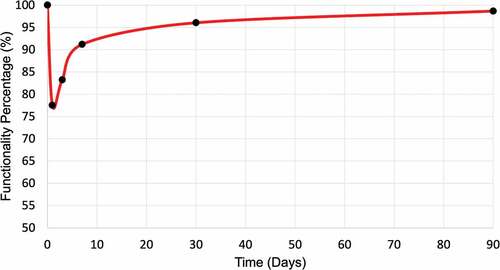
Table 14. Discrete restoration curves used for functionality analysis 1 day, 3 days, 7 days, 30 days and 90 days following seismic event (FEMA, Citation2012).
3.4. Loss estimation
Earthquakes are inevitable for locations near seismically active zones; thus, it is crucial to predict the potential losses and prepare for an unexpected situation. However, the effect of the disaster can be dramatically reduced by appropriate precautionary policies, which can be made by policymakers who are interested to know estimates of potential losses. The railway economic loss map is presented in using the rough estimations suggested by HAZUS. System components’ damage ratios, formulated as a fraction of the component replacement cost, which were proposed by HAZUS, are given in . The replacement value is quantified based on the costs in the United States, and the authors acknowledge that the replacement costs are different for Iran and the US. The authors could not gain access to the replacement cost for railway tracks or repair costs for bridges that experienced different damage states which could be available for the Iran Railway Network organization. Collecting or having access to repair, restoration and labor data can help to improve the accuracy of the risk and resilience model developed for Tehran-Sari railway networks. This highlights the need for data collection to better calibrate various components of the presented methodology in this paper.
Figure 16. Estimated economic loss map for the Tehran-Sari railway.
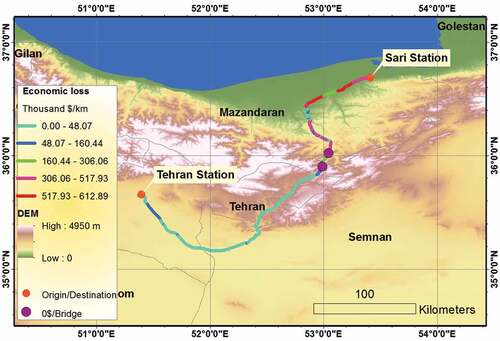
Table 15. Damage ratios and replacement values for railway track and railway bridge (FEMA, Citation2012).
4. Discussion
The previous section presented the implementation of the presented approach for seismic multi-hazard risk and restoration modeling of a railway network located in a complex geo-seismic region. The results show that the presented methodology can perform component- and system-level damage, functionality and restoration analysis by accounting for the combined effects of shake, liquefaction and landslide, as three major geo-seismic hazards. The physical and economic metrics quantified can assist officials with resilience-informed decision-making by identifying vulnerable components/segments of a distributed railway network along with quantifying the component-level and railway track-level restoration days following a major event. This information can help engineers to develop mitigation plans to minimize the impacts of seismic multi-hazards on the most critical and vulnerable segments of the railway infrastructure. For instance, the analysis showed that the segments of the Tehran-Sari railway track located in plain sectors could experience a high level of seismic damage mainly due to higher shake and liquefaction susceptibility, which highlights the need to develop mitigation and resilience plans for this part of the network. Officials could consider options such as i) developing and implementing retrofit plans to reduce immediate loss and improve the resilience of these segments or ii) developing recovery plans that could identify resources (e.g., construction material, labor, and accelerated construction equipment) needed for replacement of segments that are predicted to be the most vulnerable components of the network. In addition, chaining the physical models developed in this study with more advanced socio-economic models would allow under-develop countries to take advantage of recent advancements in community resilience measurement science from developed countries, including the US, European countries, and Japan, and also implementation of platforms to perform as most of the underdeveloped countries could not have access and benefit from advance regional risk and community resilience platforms (including HAZUS, IN-CORE, PELICUN and NEHRI SIM-Center DesignSafe). It should be noted that resilience planning in underdeveloped countries would not be feasible due to limited resources allocated for data collection, resilience planning, and adaptation. One of the main challenges of the current study was the lack of economic loss, retrofit and repair cost estimation methodologies and datasets to calibrate the economic metrics reported in this study. The authors believe communication of the outcomes of this study and similar studies can facilitate the development and implementation of effective policies that can lead to low-cost solutions to improve the resilience of underdeveloped countries. However, there is a critical need to develop risk and resilience measurement science for distributed systems such as railway networks in underdeveloped countries/communities by integrating and advancing the existing knowledge and methodologies. To address this need, our study focuses on developing a method of approach and its implementation for modeling railway networks located in low-resource countries and communities with complex geo-seismic prone regions. In addition, our study demonstrates the real-world implementation of the method of approach by combining and advancing data, methods, and processes from various resources to conduct a detailed assessment of seismic hazards of a major railway network in an underdeveloped country and provides all the data and software for interested users. This paper can inspire the development of similar models for infrastructure networks in other countries around the globe to achieve worldwide seismic resilience of communities. Appendix I presents the interface platform for the study here.
5. Conclusion
This paper presents an integrated probabilistic model for seismic risk assessment of railway network infrastructure. One main contribution of this method of approach is accounting for the multi-hazard effects of earthquakes, which consist of seismic wave propagation, liquefaction, and landslide. The individual and combined effects of these three seismic-induced hazards can significantly disrupt the integrity of distributed networked infrastructure, including railway networks. Also, this method of approach can consider bridges’ vulnerability, which is crucial for the connectivity of railway networks. The methodology consists of four steps: 1) railway and bridge inventory data collection, 2) seismic multi-hazard analysis, 3) physical damage and restoration analysis, and 4) loss estimation. The methodology can be implemented in a manner consistent with the HAZUS guideline. The outputs of the presented method of approach consist of the combined damage state of network components and economic loss estimates.
The method of approach was illustrated using a real-world case study of the Tehran-Sari railway, which is considered one of the most critical national segments in the Iran railway network (IRN). The results demonstrated that the Tehran-Sari railway segment could experience very limited seismic damage while two important railway bridges could experience no damage state subject to the design-basis earthquake level. The economic loss to the railway network is estimated to be up to 600,000 US dollars, mainly due to seismic physical damage to tracks, the most vulnerable segments of the system, which are located mostly in plain sectors mainly due to higher shake and liquefaction susceptibility. The results highlight the need to develop mitigation and resilience plans for this part of the Tehran-Sari railway network to minimize the economic loss of seismic multi-hazards on the most critical and vulnerable segments of the railway infrastructure.
The method of approach presented in this paper shows the capability to assess the multi-hazard seismic risk of real-world railway networks worldwide, which could lead to better management of these distributed networks and allocation of resources to mitigate the impacts of seismic events, thus improving the resilience of seismic-prone railway networks. Future work will focus on integrating probabilistic models of other major railway network facilities (including tunnels, stations, maintenance, fuel, and dispatch facilities), allowing officials to make informed decisions based on seismic risk evaluation of full railway network systems.
Disclosure statement
No potential conflict of interest was reported by the author(s).
Additional information
Notes on contributors
Saeideh Farahani
Saeideh Farahani has a PhD in Civil Engineering from Amirkabir University of Technology, Iran; she is currently a postdoctoral fellow. Her research interests include Earthquake Engineering and Resilient Infrastructure.
Ali Shojaeian
Ali Shojaeian is a PhD student in Civil Engineering at the University of Oklahoma, USA. His research interests include Geotechnical Earthquake Engineering, Risk Assessment, and Reliability-based Design.
Behrouz Behnam
Behrouz Behnam is Associate Professor in the Department of Civil and Environmental Engineering at Amirkabir University of Technology, Iran. His research interests include Disaster Management, Fire Engineering and Risk-based Design.
Milad Roohi
Milad Roohi is Assistant Professor in the Durham School of Architectural Engineering and Construction, the University of Nebraska–Lincoln, Omaha, USA. His research interests include Infrastructure Resilience, Structural Health Monitoring and Structural Dynamics Catastrophe Modeling.
References
- R-CRISIS [Accessed: 2022-09-18]. (2018).
- Ahamri, N., Mahdavinejad, M., & M, F. (2016). Interaction of natural landscape and modern heritage in case of Veresk, Iran. eQscientific Herald of the Voronezh State University of Architecture & Civil Engineering, 32(4), 70–91.
- Akkar, S., & Bommer, J. (2010). Empirical equations for the prediction of PGA, PGV, and spectral accelerations in Europe, the Mediterranean region, and the Middle East. Seismological Research Letters, 81(2), 195–206. https://doi.org/10.1785/gssrl.81.2.195
- Akyol, N., & Karagöz, Ö. (2009). Empirical attenuation relationships for western Anatolia, Turkey. Turkish Journal of Earth Sciences, 18(3), 351–382.
- Ambraseys, N., Douglas, J., Sarma, S., & Smit, P. (2005). Equations for the estimation of strong ground motions from shallow crustal earthquakes using data from Europe and the Middle East: Horizontal peak ground acceleration and spectral acceleration. Bulletin of Earthquake Engineering, 3(1), 1–53. https://doi.org/10.1007/s10518-005-0183-0
- Amiri, G. G., Khorasani, M., Hessabi, R. M., & Amrei, S. R. (2009). Ground-motion prediction equations of spectral ordinates and arias intensity for Iran. Journal of Earthquake Engineering, 14(1), 1–29. https://doi.org/10.1080/13632460902988984
- Campbell, K. W., & Bozorgnia, Y. (2010). A ground motion prediction equation for the horizontal component of cumulative absolute velocity (CAV) based on the PEER-NGA strong motion database. Earthquake Spectra, 26(3), 635–650. https://doi.org/10.1193/1.3457158
- Chousianitis, K., Del Gaudio, V., Pierri, P., & Tselentis, G.-A. (2018). Regional ground- motion prediction equations for amplitude-, frequency response-, and duration-based parameters for Greece. Earthquake Engineering & Structural Dynamics, 47(11), 2252–2274. https://doi.org/10.1002/eqe.3067
- Chousianitis, K., Del Gaudio, V., Sabatakakis, N., Kavoura, K., Drakatos, G., Bathrellos, G. D., & Skilodimou, H. D. (2016). Assessment of earthquake-induced landslide hazard in Greece: From arias intensity to spatial distribution of slope resistance demand. Bulletin of the Seismological Society of America, 106(1), 174–188. https://doi.org/10.1785/0120150172
- Decò, A., Bocchini, P., & Frangopol, D. M. (2013). A probabilistic approach for the prediction of seismic resilience of bridges. Earthquake Engineering & Structural Dynamics, 42(10), 1469–1487. https://doi.org/10.1002/eqe.2282
- Del Gaudio, V., Pierri, P., & Wasowski, J. (2003). An approach to time-probabilistic evaluation of seismically induced landslide hazard. Bulletin of the Seismological Society of America, 93(2), 557–569. https://doi.org/10.1785/0120020016
- Dolce, M., Prota, A., Borzi, B., da Porto, F., Lagomarsino, S., Magenes, G., Moroni, C., Penna, A., Polese, M., & Speranza, E., et al. (2021). Seismic risk assessment of residential buildings in Italy. Bulletin of Earthquake Engineering, 19(8), 2999–3032. https://doi.org/10.1007/s10518-020-01009-5
- Du, W., & Wang, G. (2016). A one-step Newmark displacement model for probabilistic seismic slope displacement hazard analysis. Engineering Geology, 205, 12–23. https://doi.org/10.1016/j.enggeo.2016.02.011
- Estêvão, J. M. (2019). An integrated computational approach for seismic risk assessment of individual buildings. Applied Sciences, 9(23), 5088. https://doi.org/10.3390/app9235088
- Farahani, S., Behnam, B., & Tahershamsi, A. (2020a). Macrozonation of seismic transient and permanent ground deformation of Iran. Natural Hazards and Earth System Sciences, 20(11), 2889–2903. https://doi.org/10.5194/nhess-20-2889-2020
- Farahani, S., Behnam, B., & Tahershamsi, A. (2020b). Probabilistic seismic multi-hazard loss estimation of Iran gas trunklines. Journal of Loss Prevention in the Process Industries, 66, 104176. https://doi.org/10.1016/j.jlp.2020.104176
- Farahani, S., Tahershamsi, A., & Behnam, B. (2020). Earthquake and post-earthquake vulnerability assessment of urban gas pipelines network. Natural Hazards, 101(2), 327–347. https://doi.org/10.1007/s11069-020-03874-4
- Faturechi, R., & Miller-Hooks, E. (2015). Measuring the performance of transportation infrastructure systems in disasters: A comprehensive review. Journal of Infrastructure Systems, 21(1), 04014025. https://doi.org/10.1061/(ASCE)IS.1943-555X.0000212
- FEMA. (2012). Multi-hazard loss estimation methodology: Earthquake model. Department of Homeland Security, FEMA, Washington, DC, 235–260.
- Foulser-Piggott, R., & Goda, K. (2015). Ground-motion prediction models for arias intensity and cumulative absolute velocity for Japanese earthquakes considering single-station sigma and within-event spatial correlation. Bulletin of the Seismological Society of America, 105(4), 1903–1918. https://doi.org/10.1785/0120140316
- Geological Survey of Iran[ Accessed: 2022-09-18]. (2001).
- Ghasemi, H., Zare, M., Fukushima, Y., & Koketsu, K. (2009). An empirical spectral ground- motion model for Iran. Journal of Seismology, 13(4), 499–515. https://doi.org/10.1007/s10950-008-9143-x
- Guha-Sapir, D., Vos, F., Below, R., & Ponserre, S. (2012). Annual disaster statistical review 2011: The numbers and trends.
- Kameda, H. (2000). Engineering management of lifeline systems under earthquake risk. Bulletin of the New Zealand Society for Earthquake Engineering, 33(3), 248–264. https://doi.org/10.5459/bnzsee.33.3.248-264
- Karimiparidari, S. (2014). Seismic hazard analysis in Iran (475 years return period). International Institute of Earthquake Engineering and Seismology (IIEES).
- Koike, T., Takada, S., Ogawa, Y., Matsumoto, M., Tajima, T., & Hassani, N. (2004). Seismic damage predictions for the gas distribution systems in great Tehran, Iran. 13th World Conference on Earthquake Engineering, Vancouver, BC, Canada, paper, (3394).
- Komakpanah, A., & Farajzadeh, M. (1996). Liquefaction susceptibility and opportunity macrozonation of Iran. Proceedings of the Fifth International Conference on Seismic Zonation. Nice, France, October 17-19, 1651–1658.
- Kothalkar, S., & Kadam, S. (2016). Seismic vulnerability assessment of an existing railway bridge. Journal of Civil and Environmental Engineering, 3, 553–557.
- Lai, T., Nasseri, A., Yin, Y., Katiyar, V., & Turel, M. (2014). Modeling Railway Damage due to Shake, Liquefaction, and Tsunami for the 2011 Tohoku Earthquake. International Efforts in Lifeline Earthquake Engineering, 267–274.
- Liu, Y., Wotherspoon, L., Nair, N. -K.C., & Blake, D. (2021). Quantifying the seismic risk for electric power distribution systems. Structure and Infrastructure Engineering, 17(2), 217–232. https://doi.org/10.1080/15732479.2020.1734030
- Makdisi, F., Seed, H., & Norouzi, A. (1978). Attenuation relations for peak horizontal and vertical accelerations of earthquake ground motion in Iran: A preliminary analysis. The Railways of Islamic Republic of Iran, 104(2), 109–128.
- Norouzi, A. (2005). Attenuation relations for peak horizontal and vertical accelerations of earthquake ground motion in Iran: A preliminary analysis.
- Poulos, A., Espinoza, S., De la Llera, J., & Rudnick, H. (2017). Seismic risk assessment of spatially distributed electric power systems. 16th World Conf on Earthquake Eng Santiago, 1949–3029.
- The Railways of Islamic Republic of Iran [ Accessed: 2022-09-18]. (2005).
- Rathje, E. M., & Saygili, G. (2011). Estimating fully probabilistic seismic sliding displacements of slopes from a pseudoprobabilistic approach. Journal of Geotechnical and Geoenvironmental Engineering, 137(3), 208–217. https://doi.org/10.1061/(ASCE)GT.1943-5606.0000431
- Rathje, E. M., & Saygili, G. (2011). Estimating fully probabilistic seismic sliding displacements of slopes from a pseudoprobabilistic approach. Journal of Geotechnical and Geoenvironmental Engineering, 137(3), 208–217. https://doi.org/10.1061/(ASCE)GT.1943-5606.0000431
- Reiter, L. (1991). Earthquake hazard analysis: Issues and insights. Columbia University Press.
- Roohi, M., & Hernandez, E. M. (2020). Performance-based post-earthquake decision making for instrumented buildings. Journal of Civil Structural Health Monitoring, 10(5), 775–792. https://doi.org/10.1007/s13349-020-00416-1
- Roohi, M., Li, J., & van de Lindt, J. (2022). Seismic functionality analysis of interdependent buildings and lifeline systems. 12th National Conference in Earthquake Engineering, Earthquake Engineering Research Institute, Salt Lake City, UT.
- Roohi, M., van de Lindt, J. W., Rosenheim, N., Hu, Y., & Cutler, H. (2020). Implication of building inventory accuracy on physical and socio-economic resilience metrics for informed decision-making in natural hazards. Structure and Infrastructure Engineering, 17(4), 534–554.
- Sadigh, K., Egan, J., & Youngs, R. (1986). Specification of ground motion for seismic design of long period structures,earthquake notes 57(1), 13.
- Saygili, G., & Rathje, E. M. (2009). Probabilistically based seismic landslide hazard maps: An application in Southern California. Engineering Geology, 109(3–4), 183–194.
- Shinozuka, M., Shiraki, N., Kameda, H., Shinozuka, M., Murachi, Y., Dong, X., Y, Z., M, O., B, T., & S, P. (2000). A new approach to estimate a mixed model-based ground motion prediction equation, earthquake spectra. Effect of seismic retrofit of bridges on transportation networks. Earthquake Engineering and Engineering Vibration, 2, 665–684.
- Shojaeian, A., Farahani, S., Behnam, B., & Mashayekhi, M. (2021). Seismic resilience assessment of Tehran’s southern water transmission pipeline using GIS-based analyses. Journal of Numerical Methods in Civil Engineering, 6(2), 93–106.
- Tavakoli, B., & Pezeshk, S. (2007). A new approach to estimate a mixed model–based ground motion prediction equation. Earthquake Spectra, 23(3), 665–684.
- Tsuchiya, S., Tatano, H., & Okada, N. (2007). Economic loss assessment due to railroad and highway disruptions. Economic Systems Research, 19(2), 147–162.
- Zhu, W., Liu, K., Wang, M., & Koks, E. E. (2020). Seismic risk assessment of the railway network of China’s mainland. International Journal of Disaster Risk Science, 11(4), 452–465.
Appendix I.
GIS-based Multi-hazard Seismic Assessment of Railway Networks
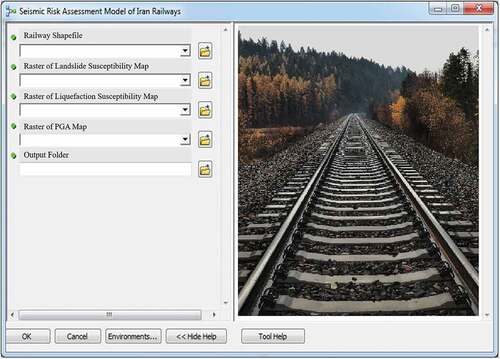
ArcGIS API for Python can be used to develop a GIS-based interface to perform seismic multi-hazard risk assessment of railway networks. This appendix presents an example user interface developed by authors for implementation of the method of approach presented in this paper. Similar user interfaces can be developed for various segments or the full railway networks around the globe, which would make the presented method of approach useful and usable for communities in seismic-prone regions. shows the designed graphical user interface developed for the IRN. This interface can reduce the amount of effort a user has to expend to provide input for developing the probabilistic model, running the analysis and visualizing the outputs. As can be seen in , the inputs to this interface consist of the railway and bridge inventory shapefiles and seismic hazard raster files. shows the user interface developed to perform seismic risk assessment of the IRN bridges. The visualized outputs of the analysis will be consistent with the results presented in this paper.
Figure A17. User interface of the seismic risk assessment model of Iran railway tracks.
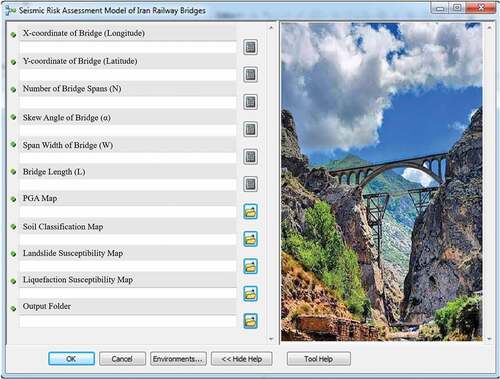
Figure A18. User interface of the seismic risk assessment model of Iran railway bridges.