
 ?Mathematical formulae have been encoded as MathML and are displayed in this HTML version using MathJax in order to improve their display. Uncheck the box to turn MathJax off. This feature requires Javascript. Click on a formula to zoom.
ABSTRACT
Infrastructure asset management is concerned with the efficient and sustainable utilization of resources. There are numerous sources of uncertainties associated with the physical state of the infrastructure, climate change, and the economy. Thus, the most appropriate decision-making process to select maintenance and replacement strategies that are sustainable, economical, and safe should also be well informed in terms of risks. The decision process is formulated as a multi-objective optimization problem and exemplified the case for targeted performance levels and total costs, and solved using both Multi-Objective Particle Swarm Optimization (MOPSO) and a Non-dominated Sorting Genetic Algorithm II (NSGA-II). The results indicate that annual budget constraints have a significant effect on the Pareto front and the schedule associated with individual solutions. The proposed approach provides a useful and flexible decision-analysis tool for managers by allowing for multiple objective optimization in scheduling future interventions towards the sustainability of infrastructure.
1. Introduction
Infrastructure assets, such as bridges, roads, pipelines, etc., provide essential services to society as well as a support for economic activities. Infrastructure asset management is an important area of research to promote an efficient use of these resources and their long-term sustainability. This objective is getting more challenging since an increasingly large proportion of infrastructure assets are in need of repair and replacement (Chen & Bai, Citation2019). The sheer magnitude of this task requires state-of-the-art procedures to schedule appropriate activities both in time and in space. In this article, procedures are proposed to optimize repair and replacement strategies for reinforced concrete bridges in northern climates where the main contributor to deterioration is the application of de-icing salts and the ingress of chloride ions into the concrete (Bastidas-Arteaga et al., Citation2011; Breysse et al., Citation2014). For long-term planning, consideration should also be given to potential climate change effects that may affect the deterioration rate. Such effects include increasing average air temperature, winter precipitation frequency and amount, number of freeze-thaw cycles, and relative humidity levels (Palko & Stanley Lemmen, Citation2017; Yan et al., Citation2021). Transportation systems should be durable, adaptable, and flexible to face future climatic conditions (Salimi & Al-Ghamdi, Citation2020). In planning and optimizing activities, consideration should be given to economic factors as well to societal impacts such as safety level, noise, environmental impacts, and traffic delays (Menon et al., Citation2009). Maintenance scheduling and budgeting can affect users and the economy for periods of time that extend beyond the lifecycle of individual infrastructure components. Khayamim et al. (Citation2020) indicate that good transportation planning promotes the sustainability of the economy, society, and the environment and rely on multi-objective optimization procedures to prioritize network-level activities in time and space. Therefore, an optimized infrastructure management strategy is essential for sustainability and efficiency purposes (Santos et al., Citation2017).
1.1. Optimization procedures for decision-making in infrastructure asset management
Decision-making is an essential part of infrastructure asset management. This involves selecting intervention strategies for multiple projects by specifying maintenance/repair/replacement tasks and timing of activities that minimize costs and increase infrastructure performance. It is not an easy task since a number of constraints must be considered, such as limited resources and multiple goals, in a context of uncertainty. With the recent development of machine learning algorithms, more reliable optimization techniques can be efficiently applied for such problems (ManWo et al., Citation2011).
Generally, optimization techniques can be classified as Single-Objective Optimization (SOO) and Multi-Objective Optimization (MOO) techniques (Hillier, Citation2012). SOO targets the minimization (maximization) of one objective with multiple constraints, whereas MOO uses trade-offs between multiple objectives to find optimal solutions. Another stream of research focuses on strictly prioritizing the objectives, as in it the case in lexicographic optimization (Respen et al. Citation2016; Thevenin et al. Citation2018). SOO can also present a range of solutions by altering the constraints; however, a large amount of computation time is required for each solution. MOO techniques usually do not provide unique solutions, but provide instead a set of multiple Pareto solutions (non-dominated solutions) or Pareto front satisfying all constraints (Horn et al., Citation1994). Policy-makers can select solutions along the Pareto front according to their objectives or priorities (Chen & Bai, Citation2019).
In many instances, multiple objective functions may be incompatible; the decision-making process generally involves two or more stakeholders with different preferences that can be characterized by sharply conflicting interests. Improved decision-making should satisfy the goals of stakeholders. These goals may involve economic, social, environmental, and cultural aspects, and their inter-relationship, which increases the difficulty of solving the MOO problem. For instance, a large expense for maintenance and repair reduces the deficiencies of the structure, thereby improving the service level. Thus, the two objective functions of (maximizing) service and (reducing) cost for interventions are two objective functions that are contradictory to each other. Assigning weights to different objectives in terms of their priorities enables the creation of a single composite objective function. This approach is usually called scalar optimization and is one of the most effective methods to minimize contradictory objectives (Bhatti, Citation2012). Recently,Shim and Hyun Lee (Citation2017) proposed a framework for a multi-objective problem of bridge deck interventions using transportation data obtained from the Wyoming Department of Transportation. Their model has two objective functions: (1) minimization of the structurally deficient deck area and (2), minimization of the budget of maintenances and repairs. However, it has limited application since the definition of weights is arbitrary and specific to their case.Santos et al. (Citation2018) developed a tri-objective optimization framework for pavements that includes a comprehensive assessment of life-cycle costs from the production and transportation of materials, construction, and maintenance, traffic management of the work-zone during construction and maintenance and usage up to end-of-life. The objective functions are: (1) minimization of the present value of the total life-cycle road costs; (2) maximization of the pavement performance during the project analysis period; and (3) minimization of the life cycle environmental liabilities arising from all pavement life cycle stages.
1.2. Optimization procedures classified by solution approach
Optimization methods can also be classified in terms of the algorithm type used to solve the problem. Solution methods can be categorized as heuristic, deterministic, and other.Silver et al. (Citation1980) describe heuristics as an intuitive approach in which intelligent interpretation of the objectives to obtain a reasonable solution is the optimization solution. On the other hand,Moteleb (Citation2010) describes deterministic methods as those where optimal solutions are obtained based on corollaries and mathematical theorems. Other than these two basic methods, hybrid methods have also been proposed.Zheng et al. (Citation2008) propose a hybrid model for the optimization of pavement preservation strategies on the basis of an analytic hierarchy process for priority setting under multiple principles, and goal programming for achieving multiple objectives. The model aims to maximize the service life of the pavement while minimizing the total preservation cost.Bai et al. (Citation2021) present a methodology that combines chance-constraint programming, the Lindeberg Central Limit Theorem, and a hybrid NSGA II method to address the performance uncertainties associated with the Transportation Asset Management multi-objective optimization problem. A case study involving real-life assets is used to demonstrate the proposed methodology and the results show that, for a given network performance level, a higher investment is required to achieve a high confidence level compared to a low confidence level.
Note that other types of solution-method classification also exist in the literature (e.g., (Bierlaire et al., Citation2010) for nonlinear global optimization, (Blum & Roli, Citation2003) for combinatorial optimization. In addition, some solution approaches are sometimes combined with filtering techniques for reducing the solution space without losing any optimality (Hertz et al., Citation2005).
Priority-based methods are some of the most common deterministic methods which specify the management outcomes by defining the decision criteria of management. Rules are defined according to perceived or stated priorities either before or during the optimization process (Lin et al., Citation2012). Numerical solution techniques are common in solving deterministic objectives. Examples of these techniques are dual, dynamic, linear, branch, and bound programming. Such methods usually follow strict standards and algorithms, which lead to a limited scope of application. These methods are commonly used in large-sized decision-making problems with simple outcome relationships (Chen & Bai, Citation2019).
One of the most popular choices for MOO is genetic algorithms (GA). Here, possible outcomes, such as sequences of management interventions and strategies, are modeled as genes undergoing crossover and mutation in order to create the solutions (Schmitt, Citation2001). GA methods are easy to control and flexible for solving complex decision-making problems (Belevičius et al., Citation2013). GA as a global search and optimization approach has a broad range of applications and provides accurate solutions and high efficiency.Li and Fan (Citation2021) examine the effects of long-term work zone events on the network’s mobility performance using a bi-level GA algorithm-based optimization model. The proposed model and algorithm are capable of providing near-optimal solutions for the long-term work zone scheduling problem with elastic demand at a network level throughout the planning horizon, according to numerical results. GA also has been widely applied in bridge rehabilitation and pavement management systems (Santos et al., Citation2017).Farran and Zayed (Citation2012) use GA along with Markov Chains to determine the profile of optimal rehabilitation sequences of the metro system of Montreal in Canada. Pavement maintenance strategies for road networks in Indonesia have been investigated through a GA structure to optimize the road services while minimizing costs (Hadiwardoyo et al., Citation2017).
Particle Swarm Optimization (PSO) is a powerful stochastic optimization technique developed by Eberhart and Kennedy (Citation1995). PSO mimics numerically the social behavior of animals, like fish in schools and birds in flocks. The initial population of solutions consists of random individuals or particles ‘flying’ in the search space to search for the optimal solution. Each particle is characterized by its location and velocity. The number of parameters to specify for the optimization is small and their effect on the optimal solutions is not very significant in comparison with other techniques of optimization (Poli et al., Citation2007). PSO has been used to optimize building maintenance strategies based on cost (Al-Smadi, Citation2019), for forest road vertical alignment optimization (Babapour et al., Citation2018), and to assess the cost-effectiveness of trade-offs in flexible pavement maintenance strategies (Chou & Thanh-Son, Citation2011).
Multi-Objective PSO (MOPSO) is a growing field to solve MOO problems, with applications in electrical engineering, industrial engineering, and civil engineering (Lalwani et al., Citation2013). MOPSO techniques have been used byChou and Thanh-Son (Citation2011) to assess the cost-effectiveness of trade-offs in a flexible strategy of pavement maintenance.Al-Smadi (Citation2019) applies the MOPSO algorithm to find the optimal treatment action among eight maintenance actions for the EV building of Concordia University (in Canada).Elbaset et al. (Citation2020) have used MOPSO techniques to investigate grid-connected hybrid PV/Wind system taking reliability, cost, and environmental aspects into consideration.
Recently, the prediction of service life for infrastructure has been performed by using probabilistic concepts and approaches for single objective optimization. This is due to the inherent random and uncertain nature of deterioration processes from initiation to propagation. A generalized probabilistic framework was proposed in (Kim et al., Citation2013) for planning optimal inspection and maintenance activities for deteriorating structures. More recently,Y. Zhang et al. (Citation2020) presented a novel framework that optimizes the date for the first major replacement of a concrete deck with a model that considers time-dependent deterioration processes as well as financial uncertainties.
1.3. Common decision-making maintenance, repair, and replacement strategies
Maintenance, repair, and replacement strategies can be formulated as an optimization problem under constraints.Sarma and Adeli (Citation1998) andFrangopol (Citation2011) review research on the cost optimization of concrete structures and argue that life-cycle cost optimization should replace initial cost optimization.W. Zhang and Wang (Citation2017) developed a decision model for determining a prioritized maintenance schedule for a deteriorated bridge network. It uses network analysis methods and metaheuristics to integrate the rating of bridge capacity and condition, traffic impacts as well as the location parameters into one global objective function that defines the whole maintenance cost and network reliability. Maintenance actions must be effectively planned throughout the life cycle of infrastructures to optimize budget allocation under the constraints of functionality and safety (Frangopol & Soliman, Citation2016).Hernández-Chover et al. (Citation2019) have shown that costs and environmental impacts due to deteriorating waste water treatment plants can be greatly reduced by timely interventions and preventive maintenance.
Several methodologies have been proposed to model the deterioration of infrastructure and to assess underlying risks. Among them, Markov chain models have been widely used to predict the evolution of the state of a large group of deteriorating structures and to select optimum M&R (Maintenance and Rehabilitation) strategies (Thomas & Sobanjo, Citation2016). The parameters (transition probabilities) for these models are derived primarily from statistics estimated from databases of past inspection and condition assessment reports. Transition probabilities have also been derived from physical simulation models that have been correlated to defined performance levels (Y. Zhang et al., Citation2018). However, it is a difficult task to predict the remaining service life of a structure due to uncertainties on initial conditions, time to initiation of corrosion and propagation of deterioration (Frangopol, Citation2011). Xie and Tian (Citation2018) propose a risk-based re-assessment optimization of pipeline assets considering multiple corrosion defects in their life cycles, where the failure probability threshold is considered as the decision variable. Visual inspections remain the primary source of information for evaluating and monitoring the condition of typical bridge structures. An accurate prediction model can be used in conjunction with visual inspections to improve the assessment of the infrastructure present and future state.
1.4. Motivation
Bridge M&R activities impact the physical condition of bridge assets, which in turn impact public safety, travel costs, travel times, car emissions, and economic activities. The main objective of this paper is therefore to develop a general and comprehensive framework to determine optimal M&R interventions that maximize benefits and minimize probabilities of disruptions during a given period of analysis for a single structure. The expected cost of M&R strategies for the bridge should take into account economic considerations, timing of implementation, as well as serviceability, and sustainability. M&R activities should be planned and scheduled in order to minimize disruptions of operations in the transportation network. The corresponding set of Pareto solutions can be used by the decision-maker to better understand the relationships between the multiple objectives and trade-offs involved for efficient solutions.
This study attempts to develop a system of decision support that is able to provide numerous alternative plans of maintenance through the application of MOO. The optimization procedures are then demonstrated for typical bridges located in Montreal, Canada. The results are demonstrated for a sequence of M&R strategies for the concrete deck. Historic climate data is used to evaluate the current condition of existing bridges, while climate change scenarios are used to predict the residual life of both existing bridges and newly constructed bridges.
The remainder of this paper is organized as follows: The following section reviews the literature on chloride-induced corrosion in concrete and the TransChlor® Model. Section 3 describes a test case of bridge for Montreal, Canada. Section 4 introduces the proposed deterioration model for assessing the bridge performance and the MOO problem. An application of the proposed optimization process for bridge deck maintenance planning is then presented in Section 5. In section 6, conclusions are drawn and the future directions are pointed out.
2. Methods
2.1. TransChlor® model
Corrosion is the key mode of deterioration of Reinforced Concrete (RC) structures in Northern climates, and this is related to the use of de-icing salts. Deterioration is affected by geometrical properties (thickness of concrete cover, cross-sectional dimensions), material characteristics (diffusion coefficients), climate (humidity, temperature, and winter precipitation), and exposure conditions (splash, mist, or direct) (Yan et al., Citation2021). Fick’s second diffusion law has often been used to derive profiles of chloride ions concentration in concrete (Hunkeler, Citation2005). The critical chloride content (Ccrit) is a material property and is defined as the level above which the corrosion of the reinforcement is initiated. Ccrit is highly variable and is affected by the binder type, w/c ratio, and steel surface condition (Angst, Citation2011).
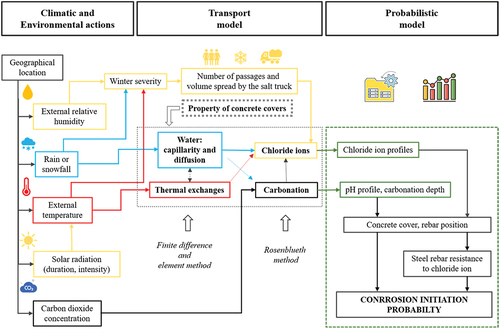
In this application, the TransChlor® software is used to simulate the transport of chloride ions in the concrete. The framework and the main steps of the TransChlor® are illustrated in . Historical hourly climate data (or climate change scenarios) are used to simulate the exposure of the structures to de-icing salts in the winter. The transport model uses the finite element method and a finite difference method to simulate the evolution of chloride ions profile, respectively, in space and time. The program also incorporates probabilistic analyses to estimate the distribution of the chloride ions content as a function of time and depth to account for uncertainties on concrete and steel properties. A more detailed description of the model is provided inConciatori et al. (Citation2018).
Figure 1. Flowchart of computations in TransChlor®.
2.2. Deterioration model
Y. Zhang et al. (Citation2020) use a probabilistic deterioration model for concrete decks derived from chloride ion transport models and climate change scenarios. In this research, the deterioration model is defined using a similar methodology for durability limit states in line with CSA S408–11 (2011). The time to the final stage of the design service life (Tt) is divided into two stages: (1) corrosion initiation (Ti) and, (2) corrosion propagation (Tp, time to initiation of spalling), thus, Tt = Ti + Tp.
The determination of the probability of serviceability limit states that are time-dependent is complex due to the nonlinearity of the performance functions. The time to the onset of spalling is defined as,
and its cumulative distribution function is obtained fromEquationEquation (4)(4)
(4) ,
where,and
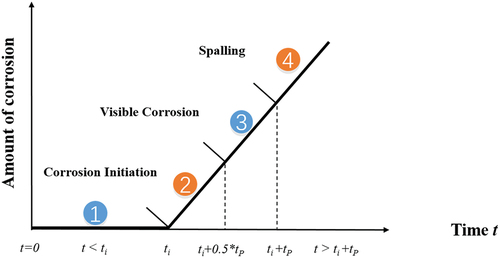
are the probability density functions for the time to the initiation of corrosion and the time of corrosion propagation up to the onset of spalling of the concrete cover, respectively. Since the time from corrosion initiation to spalling is usually long, and the crack growth models are mainly linear functions in time, the deterioration is divided into four stages. Stage 1 is the initial period, from the beginning of the service life to the initiation of corrosion. Stage 2 is defined from the beginning of the corrosion initiation until the crack widths reach 0.8 mm. Stage 3 is the final phase of the propagation of corrosion, from the previous stage to the onset of concrete cover spalling, which corresponds to Stage 4 (). The four states defined herein can be related to current visual inspection and condition assessment procedures and is applicable to a wide range of structures.
Figure 2. Definition of durability condition states.
Estimates of the concentration of chloride as a function of depth and time in the concrete deck are obtained with TransChlor® as described previously. The time to the corrosion initiation (ti) is defined as the time duration needed for chloride ion levels to reach the critical level for corrosion for the corresponding type of reinforcing steel. The time duration between the initiation of corrosion to the onset of spalling (tp) is estimated using the expression proposed in (Lounis & Daigle, Citation2008),
where S = rebar spacing, ρr = density of corrosion products (assumed at 3,00 kg/m3 for Fe(OH)3); ρs = density of steel (7,60 kg/m3), α = molecular weight ratio of metal iron to the corrosion product (assumed at 0.52), and jr = corrosion production rate per unit area (µA/) (Bazant, Citation1979). The model is utilized to relate the increase in rebar diameter due to corrosion build-up to corrosion-induced limit states (Lounis & McAllister, Citation2016). The random variable that are used in the model are summarized in .
Table 1. Variables of the propagation model.
The elements of the yearly transition probabilities matrix (TPM ()) are by definition null except for the elements on and above the diagonal. Given the initial state probabilities vector
, the future probability state vector
(t = 1, 2, … , T) after t years is (Collins Citation1972):
where,
In this application, is defined as [1, 0, 0, 0], which states that the structure is new at time zero. In this application, TPMs were estimated for three climate scenarios and three concrete covers. The transition probabilities are obtained by minimizing the sum of absolute differences between q(t) and Q(t), where Q(t) is the vector of state probabilities at time t [P1(t) P2(t) P3(t) P4(t)] (t = 1, 2, … , T) predicted from the deterioration model.
The use of the absolute differences prompts a faster optimization routine and does not induce significant losses in the final solution relative to that obtained from the quadratic loss function (Portnoy & Koenker, Citation1997). The Optimization was carried out in MATLAB® environment and using the FMINCON function (Byrd et al., Citation2000).
2.3. Optimization methodologies
The process of optimization for bridge maintenance and repairs requires the inclusion of a deterioration model. The computational effectiveness of the proposed technique for optimizing the sequence and timing of maintenance and repairs activities is implemented by MOPSO (Multi-Objective Particle Swarm Optimization). A Multi-Objective Genetic Algorithm (MOGA) was also used for bi-objective optimization for the purposes of validation and comparison. The proposed technique provides schedules of bridge maintenance that account for two potentially conflicting objectives: minimization the cost of M&R interventions and minimization of disruptions to users.
PSO has been used as an effective algorithm of optimization in a wide range of applications (Parsopoulos & Vrahatis, Citation2002). PSO is a technique based on the evolution of an initial population of solutions, and in some respects is similar to Evolutionary Algorithms (EA), apart from the fact that, as opposed to evolving, each possible solution (particle) is characterized by its location and velocity in the search space.
This technique is initialized with a set of randomly generated particles and the optimum is sought based on the update of the particle position at each iteration. Two values are used to update the position of each particle: the Global Best (gbest) and the Personal Best (pbest) solutions. pbest corresponds to the best value reached at a given iteration by a given particle, while gbest is the best solution achieved by the swarm at the current iteration, which leads other particles to its location. The particles flight in the solution is defined as follows:
where is the velocity of the particle T with S dimension, i is the iteration, w is the inertia weight of particle movement (which is used to regulate the impact of the prior velocity on the current velocity). Large values of w maintain previous particle velocities and increase the velocity, which minimizes the possibility of confinement to a local optimum. Conversely, small values of w reduce the velocity of particles and promote a local search in the solution space. c1 is the cognitive acceleration coefficient, whereas c2 is the social acceleration coefficient. Both
1 and
2 are independent uniformly distributed random variables between 0 and 1. pbes
(i) is the best solution achieved by the Tth particle at the ith iteration. gbest is the best solution achieved by the swarm at the ith iteration.
(i) is the current position of the Tth particle in iteration i.
(i + 1) is the velocity of the Tth particle at iteration i + 1 (Lalwani et al., Citation2013). The equations, parameters, velocity, and position updates of the MOPSO are similar to those of PSO, except for the objective functions. The steps of MOPSO can be summarised as follows: (1) Randomly define the location of each particle in the solution space between the specified minimum and maximum values; (2) Randomly define the initial velocity of each particle within the specified minimum and maximum values; (3) Update the velocity of each particle usingEquationEquation (1)
(1)
(1) ; (4) Update the best solution (pbest) for each particle; (5) Add all non-dominated solutions into the current archive; (6) Delete the dominated archived solution; (7) Update the overall best solution (gbest), which is chosen from the archived member that dominates the fewest feasible solutions in the current iteration.
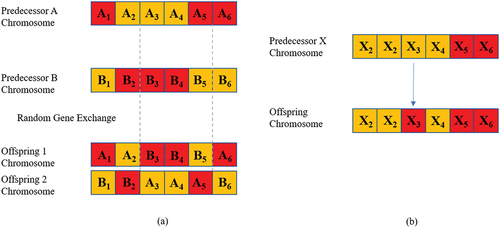
Genetic Algorithms (GA) are classified as stochastic search tools and emulate natural selection mechanisms, which are usually simple but robust and powerful processes (Goldberg & Holland, Citation1988). They start with a random initial population of solutions that are defined as ‘chromosomes’, where each chromosome is comprised of a sequence of units that form ‘genes’ that encrypt specific components of a solution. In the optimization or search process, chromosomes advance over consecutive iterations or ‘generations’, unless the problem congregates with chromosomes that reflect the approximate or optimal solution to the problem (Gen & Cheng, Citation2000). The reproduction operations are primarily crossovers and mutations. Crossover combines genes from the chromosomes of two predecessors and produces an offspring from each pair of parents (), while mutations generate offspring by introducing a variation in the individual chromosome of a predecessor ().
Figure 3. Reproduction operation: (a) crossover and (b) mutation operations.
In this study, NSGA-II, one of the most effective methods in MOGA’s family (Kalyanmoy et al., Citation2002), was used. The differences between simple GA and NSGA-II lie in GA’s process of ‘selection’. For each generation in NSGA-II, the parent and offspring populations are combined to create a new population. The evaluation of dominance ranking is subsequently conducted for the combined population set. In the evaluation of dominance ranking, the number of alternative solutions that are dominant over that solution is determined for each solution of the new population. The solutions are then ranked in accordance with the amount of solutions that are dominant over them.
2.4. Problem formulation
In this application, four basic types of M&R activities are considered: (A) ‘Do-Nothing’; (B) ‘Minor Maintenance’; (C) ‘Major Maintenance’; (D) ‘Replacement’. They are used to define sequences of activities during the lifetime of the structure. ‘Minor Maintenance’ includes cleaning and the sealing of joints and repair of cracks and superficial local repairs on the slab (above the reinforcement). ‘Major Maintenance’ primarily comprises localized repair of the concrete to a depth below the reinforcement as well as the sealing of joints and the use of epoxy injection to fill racks. Often, quick setting concrete will be used for both minor and major repairs to minimize the length of disruptions in the transportation network. The ‘Replacement’ entails the construction of a new slab including new reinforcement.
M&R activities are assumed to be performed at the start of each fiscal year and transition states are observed at the end of the fiscal year. In this study, only discrete states are considered since the inspection and maintenance activities are assumed to be performed on an annual basis. The yearly TPMs for the four actions are proposed in . For the ‘Do-nothing’ option,EquationEquation (13)(13)
(13) is used to calculate the TPMs (), which is utilized to describe the stochastic process of deterioration. For minor repairs, the TPM is defined such that given a bridge is initially in state 3, it will be in state 2 after the minor repair. Minor repairs are not performed if the bridge deck is in state 4. In this instance, the state of deterioration is considered too severe for minor repairs. For major maintenance actions, the TPM is defined such that a bridge deck in either state 3 or 4 will be in state 2 after repair, which implies that the reinforcing steel has not been replaced after a major repair. For deck replacements, the state after replacement is assumed to be 1 (new state) regardless of the current state.
Table 2. Yearly Transition Probability Matrices (at the time of actions).
Table 3. Quality Classes of Cover Concrete for non-saturated concrete (Proceq, Citation2005).
Table 4. Cost matrix of M&R strategies ($/m2).
Table 5. Yearly Transition Probability Matrices for three climate scenarios (Historical, RCP4.5 and RCP8.5) and concrete cover thickness (5 mm, 0 mm, and 0 mm).
The current condition state at any time is random and is represented by a vector where the elements are the probabilities for each state. The expected current state of the deck at time t is:
In the optimization process, each possible solution is comprised of a sequence of yearly M&R tasks (A, B, C or D) over a time horizon of T years.
2.5. Objective functions
The multi-objective optimization is to identify M&R strategies that minimize Net Present Value of Cost (NPVC) and minimize probabilities of disruptions during the lifetime of the bridge. Thus, the first objective is defined as:
where is the time period of analysis,
is the discount rate at time t (i.e., yields on Government bonds), Sz is the area of the deck, and UC is the unit costs for the different M&R strategies. Moreover, to capture rising costs over time, we use
as the Producer Price Index level at time t, where πm is the inflation rate for the cost of materials. Unit costs for M&R actions are listed in for the baseline model and a deck area of 1,00 m2.
is the residual value of the infrastructure asset and is calculated as:
where is the residual state of the bridge at year 50 and
is the cost for reconstruction of the new deck. The argument is that if a given strategy leaves the infrastructure in better shape than a different strategy after 0 years of service life, the first one is better (other things equal) as it will have lower costs in future periods.
For an RC bridge deck, the end of life is determined as the date when the critical level of deck spalling and delamination is reached (Lounis et al., Citation2006). Therefore, the second objective function is defined to minimize the probability of spalling (failure) during the service life:
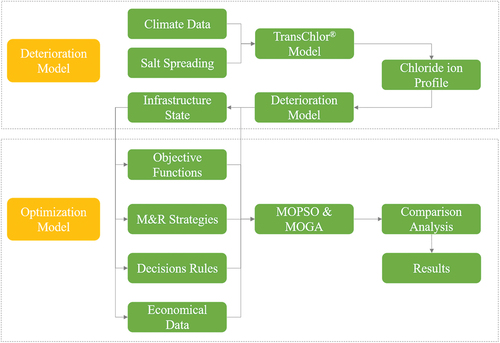
An overview of the proposed framework is shown in .
Figure 4. An overview of the proposed framework.
3. Application of the model and discussion of the results
3.1. Data
The data about infrastructure systems for the application of the model comprises primarily a structure-specific model for the evolution of the condition state of the structure as a function of time and environmental exposure. The condition state model is derived by performing permeability tests as input in a structure-specific model for deterioration as a function of environmental exposure (historical climate or climate change scenarios). The decision points in time correspond to the inspection/condition assessment of the structures, which is typically 3 years in this region. The objective functions are the net present value (user benefits – agency costs) and minimum condition state (performance level).
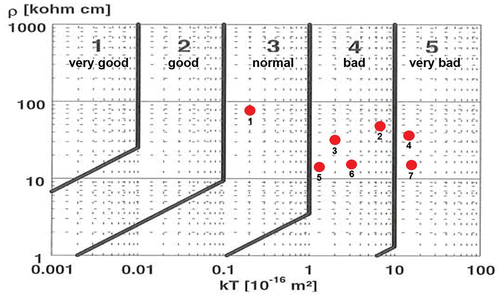
The bridge for the case study was built in 1959. It has four traffic lanes and consists of a portico with two symmetrical spans (each free span is 11.4 m in length). The thickness of the deck is 1 m at the supports and 0.0 m at the centre. Field investigations of the bridge include a visual inspection, and Torrent® permeability and resistivity tests performed at several locations on the underside of the slab and the wing walls (). Locations 1 to 4 are located underneath the slab, whereas locations 5 to 7 are located on the wing wall. The Torrent® method was used to determine the air permeability kT of the concrete (R. J. Torrent, Citation1992). provides the correspondence between the subjective descriptions of the concrete quality as a function of kT for non-saturated mature concrete. When the concrete is wet or partially saturated, an electric resistivity (ρ) test is also performed to correct measurements since these are reduced in the presence of water (R. Torrent & Frenzer, Citation1995). Both parameters (kT, ρ) are combined to determine the quality of the concrete from a chart (). The results of the tests indicate that the overall permeability of the concrete for the bridge is high or that the concrete is of poor quality. The transport of substances in concrete directly depends on the material permeability (Conciatori et al., Citation2010). By testing the permeability, we are able to determine the transport parameters of TransChlor® Model, so as to simulate the chloride profile as accurately as possible.
Figure 5. Locations of field tests performed on the bridge.
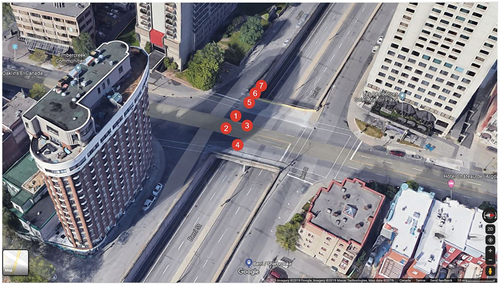
Figure 6. Nomogram for determining the quality classes of concrete as a function of air permeability and resistivity (test results are shown as red dots) (Proceq, Citation2005).
The deterioration model is used to evaluate the probability distribution function for the time to reach each of the four condition states (A to D) defined previously. Historical climatic data from (Environment Canada, Citation2019 is used over the period 1959–2009 to model the current state of the bridge while climate change scenarios RCP 8.5 and RCP 4.5 from the Canadian Regional Climate Model (CanRCMs) (Environment Canada, Citation2020) are used to generate predictions over the next 0 years (2009–2059). The results are then used to determine the TPM for the three climate scenarios and (historical, RCP 8.5 and RCP 4.5) to model the deterioration process for the optimization analysis.
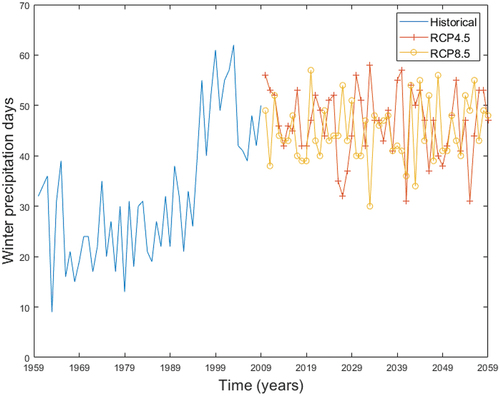
Historical records for the number of annual winter precipitation days reveal a considerable increase over the period 1979 to 2009 compared to the period from 1959 to 1979. The predictions from RCP8.5 and RCP4.5 of winter precipitation for the period 2009 to 2059 remain at the high levels of 1999 to 2009 (). To summarize, the number of winter precipitation day is anticipated to rise by over 30% during the next 0 years in comparison to the historical record.
Figure 7. Total yearly number of winter precipitation days (daily precipitation > 0.1 mm). Historical Records and projections from RCP8.5 and RCP4.5.
The cost data for each M&R activity as a function of the condition states are obtained from a sample of maintenance, repair, and replacement activities in the Montreal area (). For example, at Condition state 3, Action B (minor maintenance) has a cost of $800 per m2.
3.2. Results
presents the resulting transition probabilities of the condition states for concrete covers of 5 mm, 0 mm, and 0 mm, for the three climate scenarios. The 0 mm concrete cover corresponds to the average concrete cover for the bridge under study, while the 0 mm depth is the concrete cover for most existing bridges and the 5 mm cover is used to assess the effect of improperly placed reinforcement on deterioration rates. For all climate change scenarios, the salt spreading protocol in future years is assumed to remain the same as the current protocol.
Figure 8. Condition state probabilities as a function of time (year) for three climate scenarios (Historical, RCP4.5 and RCP8.5) and concrete cover thickness (25 mm, 50 mm and 70 mm).
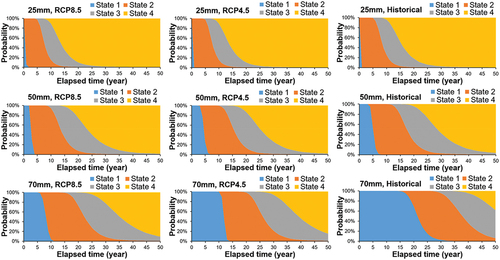
The simulation results show that the initiation time to corrosion is mainly dependent on the number of days of precipitation during the winter. With 0 mm concrete cover, the initiation time to corrosion for historical exposure is within the first 0 years of the service life, whereas the initiation time to corrosion is approximately 0 years under both climate change scenarios due to the significant increase in the number of days with precipitation during the winter.
The model also shows that 40% of the decks constructed 0 years ago that had no or little preventive maintenance (which corresponds to the current practice in many cities) have decks that have reached the end of their service life (i.e., concrete cover is spalling). If a similar lack of maintenance practices were followed for new constructions, the simulations indicate that for both climate change scenarios, due to higher temperatures and more frequent winter precipitation, the proportion of concrete decks that have reached the end of their service life after 0 year increases to 80%.
Results for concrete covers of 0 mm and 5 mm are similar for the historical and climate change scenarios since initiation times are short (around 5 years and 2 years for the 0 mm and 5 mm cases, respectively). The probability for spalling is 90% after 0 years of service for 5 mm covers, and 35 to 0 years for 0 mm covers. Note that the climate scenario RCP 8.5 is associated with the most rapid deterioration processes due to higher temperatures during the winter, which increases the corrosion rate.
The MOPSO and NSGA-II algorithms were programmed into MATLAB® subroutines, and ran using a desktop version of the Windows 10 Enterprise operating system and Intel Core i7-8700HQ 3.0 GHz processor with 64.00 GB of RAM. The parameter settings for a trial study of the MOPSO algorithm are as follows: (1) number of iterations: 300; (2) number of particles in swarm: 300; (3) initial weight: 0.5 (according toEberhart and Kennedy (Citation1995), who recommended an initial weight between 0 and 1); (4) acceleration rates: c1 = 2 and c2 = 2 (as suggested byBabapour et al. (Citation2018)); and (5) velocity boundary (Vmax): 0 and 4. The GA settings were set-up at the condition where population was 300, crossover rate was 0.8, mutation rate was 0.1 (the almost optimum rate for mutation and crossover indicated byBabapour et al. (Citation2018), and the number of generations was 300. The average computational time in this setting are 78 s and 49 s for MOPSO and NSGA-II algorithms, respectively.
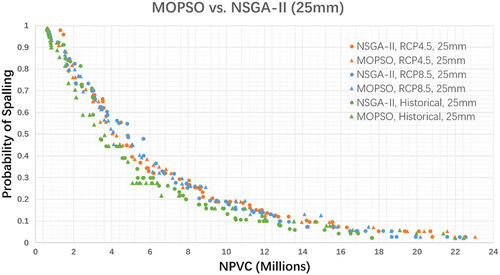
illustrate the Pareto front following 300 iterations in the solution space over the planning horizon for the two optimization techniques. compare the trade-off solutions for different concrete cover thicknesses, whereas illustrate the differences among climate scenarios for given concrete cover thicknesses. Each color-coded triangle and dot in these figures represent a bridge deck M&R strategy using MOPSO and NSGA-II, respectively, and accordingly, provides a unique efficient solution.
Figure 9. Best solutions for three climate scenario and a concrete cover thickness of 25 mm.
3.3. Discussion
A common problem during analysis is choosing a solution from the Pareto front. In general, when one objective of maintenance strategies is optimized, the other objective is often suboptimal. For example, examining the results of MOPSO and NSGA-II for climate scenario RCP4.5 with a concrete cover with a thickness of 0 mm (), assuming that decision makers are economically motivated, or that the budget is limited, solution S1 should be chosen because it minimizes the probability of spalling at the minimum NPVC. However, if the level of performance of the bridge deck is favored over cost, solution S2 is the best because it provides the highest performance (e.g., no spalling during the service life).
Lounis et al. (Citation2006) propose that the end of the service life of RC decks in corrosive environments is reached when an estimated 30% of the deck area has spalled. In this case, competitive maintenance strategies corresponding to this criterion is represented beneath the horizontal red line in . Similarly, if the budget is set as $5M, the best solutions which satisfy this limit are shown on the left side of the vertical red line in . As a consequence, an efficient set of generated results are available in the marked region. It would make sense in this case to select the points at the boundary (minimum cost at 30% spalling or minimum spalling at $5M).
The six representative long-term maintenance plans extracted from the solutions of both optimization techniques are presented in . Each rectangle corresponds to an interval of one year and each color-coded rectangular represents a possible action at that year. Choosing solution X1 for example, the M&R strategies are two major maintenances at year 14 and year 26, and one replacement at year 38, respectively. The digit (e.g., 1 to 4) above the rectangular indicates the expected state of the bridge deck being in that year. The results for maintenance plans X1, X2, X3 from MOPSO and Y1, Y2, Y3 from NSGA-II, are very close for both objectives. However, they exhibit differences in the sequence of maintenance activities. Looking more closely at the maintenance plan indicates that the two algorithms provide a different pattern of M&R actions. Specifically, Plans Y1, Y2 and Y3 of NSGA-II suggest more minor maintenance instead of major maintenance and replacement compared to X1, X2 and X3 of MOPSO, respectively. The combination of frequent minor and major maintenances can prove to be equally effective as replacement (Action D).
Furthermore, one of the most effective ways to optimize the life cycle cost-performance trade-off, when the expected level of the objective (NPVC or probability of spalling) varies, is to obtain a flexible solution. The Pareto front in can logically be divided into three parts. Part 1 includes solutions that have higher probabilities of spalling than solution X1 and Y1 (above X1 and Y1), Part 2 includes solutions (to the right of X3 and Y3) that have greater NPVC than solution X3 and Y3, and Part 3 (in the lower left of the figure) includes solutions that have lower probabilities of spalling than solutions X1 and Y1 and lower NPVC than solutions X3 and Y3. In Part 1, NPVC slightly decreases as probability of failure increases significantly while in Part 2, NPVC substantially increases as the probability of spalling decreases. Moreover, we find that in the region of Part 2, the results from both algorithms are similar. However, in the Part 1 area, in most cases, MOPSO has a slight advantage over NSGA-II. Thus, at the same level of probability of spalling, MOPSO provides lower NPVC than NSGA-II. If the two objectives are equally important to the decision makers, the solutions located in Part 3 could become appropriate trade-offs. Therefore, if no economic constraints exist, further M&R actions will reduce the probability of failure to a very low level. When there are constraints on budgets and performance level of the structure, solutions from the bi-objective optimization can provide efficient compromises between different objectives. Thus, the results show that the proposed method can lead to multiple useful solutions that provide some flexibility to decision makers in practice.
Figure 10. (A) Best solutions for three climate scenarios and a concrete cover thickness of 50 mm; (b) Comparison of Maintenance Plan for the considered optimization techniques.
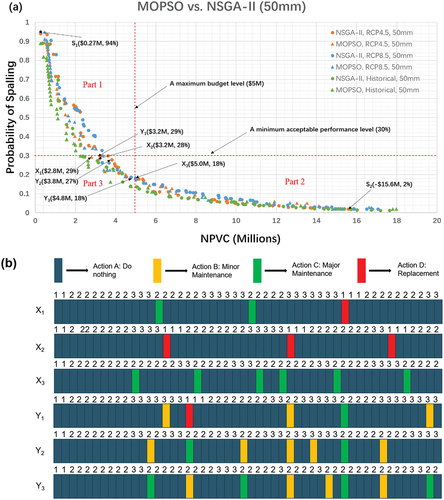
Figure 11. Best solutions for three climate scenario and a concrete cover thickness of 70 mm.
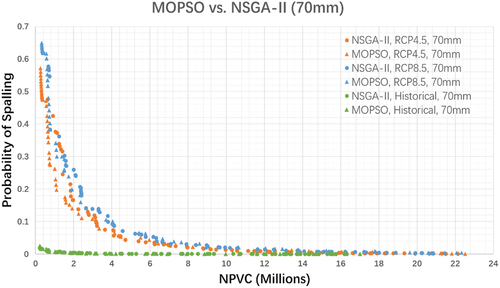
Figure 12. Best solutions for three concrete cover thickness for the RCP8.5 climate change scenario.
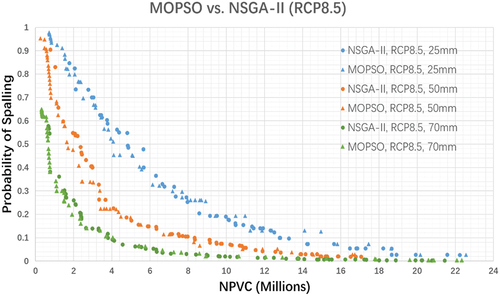
Figure 13. Best solutions for three concrete cover thickness for the RCP4.5 climate change scenario.
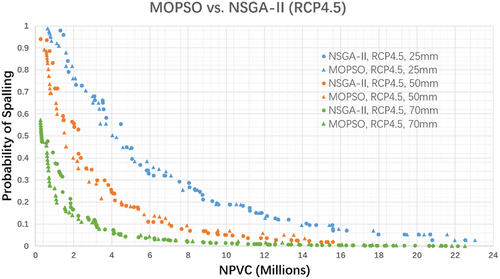
Figure 14. Best solutions for three concrete cover thickness for the Historical climate change scenario.
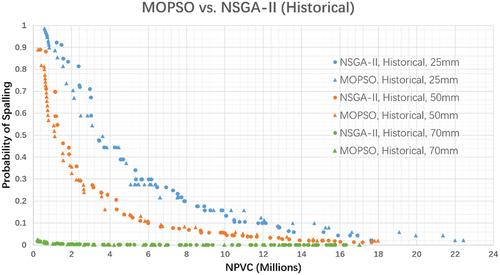
compares the deterioration patterns of the bridge deck (in accordance with the six representative solutions as shown in ). Every solution should comply with all of the requirements already noted in the optimization model. Note that the process of aging has an enormous impact on the deterioration rate. The optimized solutions show that the condition state at year 50 lies between state 2 to state 3, which is the expected result for efficient utilization of the bridge infrastructure. Moreover, the solutions that we obtain provide different choices of the decision boundaries. For example, if a minor maintenance strategy is favored in the best decision sequence, the best solution prompts continuous repair operations throughout the second half of the bridge lifetime. On the other hand, options for a major maintenance decision strategy will reduce the frequency of maintenance operations but may not be cost-effective and in addition cause more downtime of the bridge during the repair in a real-world setting.
Figure 15. Optimized deterioration pattern for the six representative M&R actions of the bridge deck showing different action spread and level throughout the bridge lifetime. (a) two major maintenances and one replacement (X1); (b) three replacements (X2); (c) six major repairs (X3); (d) three minor maintenances, one major maintenance and one replacement (Y1); (e) five minor maintenances and two major maintenances (Y2); (f) four minor maintenances and four major maintenances.
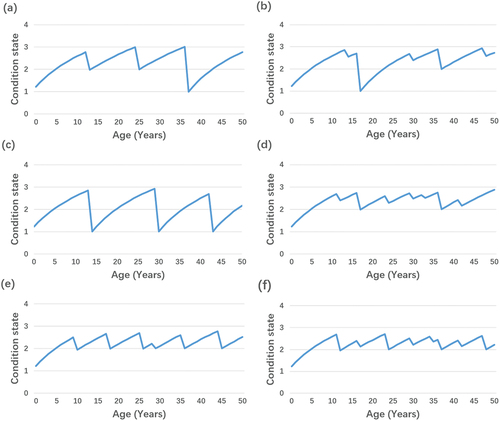
Figure 16. Number of M&R actions as a function of Probability of Spalling for two optimization methods. (a) MOPSO, RCP4.5, 50 mm; (b) NSGA-II, RCP4.5, 50 mm.
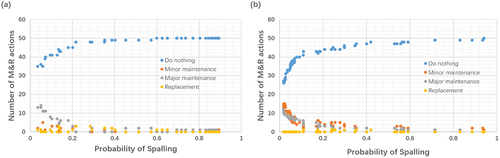
Figure 17. Number of M&R actions as a function of NPVC for two optimization methods (a) MOPSO, RCP4.5, 50 mm; (b) NSGA-II, RCP4.5, 50 mm.
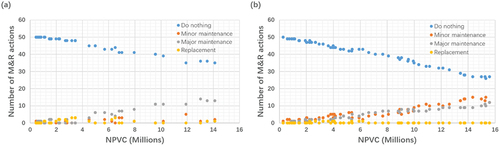
show the number of M&R actions as a function of the Probability of spalling and NPVC, respectively. We can see clear differences between the two optimization approaches in terms of favorability to execute M&R actions. MOPSO prompts the ‘do nothing’ action slightly more often than NSGA-II. In addition, at a 0.6 probability of spalling, MOPSO’s ‘do nothing’ decision reaches saturation, which is faster than that obtained from NSGA. This behavior can be seen as an advantage of MOPSO over the NSGA-II. Additional sensitivity analysis shows the advantage of MOPSO, as depicted in . While the slope of ‘do nothing’ decision is similar in solutions obtained from both optimization approaches, when considering the NPVC, the slopes of action decisions are slightly higher in the case of NSGA-II solutions. This indicates that MOPSO solutions are able to return lower number of maintenance activities to achieve an efficient solution at the same NPVC. Moreover, the results shown in can help decision makers obtain the information about the number of different M&R actions that need to be performed during the 0 years when considering specific policy and better understand the relationship between different actions. It is important to note that changing the population size and other optimization parameters may affect the obtained results, but this is beyond the scope of the present work.
Similar findings can be observed in other scenarios. The results also show that improper quality control at the time of construction for the placement of reinforcing steel (small concrete cover thickness) have a strong negative impact on durability. This will further lead to more M&R actions during the lifetime of the bridge to maintain the deck at the required performance level. Moreover, climate change is expected to negatively affect the durability of concrete structures in Montreal, and it needs to be taken into account when considering future allocations of the funds for infrastructure management.
4. Conclusions
Improving the sustainability and serviceability of infrastructures in the most economical way are important objectives for decision makers given the current state of uncertainty with climate change and the general state of the infrastructure.
An inverse relationship generally exists between the condition of bridge and profit during the operation. It means whenever bridge condition improves, the cost of maintenances will considerably increase. A proper trade-off strategy in these objectives is critical for facility managers.
Therefore, a real case study on a bridge in Montreal (Canada) is conducted to demonstrate the availability of the optimization problem through the application of the two efficient metaheuristics. For a single facility, the developed novel Multi-Objective Optimization model helps in the determination of the sequence of M&R actions over a certain study period ‘N’, and by minimizing NPVC of the rehabilitations in making sure the acceptable level of performance of the infrastructure during the service life.
The optimization techniques are used by developed methodology with Markov chain principles for infrastructure deterioration modelling. The first step is of identification of the data, then two individual models are made for the metaheuristics and Markov chain deterioration process. Next, under the single platform, the novelty also arises through considering the uncertainties with financial, climate change and the exposure to de-icing salts that integrated in the decision model. The results reveal that the deterioration model can accurately predict the service life distribution for current RC bridge decks taking into consideration the climate on a historical basis. The findings also show that under climate change scenarios, the service life of new RC facilities that have been designed utilising current procedures and that are subject to current policies for using de-icing salts would be considerably reduced. The service life reduction is due in main to an increase in the number of precipitation days throughout the winter in despite of an increase in temperatures. The model of intervention effect is by nature dynamic, which means, certain intervention techniques and methods could be implemented with different levels of improvement effects. The analysis of the generated trade-offs between objectives shows that the model was able to generate a wide range of efficient trade-off solutions through the consideration of all specified policies and constraints, and therefore the decision makers could be selected based on the available budget for bridge maintenance and the reliability.
Note that it is necessary to determine the target failure probability in terms of durability for the structure and individual components on the basis of: (a) the design life of the structure; (b) the design life of components; (c) maintenance complexity and costs; and (d) limiting the state-dependent consequences of any failure. A consensus should be reached between the relevant authority with jurisdiction and the owners in terms of the criteria regarding a suitable level of reliability and serviceability. NSGA-II and MOPSO, which are efficient dealing with computational complexity of engineering optimization problems as techniques of MOO are implemented and compared. The findings also show that MOPSO outperforms NSGA-II with respect to NPVC and the probability of spalling.
The major novelty of the model is to propose a general and comprehensive framework for optimal and robust intervention strategies of infrastructure project under climate change and illustrated in the context of urban bridges and viaducts in northern climates. An advanced decision-making process is developed to determine efficient maintenance and replacement strategies to ensure the long-term sustainability and serviceability of these assets. The decision process is formulated as a multi-objective optimization problem for policy-targeted performance levels and total costs and solved using metaheuristic optimization techniques. The presentation of a spectrum of optimal decisions in the form of a Pareto front provides robustness and flexibility to decision-makers as a function of their priorities and a better understanding of the interaction between multiple objectives. The results provide insight on the effectiveness and interaction between minor and major repairs given climate change uncertainty once service life prediction models have been calibrated using the current state of the infrastructure and historical climate records. The results also indicate that annual budget constraints have a significant effect on the Pareto front and the intervention schedule associated with individual solutions. The proposed approach in this work is environmentally more sustainable and is applicable to any infrastructure project. The results obtained in the present study provide decision-makers with valuable new insights for infrastructure management. Optimization of replacements and repairs of infrastructure projects in the context of climate change can reduce future costs and therefore improve long-term investments; the environment and the population can be equally positively impacted by the introduction of designs characterized by durability, longevity, and sustainability. Since optimal strategies are evaluated using both costs and structural reliability, social, human, and natural capital are positively affected by increasing road capacity and reducing commuting times and fuel emissions.
To explore optimal Pareto trade-offs for sustainable designs and infrastructure management, future developments can extend this work by providing a full overview of environmental, equity, economic factors, and policies. As certain results are subject to change in cost models, the systematic sensitivity analysis of cost models is recommended.
Acknowledgments
The authors would like to thank the City of Montreal for their collaboration in providing data and access to the structure for its inspection and evaluation; The authors acknowledge the financial support by FRQNT Team Grant and McGill University Engineering Doctoral Award.
Disclosure statement
No potential conflict of interest was reported by the authors.
Additional information
Funding
Notes on contributors
Yan Zhang
Yan Zhang holds a PhD degree in Civil Engineering from McGill University. His research interests include Risk and Reliability assessment for engineering systems, Data analysis, Finite Element Analysis, and Modelling of financial and physical risks in sustainability of infrastructure.
Luc E. Chouinard
Luc E. Chouinard is a professor in Department of Civil Engineering at McGill University in Montreal, Canada. His research interests include Natural Hazards, Infrastructure Inspection, maintenance and Resilience, and Structural Health Monitoring.
Gabriel J. Power
Gabriel J. Power is a professor of Finance, Université Laval, and the author’s interests are in financial derivatives, risk management, energy finance, project finance, and infrastructure investments.
David Conciatori
David Conciatori is an associate professor at Laval University and his research activities are structured on the 4 axes on durability of structures: (1) Climate analysis and structural exposure. The analysis of climate and exposure of structures are fundamental to the study of aging of existing and future structures. (2) Durability of materials. Durability is being investigated from the perspectives of both existing and new materials. (3) Optimization for Innovative Sustainable Structures. Both previous research areas can be integrated to develop innovative and sustainable structures by optimizing life-cycle costs and impacts through improved durability, less maintenance and repair activities. (4) Vulnerability and sustainability of infrastructure networks. Dependencies and interactions between components of infrastructure systems can have a significant effect on the system short term and long-term performance for stakeholders. Risk management and life-cycle assessment use various criteria and scenarios to perform more effectively and optimal decisions in terms of social, economic and environmental impacts.
Kotaro Sasai
Kotaro Sasai is a PhD student in Civil Engineering at McGill University, Canada, and a specially appointed researcher at Osaka University, Japan. His research interests include infrastructure asset management, deterioration modelling, risk management, and optimization in maintenance, repair, and rehabilitation.
Abdoul S. Bah
Abdoul S. Bah holds a Ph.D. degree in civil engineering from Laval University, and is completing his postdoctoral research with the Durability and Management of Structures research group at Laval University on the development of infrastructure management models.
References
- Al-Smadi, H. (2019). Space-based maintenance management for architectural building systems using multi-objective optimization. Concordia University.
- Angst, U. 2011. ‘Chloride induced reinforcement corrosion in concrete’, Doctoral theses, Norwegian University of Science and Technology, Trondheim.
- Babapour, R., Naghdi, R., Ghajar, I., & Mortazavi, Z. (2018). Forest road profile optimization using meta-heuristic techniques. Applied Soft Computing, 64, 126–137. https://doi.org/10.1016/j.asoc.2017.12.015
- Bai, Q., Miralinaghi, M., Labi, S., & Sinha, K. C. (2021). Methodology for analyzing the trade-offs associated with multi-objective optimization in transportation asset management under uncertainty. Computer-Aided Civil and Infrastructure Engineering, 36(4), 381–401. https://doi.org/10.1111/mice.12637
- Bastidas-Arteaga, E., Chateauneuf, A., Sánchez-Silva, M., Bressolette, P., & Schoefs, F. (2011). A comprehensive probabilistic model of chloride ingress in unsaturated concrete. Engineering Structures, 33(3), 720–730. https://doi.org/10.1016/j.engstruct.2010.11.008
- Bazant, Z. P. (1979). Physical model for steel corrosion in concrete sea structures—Theory. Journal of the Structural Division, 105(6), 1137–1153. https://doi.org/10.1061/JSDEAG.0005168
- Belevičius, R., Jatulis, D., & Šešok, D. (2013). Optimization of tall guyed masts using genetic algorithms. Engineering Structures, 56, 239–245. https://doi.org/10.1016/j.engstruct.2013.05.012
- Bhatti, M. A. (2012). Practical optimization methods: With Mathematica® applications. Springer Science & Business Media).
- Bierlaire, M., Thémans, M., & Zufferey, N. (2010). A heuristic for nonlinear global optimization. INFORMS Journal on Computing, 22(1), 59–70. https://doi.org/10.1287/ijoc.1090.0343
- Blum, C., & Roli, A. (2003). Metaheuristics in combinatorial optimization: Overview and conceptual comparison. ACM Computing Surveys (CSUR), 35(3), 268–308. https://doi.org/10.1145/937503.937505
- Breysse, D., Chaplain, M., Marache, A., & Rodney, E. (2014). Simulation of synthetic climate at local scale as a mean to assess the impact of climate change on infrastructures. Civil Engineering and Environmental Systems, 31(2), 165–178. https://doi.org/10.1080/10286608.2014.912643
- Byrd, R. H., Charles Gilbert, J., & Nocedal, J. (2000). A trust region method based on interior point techniques for nonlinear programming. Mathematical Programming, 89(1), 149–185. https://doi.org/10.1007/PL00011391
- Chen, L., & Bai, Q. (2019). Optimization in decision making in infrastructure asset management: A review. Applied Sciences, 9(7), 1380. https://doi.org/10.3390/app9071380
- Chou, J.S., & Thanh-Son, L. (2011). Reliability-based performance simulation for optimized pavement maintenance. Reliability Engineering & System Safety, 96(10), 1402–1410. https://doi.org/10.1016/j.ress.2011.05.005
- Collins, L. (1972). An introduction to Markov chain analysis, CATMOG. Geo Abstracts Ltd., Univ. of East Anglia.
- Conciatori, D., Brühwiler, E., & Linden, C. (2018). Numerical simulation of the probability of corrosion initiation of RC elements made of reinforcing steel with improved corrosion performance. Structure and Infrastructure Engineering, 14(11), 1446–1454. https://doi.org/10.1080/15732479.2018.1446180
- Conciatori, D., Laferrière, F., & Brühwiler, E. (2010). Comprehensive modeling of chloride ion and water ingress into concrete considering thermal and carbonation state for real climate. Cement and Concrete Research, 40(1), 109–118. https://doi.org/10.1016/j.cemconres.2009.08.007
- Eberhart, R., & Kennedy, J. (1995). “Particle swarm optimization.” In Proceedings of the IEEE International Conference on Neural Networks, 1942–1948. Citeseer.
- Elbaset, A. A., Barakat, S., & Ibrahim, H. (2020). Multi-objective optimization of grid-connected PV-wind hybrid system considering reliability, cost, and environmental aspects. Sustainable Cities and Society, 60, 102178. Sustainable Cities and Society: 102178. https://doi.org/10.1016/j.scs.2020.102178
- Environment Canada. (2019). “Environment and cLIMATE CHANGE Canada”. Retrieved from the Historical Climate Data website: https://climate.weather.gc.ca/historical_data/search_historic_data_e.html.
- Environment Canada. (2020). “CanRCM4 model output”. Retrieved from the Canadian Centre for Climate Modelling and Analysis website: http://climate-modelling.canada.ca/climatemodeldata/canrcm/CanRCM4/index_cordex.shtml.
- Farran, M., & Zayed, T. (2012). New life-cycle costing approach for infrastructure rehabilitation. Engineering, Construction and Architectural Management, 19(1), 40–60. https://doi.org/10.1108/09699981211192562
- Frangopol, D. M. (2011). Life-cycle performance, management, and optimisation of structural systems under uncertainty: Accomplishments and challenges 1’. Structure and Infrastructure Engineering, 7(6), 389–413. https://doi.org/10.1080/15732471003594427
- Frangopol, D. M., & Soliman, M. (2016). Life-cycle of structural systems: Recent achievements and future directions. Structure and Infrastructure Engineering, 12(1), 1–20. https://doi.org/10.1080/15732479.2014.999794
- Gen, M., & Cheng, R. (2000). Genetic algorithms and engineering optimization. 2000. John Wiley&Sons.
- Goldberg, D. E., & Holland, J. H. (1988). Genetic algorithms and machine learning. Machine Learning, 3(2/3), 95–99. https://doi.org/10.1023/A:1022602019183
- Hadiwardoyo, S. P., Gomes Correia, A., Pereira, P., & Pereira, P. (2017). Pavement maintenance optimization strategies for national road network in indonesia applying genetic algorithm. Procedia Engineering, 210, 253–260. https://doi.org/10.1016/j.proeng.2017.11.074
- Hernández-Chover, V., Castellet-Viciano, L., & Hernández-Sancho, F. (2019). Cost analysis of the facilities deterioration in wastewater treatment plants: A dynamic approach. Sustainable Cities and Society, 49, 101613. https://doi.org/10.1016/j.scs.2019.101613
- Hertz, A., Schindl, D., & Zufferey, N. (2005). Lower bounding and tabu search procedures for the frequency assignment problem with polarization constraints. 4or, 3(2), 139–161. https://doi.org/10.1007/s10288-004-0057-3
- Hillier, F. S. (2012). Introduction to operations research. McGraw-Hill.
- Horn, J., Nafpliotis, N., & Goldberg, D. E. (1994). “A niched Pareto genetic algorithm for multiobjective optimization.” In Proceedings of the first IEEE conference on evolutionary computation. IEEE World Congress on Computational Intelligence, 82–87. Ieee.
- Hunkeler, F. (2005). Corrosion in reinforced concrete: Processes and mechanisms. Corrosion in Reinforced Concrete Structures, 1–45.
- Kalyanmoy, D., Pratap, A., Agarwal, S., & Meyarivan, T. A. M. T. (2002). A fast and elitist multiobjective genetic algorithm: NSGA-II. IEEE Transactions on Evolutionary Computation, 6(2), 182–197. https://doi.org/10.1109/4235.996017
- Khayamim, R., Shetab-Boushehrib, S.N., Hosseininasab, S.M., & Karimi, H. (2020). A sustainable approach for selecting and timing the urban transportation infrastructure projects in large-scale networks: A case study of Isfahan, Iran. Sustainable Cities and Society, 53, 101981. https://doi.org/10.1016/j.scs.2019.101981
- Kim, S., Frangopol, D. M., & Soliman, M. (2013). Generalized probabilistic framework for optimum inspection and maintenance planning. Journal of Structural Engineering, 139(3), 435–447. https://doi.org/10.1061/(ASCE)ST.1943-541X.0000676
- Lalwani, S., Singhal, S., Kumar, R., & Gupta, N. (2013). A comprehensive survey: Applications of multi-objective particle swarm optimization (MOPSO) algorithm. Transactions on Combinatorics, 2(1), 39–101.
- Li, Y., & Fan, W. (2021). Bi-level optimization of long-term highway work zone scheduling considering elastic demand. Smart and Resilient Transport, 3(2), 118–130. https://doi.org/10.1108/SRT-01-2021-0004
- Lin, M.H., Tsai, J.F., & Chian-Son, Y. (2012). A review of deterministic optimization methods in engineering and management. Mathematical Problems in Engineering, 2012, 1–15. https://doi.org/10.1155/2012/756023
- Lounis, Z., & Daigle, L. (2008). ‘Reliability-based decision support tool for life cycle design and management of highway bridge decks’, In Annual Conference of the Transportation Association of Canada, 1–19.
- Lounis, Z., Martin-Perez, B., Daigle, L., & Zhang, J. (2006). Decision support tools for service life prediction and rehabilitation of concrete bridge decks-final report. Institute for Research in Construction, National Research Council Canada, B5318. 2.
- Lounis, Z., & McAllister, T. P. (2016). Risk-based decision making for sustainable and resilient infrastructure systems. Journal of Structural Engineering, 142(9), F4016005. https://doi.org/10.1061/(ASCE)ST.1943-541X.0001545
- ManWo, N., Zhang, Z., & Travis Waller, S. (2011). The price of uncertainty in pavement infrastructure management planning: An integer programming approach. Transportation Research Part C: Emerging Technologies, 19(6), 1326–1338. https://doi.org/10.1016/j.trc.2011.03.003
- Menon, S., Karl, J., & Wignaraja, K. (2009). Handbook on planning, monitoring and evaluating for development results. UNDP Evaluation Office.
- Moteleb, M. (2010). ‘Risk based decision making tools for sewer infrastructure management’, Ph.D. Thesis, University of Cincinnati.
- Palko, K., & Stanley Lemmen, D. (2017). Climate risks and adaptation practices for the Canadian transportation sector 2016. Government of Canada.
- Parsopoulos, K. E., & Vrahatis, M. N. (2002). Recent approaches to global optimization problems through particle swarm optimization. Natural Computing, 1(2/3), 235–306. https://doi.org/10.1023/A:1016568309421
- Poli, R., Kennedy, J., & Blackwell, T. (2007). Particle swarm optimization. Swarm Intelligence, 1(1), 33–57. https://doi.org/10.1007/s11721-007-0002-0
- Portnoy, S., & Koenker, R. (1997). The Gaussian hare and the Laplacian tortoise: Computability of squared-error versus absolute-error estimators. Statistical Science, 12(4), 279–300. https://doi.org/10.1214/ss/1030037960
- Proceq. (2005). Permeability Tester TORRENT. Operating Instructions.
- Respen, J., Zufferey, N., & Amaldi, E. (2016). Metaheuristics for a job scheduling problem with smoothing costs relevant for the car industry. Networks, 67(3), 246–261.
- Salimi, M., & Al-Ghamdi, S. G. (2020). Climate change impacts on critical urban infrastructure and urban resiliency strategies for the Middle East. Sustainable Cities and Society, 54, 101948. https://doi.org/10.1016/j.scs.2019.101948
- Santos, J., Ferreira, A., & Flintsch, G. (2017). A multi-objective optimization-based pavement management decision-support system for enhancing pavement sustainability. Journal of Cleaner Production, 164, 1380–1393. https://doi.org/10.1016/j.jclepro.2017.07.027
- Santos, J., Ferreira, A., Flintsch, G., & Cerezo, V. (2018). A multi-objective optimisation approach for sustainable pavement management. Structure and Infrastructure Engineering, 14(7), 854–868. https://doi.org/10.1080/15732479.2018.1436571
- Sarma, K. C., & Adeli, H. (1998). Cost optimization of concrete structures. Journal of Structural Engineering, 124(5), 570–578. https://doi.org/10.1061/(ASCE)0733-9445(1998)124:5(570)
- Schmitt, L. M. (2001). Theory of genetic algorithms. Theoretical Computer Science, 259(1–2), 1–61. https://doi.org/10.1016/S0304-3975(00)00406-0
- Shim, H. S., & Hyun Lee, S. (2017). Balanced allocation of bridge deck maintenance budget through multi-objective optimization. KSCE Journal of Civil Engineering, 21(4), 1039–1046. https://doi.org/10.1007/s12205-016-0591-5
- Silver, E. A., Victor, R., Vidal, V., & de Werra, D. (1980). A tutorial on heuristic methods. European Journal of Operational Research, 5(3), 153–162. https://doi.org/10.1016/0377-2217(80)90084-3
- Thevenin, S., Zufferey, N., & Potvin, J. Y. (2018). Graph multi-coloring for a job scheduling application. Discrete Applied Mathematics, 234, 218–235.
- Thomas, O., & Sobanjo, J. (2016). Semi-Markov models for the deterioration of bridge elements. Journal of Infrastructure Systems, 22(3), 04016010. https://doi.org/10.1061/(ASCE)IS.1943-555X.0000298
- Torrent, R. J. (1992). A two-chamber vacuum cell for measuring the coefficient of permeability to air of the concrete cover on site. Materials and Structures, 25(6), 358–365. https://doi.org/10.1007/BF02472595
- Torrent, R., & Frenzer, G. (1995). “A method for the rapid determination of the coefficient of permeability of the “covercrete In International Symposium Non-Destructive Testing in Civil Engineering (NDT-CE), 985–992.
- Xie, M., & Tian, Z. (2018). Risk-based pipeline re-assessment optimization considering corrosion defects. Sustainable Cities and Society, 38, 746–757. https://doi.org/10.1016/j.scs.2018.01.021
- Yan, Z., Chouinard, L. E., Conciatori, D., & Power, G. J. (2021). Bayesian procedures for updating deterioration space-time models for optimizing the utility of concrete structures. Engineering Structures, 228, 111522. https://doi.org/10.1016/j.engstruct.2020.111522
- Zhang, Y., Chouinard, L. E., & Conciatori, D. (2018). Markov chain-based stochastic modeling of chloride ion transport in concrete bridges. Frontiers in Built Environment, 4, 12. https://doi.org/10.3389/fbuil.2018.00012
- Zhang, Y., Chouinard, L. E., Power, G. J., Tandja M, C. D., & Bastien, J. (2020). Flexible decision analysis procedures for optimizing the sustainability of ageing infrastructure under climate change. Sustainable and Resilient Infrastructure, 5(1–2), 90–101. https://doi.org/10.1080/23789689.2018.1448665
- Zhang, W., & Wang, N. (2017). Bridge network maintenance prioritization under budget constraint. Structural Safety, 67, 96–104. https://doi.org/10.1016/j.strusafe.2017.05.001
- Zheng, W., Flintsch, G. W., & Chowdhury, T. (2008). Hybrid multiobjective optimization model for regional pavement-preservation resource allocation. Transportation Research Record, 2084(1), 28–37. https://doi.org/10.3141/2084-04