
ABSTRACT
In California, wastewater systems have adapted to water conservation and drought for decades. Yet, few studies have investigated how past design assumptions influence potential mitigation and adaptation actions. This paper evaluates adaptation pathways for wastewater management in California and addresses two questions. First, are wastewater facilities experiencing challenges from mismatches in design flow values and current rates of influent flow? Second, what, if any, adaptation actions are underway or planned? To answer these questions, we compiled historical literature and conducted surveys and interviews with wastewater system managers. Approximately half of respondents indicated that they are experiencing challenges associated with changing water use rates. Aging systems have implemented many types of mitigation and adaptation actions, including operational changes, chemical additions, and facility rebuilds. California’s wastewater industry is largely pursuing an incremental adaptation pathway to manage drought and climate change. The paper demonstrates an engaged approach to research on climate change adaptation.
1. Introduction
Wastewater management is a critical sector of infrastructure, but wastewater systems in many industrialized countries are aging and in need of maintenance. Modern wastewater systems U.S. cities were built through several waves of capital investment. From 1870 to 1920, the percentage of the urban population with access to sewer services rose from 4.5% to 47.5% (Pearse, Citation1938). Another round of investment followed World War II, when total public water and wastewater infrastructure spending increased from $8.6 billion to $13.6 billion between 1950 and 1960 (Aldrich, Citation1979). The passage of the Clean Water Act (P.L. 92–500) was accompanied by further investments, particularly for treatment plants (Ramseur, Citation2018). These investments were motivated by compounding environmental challenges to modernize cities, ensure potable water of high quality, and manage the sewage generated by high rates of water use (Tarr, Citation1984, Citation1984).
Today, many U.S. wastewater systems built in these prior eras include a significant portion of infrastructure that was designed under different requirements and specifications. An estimated 25% of the U.S. gravity sewer network is over 40 years old (Ariamalar & Tafuri, Citation2012). Significant percentages of many gravity sewers are approaching their expected lifetime. The U.S. EPA 2012 Clean Watershed Needs Survey estimated $271 billion in investment needs across the U.S. for wastewater infrastructure, with 75% of that specific to wastewater collection and treatment systems (Grigg, Citation2019; USEPA, Citation2012).
The challenges of adapting existing U.S. wastewater systems to future water use and climate change conditions are spurring renewed interest in investments and innovation (Kiparsky, Sedlak, Thompson, et al., Citation2013). Aging systems must function with operational conditions that may be far different than those for which they were designed. Large infrastructure systems are typically constructed and financed as long-term investments that last 30 years or more. In California, many existing wastewater treatment plants were built with the assumption of growing populations and historically higher per capita rates of municipal water use. Reductions in water use from conservation and long-term efficiency affect the volume of influent that reaches wastewater treatment plants (DeZellar & Maier, Citation1980; Koyasako, Citation1980; Schwabe, Nemati, Amin, et al., Citation2020). Decreasing rates of water consumption can lead to many changed conditions that require adaptation actions, including more concentrated influent and, for areas with stable or decreasing populations, lower influent flows (Qureshi & Shah, Citation2014; Tran, Jassby, & Schwabe, Citation2017). These compound with stricter discharge requirements and new constituents from household products. Drought can exacerbate these effects by reducing infiltration and inflow in collection systems, which supports baseflow and provides flushing. During the 2012–2016 drought in California, many wastewater agencies reported changes in wastewater influent that required mitigation. In a survey of 133 wastewater agencies, over 80% of respondents witnessed declines in influent flows and over 60% observed changes in influent quality. One-third had to take adaptive actions to maintain water quality because of changes in influent quality (Chappelle, McCann, Jassby, et al., Citation2019). When combined with increasingly stringent water quality regulations, these changes in water use create complex long-term adaptation challenges.
Climate change in California will bring many years with hotter and drier conditions, likely spurring water use reductions and further regulations (Diffenbaugh, Swain, & Touma, Citation2015; Pierce, Kalansky, & Cayan, Citation2018; Swain, Baird Langenbrunner, Hall, et al., Citation2018). Given likely future scenarios, research must critically examine adaptation needs and pathways for existing aging infrastructure systems such as wastewater. Wastewater infrastructure systems are subject to path dependence, meaning that once built and operating, they are expensive to change (David, Citation1985; Liebowitz & Margolis, Citation1995). Yet, limited research has examined how past planning assumptions in the wastewater sector influence adaptation options today, or what actions wastewater managers are currently pursuing to deal with contemporary or future challenges. This study evaluates current adaptation pathways that wastewater systems in California are using to manage challenges of water scarcity and conservation. The study investigates two questions. First, are wastewater facilities experiencing challenges from mismatches in design flow values and current influent flow rates? Second, what, if any, actions are local agencies pursuing (or planning to pursue) to manage wastewater given water use declines and likely higher risk of drought?
To address these questions, we conducted surveys and interviews with managers of wastewater collection, treatment, and reuse systems throughout the state and analyzed historical planning literature to understand adaptation pathways in wastewater infrastructure. The findings that we report here were part of a multi-year study to evaluate potential effects of water conservation on urban wastewater collection, treatment, and reuse systems in California undertaken in support of implementing urban water conservation regulations required by statewide legislation (AB 1668-SB 606). Further analysis and results are publicly available (OWP at Sacramento State, Citation2022). In this paper we present findings from industry outreach and characterize the emergent adaptive pathways being pursued by wastewater system managers and operators in California. The study demonstrates how an engaged approach for regulatory planning and empirical analysis can introduce stakeholder knowledge into the development of regulations and policy-making for infrastructure system resilience.
2. Methods
The analysis used an iterative, mixed-methods approach to evaluate adaptation options within a hierarchical set of socio-technical systems that include both engineered infrastructure and wastewater management institutions (Hughes, Citation1993). The research included three efforts (). First, an extensive analysis of literature was conducted with a focus on evaluating historical documents related to wastewater system design guidance, potential effects of changing influent flows, and adaptation actions. We used historical studies to identify past and potential future effects that water conservation has on wastewater conveyance and treatment. We also assessed changes in wastewater management design criteria to understand how past actions have influenced current choices and path dependence of technological and managerial options. The Supplemental Data section to this paper includes a detailed summary of the effects and mitigation adaptation actions described in literature for managing wastewater with lower influent flow levels.
Figure 1. Flow-chart of mixed-methods approach. The literature review, outreach efforts, and statewide data were used to inform analysis of survey results. The outreach process was iterative with industry interviews and the literature review informing the development of survey and follow-up interview questions.
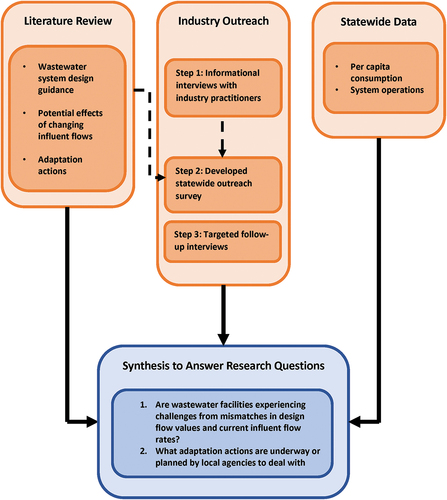
Second, we conducted extensive industry outreach. We initially had initial informational interviews with a limited number of industry practitioners to understand recent effects and adaptation actions. We then developed a survey for a broader outreach, refining the questions through peer-review with industry contacts. We administered the surveys to wastewater system managers and operators across the state with assistance from several statewide wastewater industry associations. Afterwards, we conducted follow-up targeted interviews with several agencies that had reported challenges and ongoing adaptation actions.
Third, we synthesized findings from the literature analysis and industry outreach (surveys and interviews) with data on operations and per capita consumption in California to answer the research questions. Results were used to inform the development of quantitative modeling of wastewater collection, treatment, and reuse systems under future conditions; those results are reported elsewhere (OWP at Sacramento State, Citation2022).
2.1. Analysis of literature
We conducted an analysis of literature (peer-reviewed journals, industry documents, current and past wastewater-related textbooks and manuals, and annual sanitation agency reports). Using a snowballing approach (Jalali & Wohlin, Citation2012; Wohlin, Citation2014) we identified studies that focused on several main topics: 1) recent assessments of the effects of water conservation and drought on wastewater systems in California, including regional assessments and industry documentation; 2) historical literature from engineering design manuals and textbooks for changes in design guidelines over time; and 3) scientific literature that addressed theoretical and empirical aspects of process engineering. Concepts such as biochemical and physical changes of wastewater composition in collection systems and relationships between water use rates and constituent loading across treatment processes and facility types were used to inform modeling. In this effort, we used the Google Scholar and Google search engines to compile a library of references with peer reviewed and non-peer reviewed sources. Searches were performed by searching key terms related to the topics previously listed in this paragraph. They focus was conservation-related, especially on system design guidance as well as the chemical, biological, and physical processes that take place in both treatment facilities and collection systems. A full list of identified materials is provided in Supplemental Data.
2.2. Outreach
In 2021, we conducted outreach with managers of wastewater collection, treatment, and reuse systems to learn more about operational challenges experienced since 2011 (i.e., dating back to the last major drought in California). We developed three questionnaires for managers of collection, treatment or reuse systems, respectively, which were administered to municipal and sanitation district agencies. Responses were solicited from agency personnel with engineering design and operations responsibilities.
Respondents were asked about challenges they had experienced and adaptation actions they had already undertaken to deal with lower influent flows and higher constituent concentrations. The questions were developed based the on the predicted impacts of lower flows and the associated responses for collection systems, wastewater treatment facilities, and wastewater reuse facilities. For a more in-depth discussion of these impacts and responses, please refer to Tables S4, S6, and S7 in the supplemental material. Questions were also developed to categorize (or bin) potential effects in an ordinal ranking, with respondents being asked about anticipated effects of flow reductions of 5%, 10%, or 20% from recent rates. Reductions in influent volume of 5%, 10%, and 20% were chosen based on projected reduction in per capita use for the State of California determined by the previously mentioned multi-year study to evaluate potential effects of water conservation in California. Percentages were rounded to 5%, 10%, and 20% for ease of survey respondents. Guidelines were provided in the survey instructions to help interpret ordinal rankings, but ultimately the responses were subject to the interpretation of respondents.
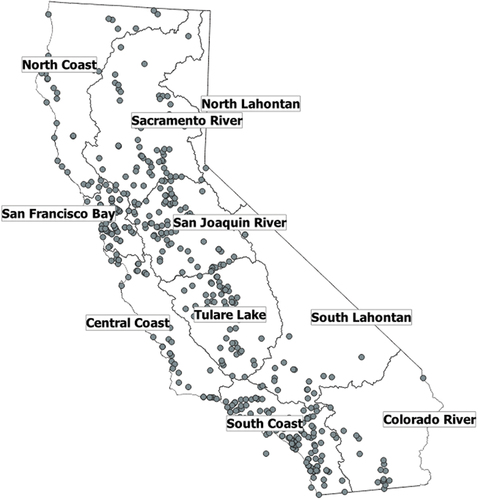
The surveys were coded and administered online. Key wastewater industry groups in California were engaged to solicit input from members through a webinar and email distribution lists. The target audience was agencies and facilities that may experience environmental and economic effects from statewide regulations focused on large water suppliers serving urban and suburban areas. The total number of potentially-affected systems was estimated to be 442 wastewater treatment and/or reuse systems and 307 collection systems (). These values represent an approximate total number of potential respondents given a one hundred percent response rate. The number of recipients of the survey was unknown, so it was not possible to calculate a response rate.
Figure 2. Map of wastewater facilities in California serving large water suppliers, with boundaries of hydrologic regions shown. Northern and Eastern areas of the state receive more precipitation, while Southern areas are drier.
In total, we received completed responses from 69, 81, and 76 individuals for the surveys focused on collection, treatment, and reuse, respectively (). For wastewater collection systems, responses were submitted by 50 distinct agencies. For wastewater treatment facilities, responses were submitted by 65 agencies related to 84 distinct facilities. For wastewater reuse facilities, responses were received from 58 agencies related to 76 distinct facilities. Respondents were encouraged to complete the surveys for any or all of the types of systems that they managed. In total, the results covered 97 different agencies throughout the state of California and 117 treatment and reuse facilities ranging in size from 0.02 million gallons per day (mgd) to over 400 mgd. Results were anonymized and aggregated to preserve confidentiality. Results were not reported for any questions with 4 or fewer responses. We analyzed quantitative and qualitative survey results. For qualitative survey results, provided as written text, we grouped responses by themes to identify notable trends.
Table 1. Number of potentially impacted facilities compared to number of responses and represented agencies and facilities in survey results. (Note: the number of agencies the survey was distributed to is unknown).
3. Results
The analysis of the survey results was focused on: 1) changes in planning assumptions over time that influence current decisions and path dependence of existing systems; 2) current and potential adaptation actions by the wastewater industry in California to manage changing influent flow and concentrations, and 3) current adaptation pathways for managing effects of water conservation on collection, treatment, and reuse operations.
3.1. Changes in wastewater system planning assumptions over time
Reductions in water use from conservation and long-term efficiency can directly affect the volume of influent that reaches wastewater treatment plants (DeZellar & Maier, Citation1980; Koyasako, Citation1980; Schwabe, Nemati, Amin, et al., Citation2020; Tran, Jassby, & Schwabe, Citation2017). Wastewater infrastructure typically lasts for decades, and most existing wastewater treatment systems in California were designed and constructed at a time when future population projections and water consumption rates were significantly different from current values. For instance, the 1998 California Water Plan Update forecasted that in 2020, 47 million people would live in California with an urban per capita use rate of 227 to 256 gallons per capita per day (gpcd) in cities and suburbs (DWR, Citation1998). Instead, approximately 39 million people live in California today (Census, Citation2021) and the state’s urban per capita water use rate was approximately 125 gpcd in 2019 ().
Figure 3. Annual per capita water consumption in California from 1991 to 2019 in California. Only a few agencies provided per capita demand reporting in 2011–12 (Source: Author calculations based on data from urban water management plans compiled by the California Department of Water Resources and electronic annual reports of water use data collected by the State Water Resources Control Board).
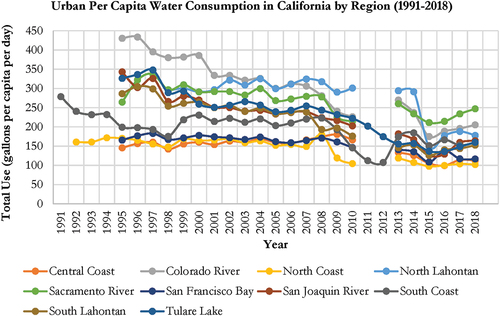
Decreasing per capita water use is related to several factors. First, state and federal regulations require more efficient fixtures and appliances (DeOreo, Mayer, Dziegielewski, et al., Citation2016; Diringer, Cooley, Heberger, et al., Citation2018). Second, as costs for water and wastewater treatment increase, commercial, industrial, and institutional users are incentivized to grow more efficient. Third, residents have responded to public service messaging during droughts with indoor and outdoor conservation practices, some of which persist (Lee, Nemati, & Dinar, Citation2021). For instance, during the 2011–2016 severe drought, urban areas reduced urban water use by nearly 25% (Lund, Medellin-Azuara, Durand, et al., Citation2018; Mitchell, Hanak, Baerenklau, et al., Citation2017). For 45 wastewater treatment facilities in urban Southern California, drought-based water conservation requirements in 2014–2016 resulted in a 6–10% decline in effluent flow from wastewater treatment plants after controlling for other influencing factors. These water conservation actions also increased total dissolved solids (TDS) in treatment plant wastewater effluents by 5–12%. Effects included increased concentrations of Total Dissolved Solids (TDS), sodium, chlorine, calcium, and nitrogen (Schwabe, Nemati, Amin, et al., Citation2020; Tran, Jassby, & Schwabe, Citation2017).
While influent flow rates are a significant driver of potential effects, they are not the only driver. Other factors impacting influent flow rates include installation of reduced flow appliances and fixtures, indoor and outdoor greywater use, and satellite systems reuse (Table S1 in Supplemental Data). For long-term adaptation planning, water conservation drivers must be considered in conjunction with population changes, adoption of water-efficient appliances, the design parameters for wastewater collection and treatment systems, and other factors. These dynamics can interact to magnify or mitigate how lower flows and higher concentrations affect current systems. For instance, in a smaller wastewater treatment facility with steady flows, increased constituent concentrations can be problematic. However, concentration challenges could be partially mitigated if a growing population maintains a total volume and rate of influent flow close to the plant’s most efficient operating range. In California, monitoring data indicates that over 50% of facilities currently treat wastewater influent with average concentrations of Biochemical Oxygen Demand (BOD) and Total Suspended Solids (TSS) at values over 300 mg/L, which are higher than historical design parameters ( and ). TSS and BOD concentrations of 200 mg/L are typically considered medium strength wastewater influent, with values closer to 400 mg/L considered high strength influent.
Figure 4. Cumulative distribution of constituent concentrations in wastewater influent at wastewater treatment facilities in California (Source: Developed by authors, based on data from the California Integrated Water Quality System).
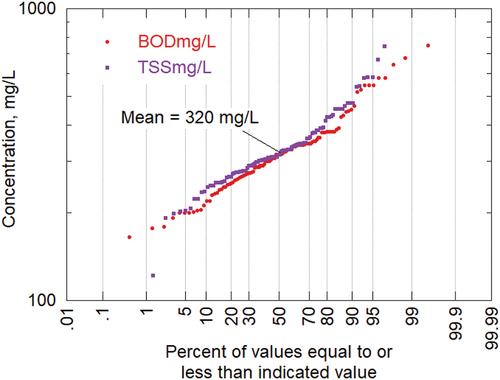
Table 2. Comparison of how wastewater characteristics have changed over the life of typical California wastewater treatment facilities based on assumed rates of mass loading and indoor water consumption (Note: Assumed BOD and TSS loadings of 76 and 74 g/cap-d, Source: Tchobanoglous et al., 2015).
Thresholds of influent flow can be correlated with historical design parameters used in wastewater collection system and treatment facility planning over time. Prior to 1980, many design manuals called for influent design flows of 100 gallons per capita per day or more. In later decades, this decreased to 70 gpcd and, based on recent regulatory proceedings, as little as 50 gpcd of influent flow. These changes in a relatively short period of time have instigated many types of challenges ().
Table 3. Wastewater management challenges associated with various thresholds of normalized influent flow rates, which have served as design parameters during recent decades (Source: Created by authors based on literature review. TDS = Total Dissolved Solids, BNR = Biological Nutrient Removal, N = Nitrogen).
3.2. Survey results: reported challenges and adaptation actions
The sections below summarize findings from the survey questions for collection, treatment, and reuse systems, respectively.
3.2.1. Wastewater collection system responses
Of collection system respondents (n = 71), slightly less than half (n = 34, 48%) reported challenges due to reduced influent flow since 2011. The breakdown of survey responses for those who did report challenges is shown in . In the survey, respondents were asked to classify their challenges as ‘major’ (those that were widespread, or happened frequently, or required significant changes in workload) and ‘minor’ (those that could not be ignored, but could be mostly handled as a normal part of operations). As shown, respondents were surveyed on several categories of challenges, including system blockages, equipment and infrastructure challenges, and operating issues. For pipe blockages, ‘Solids accumulation/settling in the pipes’ and ‘Flow patterns (e.g., surges, more variability)’ were the primary challenges. Collection system respondents also reported experiencing equipment and infrastructure challenges. For operating challenges, odors were most frequently mentioned, followed by pipe restrictions and high mass loading events.
Figure 5. Reported challenges by collection system respondents for lower-influent-flow challenges, by category and severity of the challenge. Responses with ‘none’ are not displayed.
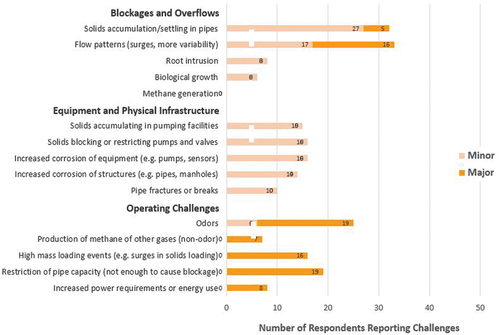
Many collection systems that were installed decades ago are overdesigned for current flow rates. This is likely a key driver of many reported issues. Survey respondents identified a number of adaptation actions that they are taking to mitigate undesirable effects (). Actionsincluded increased flushing to reduce clogging, more frequent inspections, adding chemicals to control odors, and upgrading pumping systems. Respondents did not indicate that they were undertaking widespread replacement of pipes that were better sized for current flows, which is likely rooted in the significant associated cost. A few respondents noted how increased retention time of sewage in the collection systems, especially in upstream lateral lines, was leading to changes in the composition of wastewater influent. At this time, the major challenges reported were associated with operations rather than damage to physical infrastructure.
Table 4. Reported mitigation and adaptation actions by collection system respondents for challenges associated with lower influent flows.
The reported issues point to the challenges of accelerated corrosion, which can reduce expected lifetimes and integrity of pipes, valves, and other components. Yet, in survey results, respondents noted primarily minor issues with corrosion of pumps, sensors, pipes, and manholes. The discrepancy should be explored further. It could be that corrosion is difficult to detect and will only become more visible as effects worsen. Many parts of collection systems are underground and expensive to inspect and replace. In our interviews, only a few agencies indicated that they were collecting data on corrosion of hydrogen sulfide production.
3.2.2. Wastewater treatment system responses
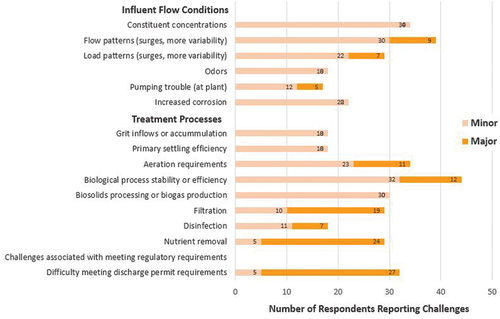
For wastewater treatment systems, of 81 completed responses, more than half (n = 54, 63%) reported experiencing challenges due to low flow since 2011. The breakdown of survey respondents who did report challenges is shown in . In the survey, respondents classified their challenges as ‘major’ or ‘minor’ using the definitions presented above. Respondents were surveyed on several categories of challenges, including constituent concentrations, biological process stability or efficiency, and operating difficulties. Unsurprisingly, ‘constituent concentrations’ was the most commonly reported challenge followed by ‘biological process stability or efficiency’. Most of the reported challenges were characterized as ‘minor’ but the exceptions are notable. Most of those respondents reporting problems with nutrient removal and meeting discharge permit requirements classified these as ‘major’ challenges.
Figure 6. Reported challenges by treatment system respondents for lower-influent-flow challenges, by category and severity of the challenge.
Adaptation actions are summarized in . The two actions most often reported were increased electricity/energy use and additional/different chemical purchases. Where capital improvements were undertaken, biological systems, blowers, and headworks facilities were most commonly cited. The need for capital improvements at headworks is likely a response to surges and variability in flow and load patterns, as well as generation of hydrogen sulfide in the collection system that produces acids (causing corrosion) and odors. Through text responses in surveys, respondents identified a variety of mitigation actions, including lowering the pH of activated sludge, using flow augmentation and equalization to stabilize influent characteristics, and adjusting the use of aeration basins in some seasons.
Table 5. Reported mitigation and adaptation actions by treatment system respondents for lower-influent- flow challenges.
3.2.3. Wastewater reuse system responses
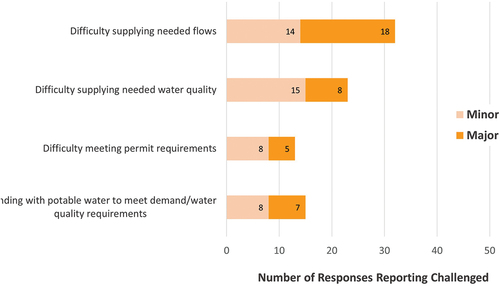
For wastewater reuse systems, out of 76 completed responses, half of wastewater reuse systems (n = 38, 50%) experienced challenges due to low flow since 2011. The breakdown of survey responses that did report challenges is shown in . As before, respondents classified their challenges as ‘major’ and ‘minor’. The most common problem reported was challenges in supplying needed flows. Aggressive water conservation measures are usually associated with a deficiency in the freshwater supply. In these circumstances, recycled water becomes the next source of supply. As reported by several respondents, though, with water conservation, the demand for recycled water increases, but the supply of water that can be recycled declines.
Figure 7. Reported challenges by reuse system respondents for lower-influent-flow challenges, by category and severity of the challenge.
3.3. Adaptation strategies for reduced influent flow
Across the survey responses and interviews, many respondents indicated that their systems and facilities had experienced only moderate effects from lower flows since 2011. Significant percentages of collection system respondents did indicate experiencing major operating challenges, especially odor control from septic conditions in collection systems, higher mass loading, and deposited sludge in pipes. Some wastewater treatment facility respondents indicated major challenges, but at lower comparative rates. For reuse respondents, just under half indicated challenges to provide sufficient inflow to maintain recycled water production operations.
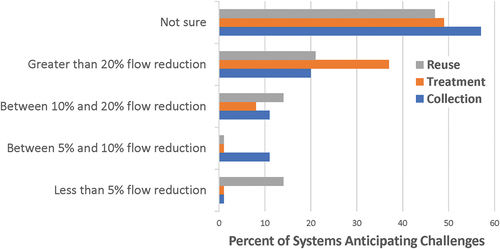
Decision-making for adaptation actions requires knowledge of future conditions. However, respondents reported uncertainty on the relationship between flow reductions and the need for mitigation responses or capital investments. Across all types of systems, 45% to 55% of respondents indicated that they were unsure at what level of flow reduction new mitigation actions or capital investments would be required ().
Figure 8. The correlation between potential influent flow reduction scenarios and anticipated need for mitigation and adaptation actions.
Through written responses, some respondents recognized how the design parameters of existing systems were not suited to manage current and future influent flows. For example, several respondents noted that decreasing flows are affecting how agencies plan for and design treatment processes. Historically, systems were designed around flow targets and capacity, but with conservation and population changes, flows and loads must be decoupled. This necessitates a whole new way of planning and designing future systems. Most systems are being retrofitted rather than designed from scratch.
Biological and chemical changes to wastewater within collection systems are likely a significant contributor to the reported wastewater management challenges. These are invisible and occur in advance of the treatment systems. System operations and regulatory requirements have led agencies to monitor and maintain operations at treatment facilities on a more frequent basis than in collection systems. Many survey respondents noted that, during the 2011–2016 drought, they increased flushing and system inspections in collection systems to manage failures such as blockages and odors. Yet, few respondents specifically noted how changes in collection system operations, notably increased residence time of wastewater from lower flows, drove changes in the composition of influent to treatment facilities. Respondents did not specify that mitigation and adaption actions for wastewater management should span coordinated actions for collection and treatment system management.
4. Discussion
Survey results indicate that mismatches in influent flow rates and design flow parameters are instigating operational challenges across collection, treatment, and reuse systems (). The results, however, are murky and highlight the importance of site-specific conditions. The authors evaluated correlations between survey results of reported challenges for a given system and potential explanatory variables such as design flow value, climate zone, pipe size, system age, geography, and level of treatment. However, these investigations had little success, and as such, are not reported here. Follow-up interviews provided more insight into why such correlations were hard to identify. Interview participants highlighted how site-specific factors of their collection and treatment systems are influential. For instance, the discharge characteristics of communities influence the level of flexibility that managers have when adapting to changes. Literature analysis and survey responses also noted the role of population changes over time, whereby systems with both decreasing populations and decreasing water use rates are at greatest operational risk. Given the complexity of these systems and lack of data, it is difficult to summarize statewide trends for the relative contribution of influent flow reductions on observed effects.
Managers noted concerns about the impacts of changing operating conditions on permit-based discharge requirements for their systems, but based on survey responses, over half do not have a clear understanding of when upgrades will be needed for their systems. This demonstrates how uncertainty in future conditions constrains opportunities to adapt. The source of this dichotomy is not clear, but likely stems in part from the difficulty in forecasting future detailed engineering requirements given quickly changing conditions. Wastewater systems are designed through detailed engineering studies that account for site-specific factors of flow and concentration. It may be difficult to forecast future operating conditions and designing facilities to function in a range of conditions can be more expensive. System operators respond to the need to meet current discharge requirements and may have limited time and resources to forecast future dynamic conditions.
Some managers reported that adaptation actions were underway (), but interviews noted that they were not sure if these were long-term needs or temporary actions. Results of the literature analysis, combined with responses from surveys and interviews, revealed the types of actions that can be taken to manage issues with reduced flow rates that are less than design flows. There are specific adaptation actions available for collection, treatment, and reuse systems. Tables S4 through S7 in the Supplemental Data section provide detailed lists of potential effects and remedial actions that can be taken for each type of system, which offers more context to the responses reported in of current actions.
The study is subject to several limitations. First, we relied on voluntary responses that yielded a relatively small sample. A representative sample of managers with an equal distribution of systems of varying sizes, locations, topography, and characteristics (i.e., level of treatment) was not sought. The voluntary survey approach could produce yield bias, as systems that have experienced impacts may be more likely to participate. Second, we did not ask all participants to extensively describe site-specific factors that may have contributed to challenges. Follow-up interviews were conducted with only a limited number of systems. This led to insufficient data being available to correlate responses with a comprehensive set of explanatory factors. Third, responses were subject to interpretations of ‘major’ and ‘minor’.
Another factor that may have affected the results is the presence of a severe drought in the time interval (2011–2021) we were asking system managers about. Several responses suggested that drought was to blame for lower flows in their wastewater collection and treatment systems. If managers were acting on an underlying assumption that drought is a limited-duration event (AghaKouchak, Feldman, Hoerling, et al., Citation2015; Dixon & Marie Pint, Citation1996), the actions that they take in their systems in response to low flows may be different than if they were assuming low flows were systemic and long-term trends. Drought might also have affected the problems observed. Decreased runoff and soil moisture during drought reduces infiltration and inflow in collection systems that are not fully intact (Pawlowski, Rhea, Shuster, et al., Citation2014; Surber, Kelly, & Enfinger, Citation2009). Also, in drought conditions, trees aggressively seek water, even in pipes (May, Livesley, & Shears, Citation2013). Root intrusion was identified as a problem by several respondents (). On the other hand, projections of California hydrology under the influence of climate change show more frequent and deep droughts (Pierce, Kalansky, & Cayan, Citation2018). This includes projected decreases in snowpack in the Sierra Nevada that will likely limit water supplies and continue to drive municipal water conservation (Diffenbaugh, Swain, & Touma, Citation2015; MacDonald, Citation2007; Swain, Baird Langenbrunner, Hall, et al., Citation2018). In that sense, the time period from 2011 to 2021 may reasonably represent future conditions (Sawyer, Hamamoto, Merlo, et al., Citation2016).
Overall, the study demonstrates a methodology for strengthening stakeholder participation and collaboration for adaptive pathways to resilient infrastructure. It brought knowledge from industry stakeholders into public policy decision-making through an engaged process. The results of this work informed empirical estimates with physically based models and actual input data.
5. Conclusions
The paper used a mixed methods approach with surveys and literature analysis to understand if managers of existing wastewater systems are experiencing impacts from lower per capita wastewater flows and what mitigation and adaptation actions are being pursued in California. Long-term urban water use data demonstrate a multi-decade decrease in consumption, which has been punctuated by periods of drought and persistent water savings. Assumptions of urban per capita demand in California used in wastewater planning have changed over time, from more than 100 gallons per capita per day (gpd) prior to 1980, to less than 50 gpd today.
The results presented in this article are limited by the number of survey responses. While surveys were sent to wastewater systems statewide, the survey results are skewed towards systems that had the staff capacity to respond. Future research would focus on achieving an even distribution of respondents across hydrological region, climate, and socio-economic status. This would allow a more in-depth analysis and improve the applicability of the research.
Many respondents reported tehat their collection systems or treatment facilities were experiencing effects attributable to lower influent flows that are below the design flows for their system. Most characterized effects as minor, but some key effects were more serious and widespread, such as: odors, mass loading/constituent concentrations, difficulty meeting discharge permit requirements, and insufficient production of recycled water. Respondents indicated significant uncertainty regarding links between influent flow reductions and capital investments. As a result, managers largely pursue incremental adaptation approaches, whereby they begin with small mitigation measures, which expand to more systematic actions and eventually capital investments as conditions persist or future conditions become clearer.
Results indicate that, in future decades, higher constituent concentrations in wastewater influent are very likely. Consequently, there is a need to update design guidance and operator expertise to manage influent with these characteristics. Examples include: anticipating future flows and hydraulic parameters like slope and scouring velocity in pipes; accounting for longer residence times; and increasing flexibility in treatment plant operations. Wastewater managers with systems in areas likely to experience drought and water scarcity face a complex set of operating challenges such as increased hydrologic variability, more stringent effluent standards and permit requirements, and tension between reuse and conservation.
Supplemental Material
Download MS Word (697.2 KB)Acknowledgments
This study benefited from the expertise of individuals throughout the state of California, including experts from the wastewater industry and research community. Survey respondents and interview respondents made contributions when free time within the water industry was seemingly in short supply during the global COVID-19 pandemic response of 2020–2021. Many thanks to the California Association of Sanitation Agencies (CASA), Southern California Alliance of Publicly-Owned Treatment Works (SCAP), Bay Area Clean Water Agencies (BACWA), Central Valley Clean Water Association (CVCWA), and the California Water Environmental Association (CWEA) for assistance in distributing and advertising the surveys and outreach. The views expressed in this paper are solely the authors.
Disclosure statement
No potential conflict of interest was reported by the authors.
Supplemental data
Supplemental data for this article can be accessed online at https://doi.org/10.1080/23789689.2023.2180251.
Additional information
Funding
Notes on contributors
Erik Porse
Erik Porse is the Director of the California Institute for Water Resources and an Associate Cooperative Extension Specialist in the University of California Division of Agriculture and Natural Resources.
Caitlyn Leo
Caitlyn Leo is a Research Engineer in the Office of Water Programs at California State University, Sacramento.
Erick Eschker
Erick Eschker is a Professor in the Department of Economics at California State Polytechnic University, Humboldt.
Harold Leverenz
Harold Leverenz conducts research on water treatment and reuse in the Department of Civil and Environmental Engineering at the University of California Davis and the Office of Water Programs at California State University, Sacramento.
Jonathan Kaplan
Jonathan Kaplan is a Professor in the Department of Economics at California State University, Sacramento.
John Johnston
John Johnston is a Professor Emeritus in the Department of Civil Engineering at California State University, Sacramento.
Dakota Keene
Dakota Keene is an Environmental Specialist in the Office of Water Programs at California State University, Sacramento.
David Babchanik
David Babchanik is a student in the Department of Civil Engineering at California State University, Sacramento.
References
- AghaKouchak, A., Feldman, D., Hoerling, M., Huxman, T., & Lund, J. (2015). Water and climate: Recognize anthropogenic drought. Nature, 524(7566), 409–411. https://doi.org/10.1038/524409a
- Aldrich, M. (1979). A history of public works in the United States, 1790-1970. Washington, D.C: US Department of Commerce, Economic Development Administration, Division of Economic Research.
- Ariamalar, S., & Tafuri, A. N. (2012). Rehabilitation of aging water infrastructure systems: Key challenges and Issues. Journal of Infrastructure Systems, 18(3), 202–209. https://doi.org/10.1061/(ASCE)IS.1943-555X.0000091
- Census. (2021). U.S. Census population eSTIMATES July 1, 2021 (V2021). U.S. Census Bureau.
- Chappelle, C., McCann, H., Jassby, D., Schwabe, K., & Szeptycki, L. (2019). Managing wastewater in a changing climate. Public Policy Institute of California.
- David, P. A. (1985). Clio and the economics of QWERTY. American Economic Review (Papers and Proceedings), 75(2), 332–337.
- DeOreo, W. B., Mayer, P. W., Dziegielewski, B., & Kiefer, J. (2016). Residential eNd uses of water, Version 2. Water Research Foundation.
- DeZellar, J. T., & Maier, W. J. (1980). Effects of water conservation on sanitary sewers and wastewater treatment plants. Journal (Water Pollution Control Federation), 52(1), 76–88.
- Diffenbaugh, N. S., Swain, D. L., & Touma, D. (2015). Anthropogenic warming has increased drought risk in California. Proceedings of the National Academy of Sciences, 112(13), 3931–3936. https://doi.org/10.1073/pnas.1422385112
- Diringer, S., Cooley, H., Heberger, M., Phurisamban, R., Donnelly, K., Turner, A., McKibbin, J., & Ann Dickinson, M. (2018). Integrating water efficiency into long-term demand forecasting. 4495. 4495.
- Dixon, L., & Marie Pint, E. (1996). Drought management policies and economic effects on Urban Areas of California: 1987-1992 (Vol. 813). RAND Corporation.
- DWR. (1998). Californiawater plan update bulletin 160-98. California Department of Water Resources.
- Grigg, N. S. (2019). Aging water infrastructure. In P. S. Juuti, H. Matilla, R. Rajala, K. Schwartz, & C. Staddon (Eds.), Resilient water services and systems: The foundation of well-being (pp. 31–45). IWA Publishing.
- Hughes, T. (1993). Networks of power : Electrification in Western society, 1880-1930. Johns Hopkins University Press.
- Jalali, S., & Wohlin, C. 2012. “Systematic literature studies: Database searches vs. Backward Snowballing.” P. 29 in Proceedings of the ACM-IEEE international symposium on Empirical software engineering and measurement - ESEM ’12. Lund, Sweden: ACM Press.
- Kiparsky, M., Sedlak, D. L., Thompson, B. H., & Truffer, B. (2013). The innovation deficit in Urban wATER: The nEED for an integrated perspective on institutions, organizations, and technology. Environmental Engineering Science, 30(8), 395–408. https://doi.org/10.1089/ees.2012.0427
- Koyasako. (1980). Effects of conservation on wastewater flow reduction: A Perspective. U.S. Environmental Protection Agency Municipal Environmental Research Laboratory. EPA-600/2-80-137.
- Lee, J., Nemati, M., & Dinar, A. (2021). Historical trends of residential water use in California: Effects of droughts and conservation policies. Applied Economic Perspectives and Policy Aepp, 44(1), 13149. https://doi.org/10.1002/aepp.13149
- Liebowitz, S. J., & Margolis, S. E. (1995). Path dependence, lock-in, and history. Journal of Law, Economics, & Organization, 11(1), 205–226. https://doi.org/10.2139/ssrn.1706450
- Lund, J., Medellin-Azuara, J., Durand, J., & Stone, K. (2018). Lessons from California’s 2012–2016 drought. Journal of Water Resources Planning and Management, 144(10), 04018067. https://doi.org/10.1061/(ASCE)WR.1943-5452.0000984
- MacDonald, G. M. (2007). Severe and sustained drought in Southern California and the West: Present conditions and insights from the past on causes and impacts. Quaternary International, 173–174, 87–100. https://doi.org/10.1016/j.quaint.2007.03.012
- May, P. B., Livesley, S. J., & Shears, I. (2013). Managing and monitoring tree health and soil water status during extreme drought in Melbourne, Victoria. Arboriculture & Urban Forestry, 39(3), 136–145. https://doi.org/10.48044/jauf.2013.019
- Mitchell, D., Hanak, E., Baerenklau, K., Escriva-Bou, A., McCann, H., Perez-Urdiales, M., & Schwabe, K. (2017). Building drought resilience in California’s cities and suburbs. Public Policy Institute of California.
- OWP at Sacramento State. (2022). Environmental and economic effects of water conservation regulations in California: Evaluating effects of Urban water use efficiency standards (AB 1668-SB 606) on urban retail water suppliers, wastewater management agencies, and Urban Landscapes (Trees and Urban Parklands). Prepared by the Office of Water Programs at Sacramento State, the University of California.
- Pawlowski, C. W., Rhea, L., Shuster, W. D., & Barden, G. (2014). Some factors affecting inflow and infiltration from residential sources in a core Urban Area: Case study in a Columbus, Ohio, Neighborhood. Journal of Hydraulic Engineering, 140(1), 105–114. https://doi.org/10.1061/(ASCE)HY.1943-7900.0000799
- Pearse, L. (1938). Modern Sewage Disposal. Water Pollution Control Federation.
- Pierce, D. W., Kalansky, J. F., & Cayan, D. R. (2018). Climate, drought, and sea level rise scenarios for California’s fourth climate change assessment. California Energy Commission. CCCA4-CEC-2018–006.
- Qureshi, N., & Shah, J. (2014). Aging infrastructure and decreasing demand: A dilemma for water utilities. Journal - American Water Works Association, 106(1), 51–61. https://doi.org/10.5942/jawwa.2014.106.0013
- Ramseur, J. L. (2018). Wastewater infrastructure: Overview, funding, and legislative developments. Congressional Research Service.
- Sawyer, L. K., Hamamoto, M., Merlo, R., Henneman, S., & Arroyo, L. (2016). Planning for future droughts – Lessons learned at water resource recovery facilities. Proceedings of the Water Environment Federation, 2016(10), 4737–4751. https://doi.org/10.2175/193864716819707300
- Schwabe, K., Nemati, M., Amin, R., Tran, Q., & Jassby, D. (2020). Unintended consequences of water conservation on the use of treated municipal wastewater. Nature Sustainability, 3(8), 628–635. https://doi.org/10.1038/s41893-020-0529-2
- Surber, M., Kelly, A., & Enfinger, K. (2009). Flow monitoring. … in a drought? Leveraging drought conditions to target infiltration in sewer systems. Proceedings of the Water Environment Federation, 2009(16), 1423–1430. https://doi.org/10.2175/193864709793956699
- Swain, D. L., Baird Langenbrunner, J. D. N., Hall, A., & Hall, A. (2018). Increasing precipitation volatility in twenty-first-century California. Nature Climate Change, 8(5), 427–433. https://doi.org/10.1038/s41558-018-0140-y
- Tarr, J. (1984). The evolution of the Urban infrastructure in the nineteenth and twentieth centuries. In HansonR (Ed.), Perspectives on Urban infrastructure, committee on national Urban policy, national research council (pp. 4–66). National Academies Press.
- Tran, Q. K., Jassby, D., & Schwabe, K. A. (2017). The implications of drought and water conservation on the reuse of municipal wastewater: Recognizing impacts and identifying mitigation possibilities. Water Research, 124, 472–481. https://doi.org/10.1016/j.watres.2017.07.069
- USEPA. 2012. Clean watersheds needs survey 2012 report to congress. U.S. Environmental Protection Agency.
- Wohlin, C. 2014. “Guidelines for Snowballing in systematic literature studies and a replication in software engineering.” Pp. 1–10 in Proceedings of the 18th International Conference on Evaluation and Assessment in Software Engineering - EASE ’14. London, England, United Kingdom: ACM Press.