
ABSTRACT
Built infrastructure systems must be resilient to disasters. After a disaster, its functionality has to evolve with significant uncertainties to restore pre-event condition. Innovative infrastructure design and management pathways can aid in sequencing possible pre- and post-disaster actions, incorporating flexibility into planning and decision-making to enhance resilience. Adoption of disaster risk reduction policies can benefit from accurate, comprehensive, and systematic probabilistic risk and resilience assessments. Such assessments, though not widely prevalent, help to understand the root causes of vulnerabilities and quantify their uncertainties. Therefore, they are prerequisites to identify and implement adaptation pathways for enhancing infrastructure resilience. To support identification and implementation of pathways approach, this study presents seismic resilience assessment incorporating functionality loss and pathways for subsequent recovery. An archetypical reinforced-concrete building, representing typical behavior of the building group used for critical functions, is considered under pre- and post-disaster preparedness, planning, and risk reduction options to develop deeper understanding of risks and selection of pathways. Resilience assessments are conducted based on performance-based earthquake engineering approach and considering uncertainties through Monte Carlo simulations. Both engineering and management interventions, such as improving non-structural component performance, eliminating post-disaster impedances, reducing repair delays, other management activities, and their combinations, are simulated under a common framework. The study quantifies how these measures can reduce losses, improve response, and enhance infrastructure resilience. Options for technical and management decision-making by various stakeholders to enhance resilience are also presented. The study advocates embracing the resiliency mindset and illustrates the benefits of multiple stakeholders for risk-informed decision-making.
1. Introduction
1.1. Engineering resilience
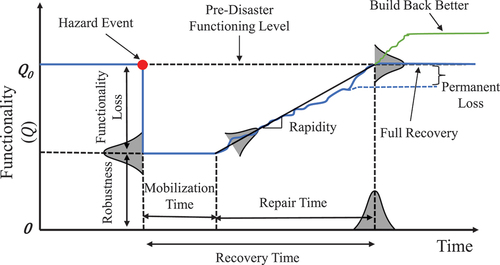
Disasters such as large earthquakes can set back decades of progress and investment in an instant. Usually, these events have a massive impact on the people, the built infrastructure, and the social system at large. Such disasters lead to various consequences, including financial losses, facility downtime, individual and business displacement, and disruption of the regular functioning of society (Chang, Taylor, Elwood, et al., Citation2019; Comerio, Citation2006). Disaster-induced damage necessitates post-event recovery, and the affected systems adapt themselves to restore functionality. An important aim of disaster risk reduction is to manage risks so that communities are least impacted. Resilience holds the key to overcoming excessive losses, dealing with future challenges and managing uncertainties. Engineering resilience seeks to reduce disaster losses to the built infrastructure by increasing its capacity to withstand them, maintain desired functionality levels, recover swiftly with minimal disruption, and adapt to uncertain future events (Bruneau, Chang, Eguchi, et al., Citation2003; Kurth, Keenan, Sasani, et al., Citation2019). System performance has to evolve dynamically over time with significant uncertainties during the post-disaster phase. A functionality curve shown in illustrates this evolution before, during, and after an earthquake. The bell-shaped curves around the solid line represent the probabilistic nature and uncertainties encountered at each stage in the system performance. Uncertainty can be reduced using emerging and disruptive digital technologies to enhance resilience through efficient and reliable decision-making (Argyroudis, Mitoulis, Chatzi, et al., Citation2022). The concept of functionality curve also applies to slow-onset disasters, such as floods and sea-level rise, where the loss of functionality may not be immediate. The figure also depicts the path for recovery to the pre-disaster functionality level. It shows the time to mobilize the resources and complete other processes needed to start repair works as well as the time to carry out actual repair activities. In some instances, the system may fail to regain its full functionality and sustain some permanent functionality loss. It is also possible to improve the performance to higher than the pre-event level (build back better) through post-disaster strategies to improve system capacity and reduce risk against future disasters.
Figure 1. Variation of system functionality before, during and after a disaster (Joo & Sinha, Citation2022b).
The concept of resilience provides avenues for investigating solutions to various important concerns in infrastructure industries (ADB, Citation2022; Kurth, Keenan, Sasani, et al., Citation2019; Sikula, Mancillas, Linkov, et al., Citation2015; UNDRR, Citation2022b). The Hyogo Framework for Action (UNDRR, Citation2005) aimed to significantly reduce disaster losses in terms of lives and economic, social, and environmental assets. The United Nations endorsed the Sendai Framework for Disaster Risk Reduction 2015–2030, which identified resilience investment as one of the four priorities for action and a significant reduction in damage to critical infrastructure and service disruption as one of the seven targets (UNDRR, Citation2015).
Arup (Almufti & Willford, Citation2013) developed a resilience-based earthquake design initiative rating system for buildings, which provides stakeholders with a design, planning, and assessment approach to meet higher performance targets. The 100 Resilient Cities initiative (The Rockefeller Foundation, Citation2013) helped cities to develop resilience to physical, economic, and social challenges due to disasters. The U.S. National Disaster Recovery Framework (FEMA, Citation2016) provides guidance for recovery support to disaster-impacted regions in the U.S.A. The Coalition for Disaster Resilient Infrastructure (CDRI, Citation2019) promotes disaster-resilient infrastructure, shares research and knowledge in different fields, and supports long-term sustainable development. Recommendations and options to improve the critical infrastructure and built environment considering post-earthquake reoccupancy and functional recovery performance targets were also proposed (FEMA, Citation2021). A recent study (ADB, Citation2022) recognized infrastructure as central to support overall community resilience and identified cross-cutting themes for infrastructure resilience enhancement and opportunities across Asia and the Pacific. The United Nations Office for Disaster Risk Reduction (UNDRR) has recently recommended increasing resilience and reducing risk (UNDRR, Citation2022c) and also proposed principles for resilient infrastructure (UNDRR, Citation2022b).
1.2. Adaptive pathways
Adaptation, a critical attribute of a resilient system in the face of uncertainty, is defined as the evolution of the system to become more resistant to and recoverable from future disasters (Kurth, Keenan, Sasani, et al., Citation2019). Adaptive pathways are a decision-focused analytical approach to explore and sequence actions to reduce future risks, explicitly incorporating flexibility into planning and decision-making, and accounting for future uncertainties (Haasnoot, Kwakkel, Walker, et al., Citation2013). Pathways are also recognized as processes to overcome future challenges; they are broad directions of change to meet various strategic goals and are a series of actions for progressive implementation (Werners, Wise, Butler, et al., Citation2021; Wise, Fazey, Stafford Smith, et al., Citation2014). An important idea behind pathways is that the decisions and measures are ordered in sequence to achieve future targets. Disaster-resilient development pathways are described as development trajectories combining adaptation and disaster risk reduction as well as constantly evolving processes to manage changes to accomplish sustainable development goals (IPCC, Citation2014). Adaptive pathways can be used to recover after a disaster and reduce the risk of future disasters. They represent a transition from traditional approach of estimating impacts and specifying mitigation options to adopting dynamic decision processes and management (Werners, Wise, Butler, et al., Citation2021). Pathways help to develop an adaptively robust strategy, adopt strategic planning, use risk assessments for action planning, and recognize potential maladaptive actions more readily (Bosomworth, Harwood, Leith, et al., Citation2015). Applying adaptation pathways results in higher economic efficiency than individual strategies (de Ruig, Barnard, Botzen, et al., Citation2019). Pathways are an opportunity for decision-makers to account for various options and future uncertainties (ADB, Citation2022).
Adaptive pathways are receiving increased attention for infrastructure planning, considering multiple possible future scenarios and incorporating the robustness and flexibility of alternatives in decision-making contexts. Several studies (de Ruig, Barnard, Botzen, et al., Citation2019; Djalante, Holley, Thomalla, et al., Citation2013; Fazey, Wise, Lyon, et al., Citation2016; Haasnoot, Kwakkel, Walker, et al., Citation2013; Joo & Sinha, Citation2022a; Kwakkel, Haasnoot, & Walker, Citation2016; Werners, Wise, Butler, et al., Citation2021; Wise, Fazey, Stafford Smith, et al., Citation2014) discuss adaptive pathways to reduce future risks. Djalante, Holley, Thomalla, et al. (Citation2013) proposed a framework and identified various elements for adaptive and integrated disaster resilience of nations and communities. Haasnoot, Kwakkel, Walker, et al. (Citation2013) used the concept of adaptative pathways to guide planners for decision-making and future actions under uncertain changes. Fazey, Wise, Lyon, et al. (Citation2016) used pathways to provide insights and understanding of past changes and adaptation of various communities to improve future-oriented approaches. Based on a river case study, Kwakkel, Haasnoot, and Walker (Citation2016) observed that adaptation pathways and decision-making are complementary, where pathways present a natural approach to deal with vulnerabilities identified through robust decision-making. de Ruig, Barnard, Botzen, et al. (Citation2019) coupled cost-benefit analysis with pathways to economically evaluate and compare different methods of flood adaptation measures for a coastal megacity. Wise, Fazey, Stafford Smith, et al. (Citation2014) emphasized the need to broaden the perspective and application of adaptation pathways in the context of climate change to consider situations with ambiguous goals and path dependencies.
1.3. Resilience assessment and adaptive pathways implementation
Infrastructure forms the backbone of the economy and the functionality of the built environment is essential after a disaster. Resilient infrastructure aims to adapt and transform to changing conditions (UNDRR, Citation2022b). Infrastructure resilience requires adaptively addressing functionality and recovery to reduce the risk of physical, financial, and social damage. Disasters compromise an infrastructure’s structure and functionality and are therefore closely tied with recovery and adaptation to maintain functionality. UNDRR (Citation2022c) recognizes the importance of understanding the root causes of vulnerabilities and their impacts as a fundamental requirement to achieve sustainable development. Disaster risk and impact assessments are essential for identifying system vulnerabilities and the opportunities for adaptation to future disasters (ADB, Citation2022; Djalante, Holley, Thomalla, et al., Citation2013; Joakim, Mortsch, & Oulahen, Citation2015; Joo & Sinha, Citation2022a; UNDRR, Citation2022b, Citation2022c). A comprehensive and systematic assessment of hazard, risk, vulnerability, and impacts is required to develop pathways for adaptive and integrated disaster resilience (Djalante, Holley, Thomalla, et al., Citation2013). Improving risk information serves as the base for pathways implementation and has been identified as a cross-cutting theme for disaster-resilient infrastructure (ADB, Citation2022). The use of standardized, replicable approaches to making decision-relevant risk assessments is promoted as an opportunity for overcoming the barrier of insufficient quantitative analysis of infrastructure (ADB, Citation2022). Therefore, detailed risk assessments and preparedness plans are critical steps in adaptive planning for successful achievement of resilience objectives.
However, conventional risk assessment frameworks (ASCE, Citation2017; FEMA, Citation2009) are based on a narrow and simplified risk perspective without incorporating recovery and future adaptation. For example, the current building codes, with a singular focus on life safety, do not consider post-disaster recovery, which is essential for Resilience. Uncertain conditions necessitate more adaptive planning, so as to allow flexibility in decision-making over the life of the infrastructure. It is also important to recognize that today’s adaptation options and trajectories depend on past choices and decisions (Tellman, Bausch, Eakin, et al., Citation2018). A recent study (ADB, Citation2022) identified understanding and accounting for the benefits of resilience and improving risk information and coordination among decision makers as the cross-cutting themes for enhancing resilience. Combining engineering and socio-ecological resilience principles helps to identify, assess and manage vulnerabilities and improve risk assessment and management abilities of any system (Sikula, Mancillas, Linkov, et al., Citation2015). Thus, resilience assessments are crucial and fundamental in developing plans and practices to reduce future losses (Joo & Sinha, Citation2022a) and support the principles for resilient infrastructure (UNDRR, Citation2022b). Therefore, consideration of post-disaster parameters through recovery and resilience assessments is a fundamental requirement for successful identification and implementation of adaptative pathways.
1.4. Research significance, approach, and applications
The literature on adaptive pathways has been extensively studied in the context of climate change and related hazards such as sea-level rise and water management, policymaking and planning, etc. (Bosomworth, Harwood, Leith, et al., Citation2015; de Ruig, Barnard, Botzen, et al., Citation2019; Haasnoot, Kwakkel, Walker, et al., Citation2013; Kwakkel, Haasnoot, & Walker, Citation2016; Tellman, Bausch, Eakin, et al., Citation2018; Werners, Wise, Butler, et al., Citation2021; Wise, Fazey, Stafford Smith, et al., Citation2014). Such studies are not directly applicable to disasters, such as earthquakes and fields, such as structural engineering. The traditional structural engineering approach involves interactions of architects, engineers, and contractors with a focus on safety, functionality and cost. The structural design process is generally linear from architects to engineers to contractors with only limited collaboration or iterative revisions among them. This process thus inhibits the use of adaptive pathways, which requires iterative involvement of multiple stakeholders for decision-making. The active involvement of other stakeholders, such as investors and policymakers, is also not prevalent in the design process. Current design and assessment standards, which are focused on infrastructure performance immediately after an earthquake, are therefore unable to consider important attributes of resilient infrastructures such as post-event parameters or involve all stakeholders.
In this study, the concept of adaptive pathways has been extended and quantitatively applied to improve recovery-based resilience of critical infrastructure against earthquakes. The implementation of pathways has been illustrated for an archetypical reinforced concrete (RC) building, representing the behavior of all buildings with similar characteristics. The selected building is a representation of those used for important governance functions. The present study demonstrates that resilience assessment, considering recovery and adaptation parameters, is a primary requirement for identifying adaptive pathways and providing insights into the future consequences of our choices. This is the first-ever study of seismic resilience using adaptive pathways considering the roles of all stakeholders. The study quantitatively evaluates various pre- and post-disaster strategies and controlling measures from seismic resilience and functional recovery perspectives to substantially reduce financial losses and downtime. Under a common framework, this study investigates various engineering and management measures and decisions to enhance recovery performance and resilience. The study demonstrates the options available before and after an earthquake till complete recovery and therefore links the present situation with future pathways for more resilient infrastructure. This paper further demonstrates the role of multi-disciplinary considerations in infrastructure decision-making. It shows how the pre-disaster planning and preparedness approaches, together with efficient post-disaster management and decisions, can help to enhance infrastructure resilience and strengthen the mechanism for system adaptation. The study also highlights the advantages of engaging multiple stakeholders to exchange information, make risk-informed decisions, conduct more pre-planning, and develop well-coordinated prioritization plans.
In accordance with the state-of-the-art performance-based earthquake engineering (PBEE) frameworks, seismic resilience assessments of the archetypical building under different scenarios of pre- and post-disaster measures were carried out to identify the root causes of future risks and the opportunities to address them efficiently with minimal social disruption. Performance was assessed and compared using a range of resilience metrics, including probability of collapse, likelihood of red (unsafe) tags, and scenario losses, which are indicators of system robustness. Other metrics like time required for repair, reoccupancy, functional recovery and full recovery, representing the rapidity of the recovery process in the post-disaster phase (see ), were also employed. The effects of various non-structural performance improvements, post-disaster delays, and the approaches to mitigate such delays were explored and quantified.
UNDRR (Citation2022a) classifies stakeholders into different categories based on their role and intervention in operationalizing infrastructure resilience. Stakeholders such as designers, engineers, and contractors can implement the engineering-oriented strategies into designs and decision-making to enhance infrastructure resilience. The results illustrating benefits of different pathways, quantified in terms of reduction in repair costs and recovery time, can motivate other stakeholders, such as investors, owners, and policymakers, about the risk and return of various available options. This can also be helpful in efficient decision-making for enhancing infrastructure resilience. The findings are also useful for governments at different levels and institutions that help them in policy, decision-making, regulations, etc. and support the long-term agenda for resilient infrastructure. The results encourage embracing the resiliency mindset while designing new and retrofitting existing infrastructure. This study has wide relevance to academics and practitioners who focus on navigating existing and future challenges of built infrastructure in the face of disasters. By exploring various pathways and analytically assessing their consequences, the findings will also be helpful to design an adaptive plan for infrastructure decision-making, including a mix of pre- and post-disaster measures and short- and long-term actions, options, and policies.
2. Building selection, structural modeling, and hazard estimation
As in the current study, the role and effects of various options for resilience enhancement can be readily understood if performance is illustrated in terms of resilience-based metrics such as financial losses and downtime. Two different levels of earthquake scenarios; the design-level and the more intense and rare safety-level are considered in this study as per typical specifications in design standards. The following subsections provide details about the selection of building and its components, structural modeling approach, and the selection and scaling of earthquake ground motions.
2.1. Archetypical building and its components
An archetypical building satisfying Indian design (IS 456, Citation2000; IS 1893, Citation2002) and ductile detailing (IS 13920, Citation1993) standards was selected from a previous study (Badal & Sinha, Citation2019). Based on the review of different existing buildings in the region and expert opinion, a 7-story RC frame (ID-2215) was designed for New Delhi, India (Seismic Zone IV) to represent a typical commercial building, such as the ones used for critical governance functions. shows the plan view of the building with columns and beams in both directions. Detailed information about the geometric and material characteristics and design and detailing of the members can be referred from Badal and Sinha (Citation2019). The building consists of RC frames as structural system and other typical non-structural components listed in and . Non-structural elements were assumed to be designed and installed without seismic design considerations, as per typical existing industry practices.
Figure 2. Plan view of an archetypical reinforced concrete frame building (ID-2215) (Badal, Citation2020).
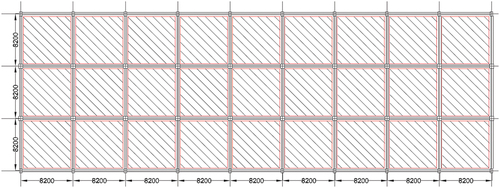
Basic information about the building required for structural design and assessment includes floor areas, story heights, and floor occupancies. The building has a bay-width of 8.2 m in both directions, a first story height of 4.5 m, and a typical regular story height of 3.9 m. The floor area of 1815.48 m2 is constant across all the levels. The additional information required for performance and recovery assessment includes replacement cost and replacement time. The building replacement cost, used for estimating direct economic losses in the case of collapse or irreparable damage (see ), was estimated based on the building footprint area (Ghasemof, Mirtaheri, & Karami Mohammadi, Citation2022). A building replacement time of 910 days (about 2.5 years) was used in the study to represent the recovery time in case of collapse or irreparable damage, as shown in .
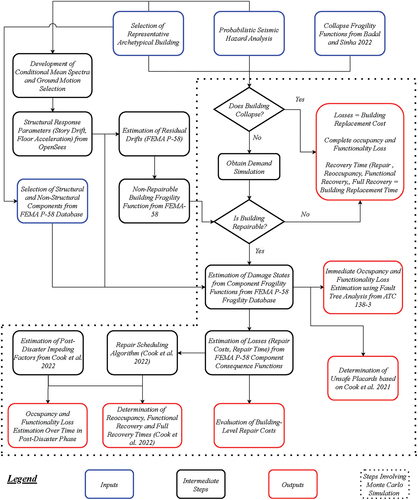
Figure 3. Illustration of performance and recovery assessment methodology.
Fragility functions were used to evaluate the damage states experienced by each component during the shaking. The component fragilities of the RC structural members were obtained from FEMA P-58 fragility database (FEMA P-58-3, Citation2018), wherein the members with the closest match of properties were selected. This study also considered the contribution of non-structural components to the overall economic losses and downtime. Based on a review of the inventory of structural and architectural drawings of several existing buildings in India, literature survey (FEMA P-58-5, Citation2018; Del Gobbo, Williams, & Blakeborough, Citation2018; Du, Bai, Bai, et al., Citation2021; Ghasemof, Mirtaheri, & Karami Mohammadi, Citation2022; Judd & Pakwan, Citation2018) and recommendations from the normative quantity estimation (NQE) tool (FEMA P-58-3, Citation2018), the buildings are assumed to contain certain typical non-structural components. The component fragilities, together with their respective units, lognormal median and dispersion in quantities, and response parameters, for both structural and non-structural components are presented in Appendices A to C. Further details about each component, including different damage states, fragility parameters, and consequence functions, can be found in FEMA P-58-2 (Citation2018), NQE tool, and PACT (FEMA P-58-3, Citation2018). The damage fragility curve of a member or component used in the study depends on story drift ratio or peak floor acceleration as listed in Appendices A to C.
2.2. Structural modeling
A two-dimensional structural model employing a concentrated plasticity approach was developed in OpenSees (McKenna, Fenves, & Scott, Citation2000) to simulate the nonlinear behavior of RC frames. Destabilizing P-Delta effects were incorporated via a PDelta nonlinear geometric transformation of the members and a leaning column frame. Considering the capacity-based shear design, nonlinearity of beams and columns was captured using flexural hinges at the end (Badal & Sinha, Citation2022; Ghasemof, Mirtaheri, & Karami Mohammadi, Citation2022; Haselton, Liel, Deierlein, et al., Citation2011). The moment-rotation behavior of the rotational springs was represented utilizing the modified Ibarra-Medina-Krawinkler model, simulating stiffness and strength degrading hysteretic behaviour in a highly nonlinear range (Ibarra, Medina, & Krawinkler, Citation2005). The key points and cyclic deterioration parameters to define the backbone curve were derived using semi-empirical relationships (Haselton, Liel, Taylor Lange, et al., Citation2016; Panagiotakos & Fardis, Citation2001). Secant stiffness to 40% of yield moment was used as initial stiffness. This approach of modeling axial-force and in-plane bending was found to be sufficient to simulate the nonlinear behavior of moment-resisting frames and adopted in the past studies (Badal & Sinha, Citation2022; Badal, Citation2020; Haselton, Liel, Deierlein, et al., Citation2011; Joo, Badal, & Sinha, Citation2022). Rayleigh damping of 5% in the first and third modes was adopted and applied only to elastic beam-column elements as the utilized backbone curve for the springs already considers energy dissipation in the post-yield behavior (Badal & Sinha, Citation2022; Badal, Citation2020; Joo, Badal, & Sinha, Citation2022; Terzic, Villanueva, Saldana, et al., Citation2021). The effects of longitudinal reinforcement bond-slip behavior, finite beam-column joints, and foundation flexibility were also considered (Joo, Badal, & Sinha, Citation2022). The detailed modelling approach and its validation against the experimental results are available from published studies (Joo, Citation2022; Joo, Badal, & Sinha, Citation2022).
2.3. Ground motion selection and scaling
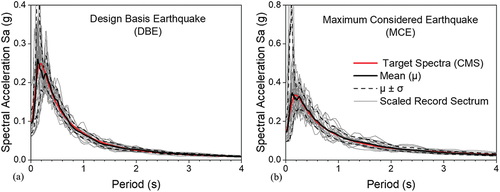
Estimation of seismic hazards for the selected site in New Delhi, India (28.61°N, 77.21°E) was based on probabilistic seismic hazard analysis results (Raghukanth, Citation2020). As per prevalent design standards in most countries, the building designs are required to consider two levels of earthquake ground shaking. One level, typically known as Design Basis Earthquake (DBE), is a relatively less rare earthquake level, and the buildings are expected to be repairable against this earthquake level. The second level, typically known as Maximum Considered Earthquake (MCE), is a rarer earthquake, and buildings are expected not to collapse and cause large-scale casualties against this earthquake level. The DBE level typically corresponds to an earthquake that repeats once every 475 years, while the MCE level typically corresponds to an earthquake that repeats once every 2475 years. In terms of the probability of occurrence, the DBE level corresponds to 10% probability of exceedance (POE) in 50 years, and the MCE level corresponds to 2% POE in 50 years. The ground motions used to represent DBE and MCE hazard levels were selected based on FEMA P-58 (Citation2018) recommendations. The conditional mean spectra corresponding to the above two intensity levels for the archetypical building were developed at its analytical fundamental period (T1) of 2.55 s (Baker, Citation2011) and used as target spectra. Twenty pairs of recorded earthquake ground motions were selected and scaled at each hazard level from the PEER NGA-West2 database tool (PEER, Citation2013), to match the arithmetic logarithmic mean of the ground motion suite with the target spectrum as shown in . The selection was based on the minimum mean squared error between the target spectrum and the scaled ground motion spectrum over the period range of 0.2T1 to 2T1 (FEMA P-58-1, Citation2018; Del Gobbo, Williams, & Blakeborough, Citation2018). Further details about the selection and scaling parameters are available in Joo, Badal, and Sinha (Citation2022).
Figure 4. Ground motion selection for (a) Design basis earthquake (DBE) and (b) Maximum considered earthquake (MCE) against corresponding conditional mean spectra (CMS).
3. Loss and recovery assessment methodology
The PBEE framework intends to quantify and communicate building performance using various metrics of interest for better design and retrofitting decision-making (FEMA P-58-1, Citation2018; Günay & Mosalam, Citation2013). This study utilized PBEE architecture to conduct performance assessments of an archetypical building, considering occupancy for typical office structural and non-structural components. The damage assessment and component-level repair costs and repair time estimation was carried out per FEMA P-58 (Citation2018) approach. Furthermore, functional losses and subsequent recovery assessment were carried out following ATC 138-3 (Citation2021) methodology based on a study (Cook, Liel, Haselton, et al., Citation2022). The various steps followed in the procedure are explained using the flowchart in . It should be noted that each step of the resilience assessment has uncertainties, and a sufficiently large number of simulations (5000) were carried out for each model and intensity level. It may be noted that the computational effort can be reduced by using emerging digital technologies (Argyroudis, Mitoulis, Chatzi, et al., Citation2022). Details of structural analysis carried out, damage and loss estimation approach, and functionality loss and recovery assessment procedure are provided in the following subsections.
3.1. Structural analysis
The performance, immediate losses, and post-event functioning of a building are governed by its response during the earthquake. Nonlinear response history analyses of the RC archetypical building frames were conducted in both horizantal directions using the validated analytical model in OpenSees (see subsection 2.2) to obtain the engineering demand parameters (EDPs). The EDPs serve as input for component damage evaluation using loss fragility functions (see ). The damage experienced by different structural and non-structural components depends on EDPs, such as storey drift and floor acceleration (see Appendices A to C). The feasibility of repairability depends on the residual drift. Therefore, structural responses in terms of story drifts for each story and floor accelerations at each floor as EDPs were evaluated for all ground motions at each intensity level. Residual story drifts were obtained from peak transient interstory drifts and yield drifts in accordance with FEMA P-58 (Citation2018) recommendations. Various realizations for Monte Carlo simulations were obtained using inferred statistical distribution of structural responses obtained from limited suite of dynamic analyses to incorporate uncertainties in damage states, repair costs, impeding time, and repair time (Cook, Liel, Haselton, et al., Citation2022; FEMA P-58-1, Citation2018 Joo, Badal, & Sinha, Citation2022; Molina Hutt, Vahanvaty, & Kourehpaz, Citation2022; Terzic, Villanueva, Saldana, et al., Citation2021). The building’s non-repairability, necessitating demolition, and reconstruction, was inferred from non-repairable fragility function (FEMA P-58-1, Citation2018; Joo, Badal, & Sinha, Citation2022; Terzic, Villanueva, Saldana, et al., Citation2021), as shown in .
3.2. Damage level, repair cost and repair time assessment
In this study, the damage states and consequent repair costs and repair time of various building components were assessed in accordance with FEMA P-58 (Citation2018) methodology, as depicted in . Because many factors, such as ground motion intensity, building construction quality, structural response, component vulnerability, etc., affect seismic performance, there is significant uncertainty in the predicted performance. This study incorporated these uncertainties using Monte Carlo simulations with 5,000 realizations for each model and intensity level, where each realization represents a possible performance outcome. Hazards are defined using a suite of ground motions (see subsection 2.3) and intensity-based assessments are conducted considering the building collapse potential and non-repairability (see ).
Building collapse fragility functions obtained using incremental dynamic analyses are taken from a previous study (Badal & Sinha, Citation2022). Component fragility functions from FEMA P-58 database (FEMA P-58-3, Citation2018) relate the EDPs to damage states. The damage results are converted into loss values (repair costs and repair time) using probabilistic consequence functions defined for each component damage state (FEMA P-58-1, Citation2018; FEMA P-58-3, Citation2018). Member-level loss estimation was then aggregated to building-level (see ). For each realization, the building is first examined for collapse. If the building is found not to collapse, its response is further evaluated for repairability based on the residual drift ratio and building irreparability fragility curve. The damage states and consequences for a repairable building are evaluated for each performance group following the methodology shown in .
The building may be found to be unsafe due to global failures like collapse or excessive residual drift. Such realizations are assigned an unsafe placard (or red tag). Even if a building is not unsafe, its stability may be compromised, resulting in a risk to life safety, thereby triggering an unsafe placard (or red tag). Significant damage to certain non-structural components like exterior cladding, ceilings, partitions, parapets, etc., that compromise life safety can also result in red tags. In this study, the likelihood of unsafe placards was estimated following the virtual inspection process (Cook, Liel, DeBock, et al., Citation2021). Buildings with unsafe placards take significantly longer to reoccupy and restore functionality following an earthquake and thus decrease resilience.
3.3. Functionality loss and recovery assessment
Building reoccupancy corresponds to a post-disaster performance state, indicating that the facility is safe and habitable. Functional recovery represents the post-disaster state in which the building is usable for its primary intended functions. On the other hand, full recovery marks the completion of required repair activities to restore pre-earthquake conditions, including those not required for reoccupancy or functional recovery. The damage assessment results of each component were utilized to evaluate the building’s functionality immediately following an earthquake and until it was fully recovered in accordance with the post-earthquake functional recovery framework (Cook, Liel, Haselton, et al., Citation2022). Various impeding factors, construction constraints, worker allocations, repair priorities, and optimization were also considered. The damage experienced by components was utilized to assess system-level operational performance and then to building-level performance states. The framework used a series of fault tree branches to correlate component damage to system operation and building function. The probabilistic reoccupancy, functional recovery, and full recovery time were also evaluated.
Each building was checked for building safety, story access, and user safety in three stages before a building was categorized as occupiable. Further, its functionality was checked in stage 4 based on user and occupancy-specific functionality requirements (Cook, Liel, Haselton, et al., Citation2022). Various impeding factors delaying the initiation of repair activities for a damaged building were considered. The longest sequence of delays governs the interval after the earthquake before repairs can start. The repair schedule was assessed to estimate the duration for repair of damaged components and restoration of the building’s function. It considered the sequence and work allocation for each building component instead of only those components that affect its functionality. The steps are shown in . The detailed procedure, including the fault trees to access the functionality of subsystems, repair scheduling algorithm prioritizing function restoration, and impeding factors delaying the start of repair works are available in the literature (ATC 138-3, Citation2021; Cook, Liel, Haselton, et al., Citation2022). The FEMA P-58 and ATC-138-3 (Beta) methodologies, implemented in SP3 (Citation2022) software, were used in the current study.
4. Pathways for resilient infrastructure
In this study, the seismic resilience assessment of the archetypical building was used to identify different pathways for improving infrastructure resilience. Various performance metrics, quantifying global consequences (collapse, red tag, irreparability), scenario losses, and recovery time, were evaluated to assess the efficacy of current design standards from a seismic resilience perspective. Resilience of a system can be improved by adopting different pathways, such as enhancing system robustness (by improving structural and non-structural performances), controlling various impeding factors, reducing delays to start repair-works, efficient post-disaster planning and management activities, etc. In accordance with the requirements of adaptive pathways, this study focuses on different pre- and post-disaster strategic options that can limit the losses over short- and long-term horizons and improve reoccupancy and functionality after the earthquake. The following subsections describe the various pathways considered to enhance infrastructure resilience and their impacts on various performance measures are presented in subsection 5.2.
4.1. Improvement of non-structural seismic performance
The damage experienced by non-structural components has a significant contribution to seismic losses and downtime for a facility (Del Gobbo, Williams, & Blakeborough, Citation2018; FEMA P-58-5, Citation2018; Joo, Badal, & Sinha, Citation2022; Molina Hutt, Almufti, Willford, et al., Citation2016; Molina Hutt, Hulsey, Kakoty, et al., Citation2022; Molina Hutt, Vahanvaty, & Kourehpaz, Citation2022; Terzic & Kolozvari, Citation2022). Therefore, non-structural elements in the baseline model (model ‘a’) described above were replaced by elements with better and improved seismic performance characteristics (model ‘b’), listed in . The details of modifications in non-structural components that were made to improve seismic performance of the building are: (i) Exterior brick cladding with high damage potential was replaced by seismically designed pre-cast concrete panels, (ii) seismically rated raised floors and pendant lights were used, (iii) the stairs were provided with seismic joints and fire sprinklers were installed with braced horizontal mains, and (iv) heating, ventilation, and air conditioning (HVAC) exhaust system and electrical equipment were seismically anchored. The component fragilities with corresponding lognormal median and dispersion in quantities, location, and corresponding response parameters are presented in Appendices A and C. The effect of improving non-structural performance was assessed to estimate their contribution to system robustness in terms of lesser damage and, therefore, lower losses and downtime. The results are presented in subsubsection 5.2.1.
4.2. Elimination of post-disaster Delays
The post-disaster period is critical for reducing vulnerabilities and building back (). In addition to seismic damage, indirect and external factors significantly impact the functional recovery of a building (Cook, Liel, Haselton, et al., Citation2022; Joo & Sinha, Citation2022a; Molina Hutt, Hulsey, Kakoty, et al., Citation2022; Molina Hutt, Vahanvaty, & Kourehpaz, Citation2022; Terzic & Kolozvari, Citation2022). Downtime not only refers to the time required to repair damaged components and refinish spaces. It also includes the time taken by activities, such as mobilization of resources and decision-making, referred to as irrational components or impeding factors (Almufti & Willford, Citation2013; Comerio, Citation2006). Several studies (Almufti & Willford, Citation2013; Cook, Liel, Haselton, et al., Citation2022; Joo & Sinha, Citation2022a; Molina Hutt, Hulsey, Kakoty, et al., Citation2022; Molina Hutt, Vahanvaty, & Kourehpaz, Citation2022; Terzic & Kolozvari, Citation2022) highlighted that the irrational components can significantly delay the initiation of repair works and therefore impede post-disaster recovery (). These factors include the time needed for planning, financing, post-disaster inspection, engineering mobilization, designing retrofit strategies, permitting and review duration, relocating operations, mobilizing contractors and construction crews, etc. Such non-physical and non-structural domains are central to system recovery and adaptation following an earthquake. Six case studies (models ‘e’ to ‘j’) were developed in this study (see ), each excluding one of the impeding factors from the list: financing impedance, long-lead-time impedance, engineering mobilization, contractor mobilization, inspection requirement, and permitting requirement to investigate the effect of the impeding factors. Finally, an ideal scenario with none of these six impeding factors was considered (model ‘k’). The impact of different impeding factors on various recovery metrics of interest is presented in subsubsection 5.2.2.
4.3. Reduction of post-disaster delays
To recover quickly from disasters and improve infrastructure resilience, delays in the start of repair works due to impeding factors can be reduced with proper strategies and efficient management by various stakeholders. One of the main stakeholder groups for resilient infrastructure consists of engineers, designers, and contractors (UNDRR, Citation2022a). Therefore, measures such as having an inspector, engineer, and contractor on retainer and/or eliminating long-lead time requirements can help to reduce delays and accelerate repair work. Scenarios (shown in ), including all three on individual retainer and all on collective retainer, with and without long-lead-time components affecting the recovery, were considered. The results are presented in subsection 5.2.3.
Other measures can also aid in faster recovery from disaster losses and allow buildings to regain occupancy and functionality. For example, if financing does not impede recovery, the building reoccupancy and functional recovery time can be reduced. Different scenarios of the availability of finance through a pre-arranged line of credit or cash on hand were considered in the performance models (see models ‘q’ to ‘ab’ in ) to study how they affect recovery and overall building downtime. Similarly, recovery can be expedited if some temporary operations, such as clean-up, and temporary and local stabilization repairs, are allowed immediately following an inspection (if needed) and in parallel with other impedances. For example, the consequences of external falling hazards on building occupant safety can be reduced by boarding up broken glazing and windows without waiting for full repair to be completed. A building performance model allowing temporary repairs (model ‘ac’ in ) was developed, and recovery estimates were compared to the baseline model. It is also observed that there is a surge in demand for labor and materials after an earthquake, which also extends the building downtime. If the surge in demand is properly managed for critical buildings like the one under consideration, faster recovery can be achieved. Assuming no surge in demand after a disaster was also investigated from a resilience perspective (model ‘ae’). The results of these case studies and their effects on recovery metrics are presented in subsubsection 5.2.4.
4.4. Non-structural performance improvement with post-disaster management
So far, the paper has dealt with the effects of individual disaster risk reduction strategies and pathways to reduce losses and recovery time for an archetypical building after an earthquake. Pre-planning measures and preparedness approaches combined with effective post-disaster management strategies can considerably reduce financial losses and facility downtime. To quantify the effects, a building performance model (model ‘d’) with the non-structural improvements, detailed in sub section 4.1, as well as the control of post-disaster delays along with the elimination of long-lead-time requirements, allowing for temporary repairs and efficiently managing the surge in demand was analyzed (Appendix D). The corresponding resilience assessment results and their discussions are presented in subsection 5.3.
5. Building performance assessment results
Resilience assessment of various pathways for resilient infrastructure (detailed in section 4) along with their impact on probabilistic seismic scenario losses and recovery time; reoccupancy, functional recovery, and full recovery are discussed in the next subsections.
5.1. Loss and recovery assessment of baseline building
Based on the collapse fragility function developed in another study (Badal & Sinha, Citation2022) for building (ID-2215) and seismic hazard estimation (Raghukanth, Citation2020), the archetypical building has a collapse likelihood of 0.3% for maximum considered earthquake. This study found that the probability of assigning red tag after DBE and MCE level earthquakes are much higher at 3.2% and 34%, respectively. The numbers show that the probability of assigning red tags is about one hundred times higher than the collapse probability for MCE level. The fragility components contributing to the red tag for both earthquake levels were B1041.001a and B1041.001b, which represent the fragility of columns with a beam on one side and beams on two sides, respectively (see for details). The building has 3.4% probability of non-reparability for MCE level, which is around ten times higher than the probability of collapse under the same level earthquake. Under DBE levels, the building is found to be safe against collapse or excessive residual drift.
Different scenario losses, repair time, and recovery time for the baseline model are shown as model ‘a’ in . The economic losses were evaluated in terms of repair cost ratios normalized with the building replacement cost. The average repair cost ratio, referred to as scenario expected losses (SEL), for DBE and MCE levels were 3.2% and 14% of the building repair cost, respectively. The respective median values (representing 50% POE) were 2.2% and 9.5%. The scenario upper losses (SUL), described as 90th percentile loss values, were found to be 6.9% and 22% for DBE and MCE, respectively. The major contributors to the scenario expected losses for DBE intensity were exterior cladding, structural components, plumbing and HVAC, partition walls, interior finishes, and other non-structural components, as shown in . However, for MCE intensity, the order changed to structural components, exterior cladding, residual drifts, partition walls, plumbing and HVAC, collapse, other non-structural components, and interior finishes (see ). The most damaged structural component, based on associated repair costs, at both hazard levels was columns with beams on two sides, while exterior claddings were the most damaged non-structural component.
Figure 5. Breakdown of expected losses of a baseline building model for DBE and MCE scenarios.
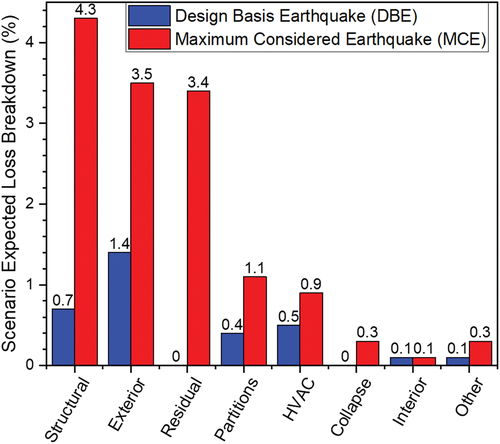
Table 1. Scenario losses, repair time, and recovery time assessment results.
The recovery assessment results suggest that the archetypical building is expected to be immediately occupiable after DBE level while taking 5.5 months (M) following MCE. The 90th percentile values indicate a high reoccupancy duration of 4.9 M and 14 M at DBE and MCE levels, respectively. The loss of reoccupancy at DBE level was mainly attributed to damage to stairs and stairway doors, followed by red tag and exterior system damage. However, at MCE level, loss of reoccupancy was mainly attributed to damage to stair systems, stairway doors, racking and access of entry doors, and unsafe placards.
Compared to reoccupancy duration, functional recovery took longer median time of 4.2 M instead of zero at DBE level and 9.8 M instead of 5.5 M at MCE level, respectively. This is because the damage to structural and non-structural components impedes functionality and the post-earthquake delays hinder repair activity. Such long downtime can significantly affect business and substantially add to indirect losses. The corresponding 90th percentile values suggest functional recovery time of one year at DBE level and one and a half years at the MCE level. For DBE level, the functionality loss was mainly attributed to damage to HVAC systems and elements already impeding building occupancy. However, for MCE level, the significant factors leading to functionality losses included those responsible for occupancy loss, nonoperational HVAC systems, damage to interiors, stairs, stair doors, and unsafe placards. Full recovery to pre-earthquake conditions is expected to take 6.2 M and 11 M for DBE and MCE levels, respectively. Thus, the stakeholder group that includes engineers, designers, and policymakers is presented with serious challenges to reduce downtime and mitigate losses.
The study also found that the median repair time (both series and parallel) from FEMA P-58 assessments for both intensity levels is smaller than the corresponding time for functionality and full recovery (refer ). This is because the FEMA P-58 procedure does not consider potential delays before the start of actual repairs. FEMA P-58 repair time was also found to be less than the recovery time in the scenario with no impeding factors. These results indicate that the series and parallel repair scheduling algorithms in FEMA P-58 do not consider constraints in construction scenarios and worker allocation realistically. For both hazard levels, the major expected repair time (worker-days) from FEMA P-58 results were associated with repair of cladding components, structural component beams (columns and beams), and wall partitions.
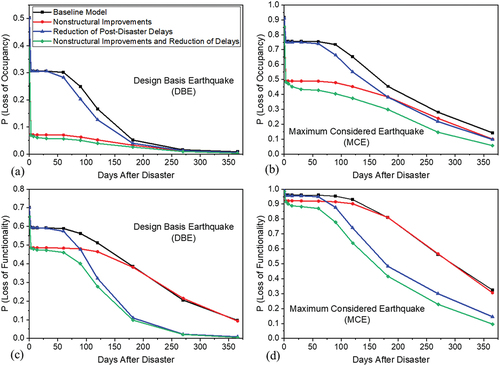
The post-disaster damage level and performance state of a critical building are dynamic as the building partially regains occupancy and functionality with the repair of each component and system. The probability of loss of building occupancy and functionality decreases over time, as shown in . As expected, the probabilities of occupancy and functionality losses for MCE level are higher than for DBE level. The results reveal around 50% and 92% probability for a building to lose immediate occupancy and 70% and 99% for loss of immediate functionality at DBE and MCE levels, respectively. Even after six months, 4% and 45% probability of loss of occupancy, and 38% and 81% probability of loss of functionality, respectively, were observed for DBE and for MCE. Even for a year after the disaster, the likelihood of building occupancy loss is around 1% and 14%, and functionality loss is 10% and 32%, respectively, at DBE and MCE levels. These results indicate significantly longer occupancy and functionality downtime associated with the current design and construction practices, necessitating considerations of improved and recovery-based performance targets in the design standards for higher resilient. Improvements in performance using various pathways are discussed below.
Figure 6. Probability of (a) loss of occupancy at DBE, (b) loss of occupancy at MCE, (c) loss of functionality at DBE, and (d) loss of functionality at MCE, for various preparedness approaches.
5.2. Resilience enhancement strategies
5.2.1. Role of improvement in non-structural seismic performance
(model ‘b’) and show the effects of non-structural performance improvements on various resilience metrics and the probability of occupancy and functionality loss. The improvements, detailed in sub section 4.1, helped non-structural components to experience less damage compared to the baseline model and, therefore, reduceadverse consequences (losses and downtime). It can be seen that the enhanced seismic performance of non-structural elements did not affect collapse likelihood, probability of red tag, and irreparability due to excessive residual drifts when compared to the baseline model (model ‘a’). Scenario expected loss decreased from 3.2% to 1.7% and 14% to 11% for DBE and MCE levels, respectively. Median losses also reduced from 2.2% to 1.0% and 9.5% to 6.1% for DBE and MCE levels, respectively. Reduction of economic losses of a similar order was also observed for scenarioupper losses. The most-damaged non-structural components, making maximum contribution to SEL at DBE and MCE levels are wall partitions and air handling units, respectively.
By adopting this pathway, not only was the performance improved in terms of economic losses, but the median FEMA P-58 repair time (series as well as parallel scheduling) was also substantially reduced (). The median reoccupancy time for MCE level was reduced to less than 3 days (D), compared to 5.5 M in the baseline model. The 90th percentile building reoccupancy time is also reduced from 4.9 M to 3 D for DBE level and by 2 M for MCE level. The immediate occupancy for DBE level was primarily affected by stairway doors, and for MCE level by entry door racking and access, stairway doors, and red tag. Relatively lower damage to the different components under this pathway helped in quicker functional recovery. The corresponding median values reduced from 4.2 M to 3 D at the DBE level.
The functionality of the building was found to be compromised in several realizations for about six months or more, mainly due to damage to HVAC systems. No significant improvement in median functional recovery time for MCE level by adopting this pathway was observed. This is attributed to extensive damage to HVAC systems (long-lead-time components), interior damages, electrical systems and other damaged-components hindering occupancy. The median time to full recovery at both intensity levels and the 90th percentile value at MCE were reduced by only around one month. However, enhancing the non-structural performance considerably reduced the probability of reoccupancy loss over time at both hazard levels, as depicted in . The probability of immediate occupancy loss reduced from 50% to 39% for DBE level, and 91% to 84% for MCE level. Similarly, the probability of functionality loss reduced from 70% to 65% for DBE level. Improvements in occupancy and functionality loss were mainly observed for the initial post-disaster phase that were controlled by delays from impeding factors in the later phase (). For both hazard levels, substantial improvement was observed in functionality loss when compared to corresponding occupancy loss. The performance improvement signifies that the enhancement in seismic resistance of non-structural components is important and should be given due considerations while designing new and retrofitting existing buildings. Therefore, seismic design and installation practices for non-structural elements, which are typically decided by stakeholder groups consisting of architects, engineers and contractors, are recommended to make buildings more resilient.
5.2.2. Elimination of post-disaster delays
The resilience assessment models ‘e’ to ‘k’ assume absence of certain impedances in the post-disaster phase (see Appendix D and sub section 4.2). As expected, no effect on consequences, such as collapse probability, the likelihood of unsafe placards and its contributing components, and excessive residual drift was observed. The scenario losses and breakdown of their contributory factors, the most damaged structural and non-structural components, and FEMA P-58 repair time were similar to the baseline model discussed in section 5.1.
This study investigated how and to what extent removing impedances can help to reduce recovery duration for damaged infrastructure and regain its occupancy and functionality. compares the median and 90th percentile recovery time for different cases with the baseline model. The results indicate that if the financing impedance is eliminated in the post-disaster scenario, the reoccupancy, functional recovery, and full recovery time reduce at DBE level. However, only reoccupancy and functional recovery times were shortened at MCE level. For the DBE and MCE levels, the greatest reduction in median as well as 90th percentile functional recovery time and full recovery time were observed when the impedance to long-lead components was eliminated (see model ‘f’ in ). Such improvement can be achieved if an alternate pathway with backup equipment, located far from the affected site, is available for mobilization in parallel and well within the time frame of other impeding factors. However, this did not affect reoccupancy time as the long-lead-time components, such as HVAC systems, are generally required only for functionality and not reoccupancy. The reoccupancy time reduced the most when permitting could be obtained without any delay (model ‘j’, ).
Table 2. Role of impeding factors in post-disaster recovery.
Other individual factors were observed to reduce the reoccupancy, functional recovery, and full recovery time by varying amounts and are shown in . As expected, the ideal post-earthquake scenario (model ‘k’), with no impeding factors and where repair activities could be started immediately after the earthquake, had the most substantial impact on recovery time for both intensities (). The median functional and full recovery time were reduced from 4.2 M to 5 D and 6.2 M to 1.7 M at DBE level. The 90th percentile time reduced from 4.9 M to 6 D for reoccupancy, 12 M to 3 M for functional recovery, and 12 M to 3.7 M for full recovery. At the MCE level, the median and 90th percentile reoccupancy time reduced from 5.5 M to 10 D and 14 M to 4.9 M, respectively. The median and 90th percentile functional recovery time similarly reduced from 9.8 M to 2.5 M and 18 M to 6.5 M, while the corresponding full recovery time was reduced from 10 M to 3.7 M and 18 M to 7.8 M, respectively.
These results illustrate that the post-event delays significantly contribute to extended downtime of buildings after a disaster, raising severe concerns among building owners, policymakers, and other stakeholders. Stakeholders, including owners, investors, and financial partners focused on value for money, are identified as one of the main stakeholder groups (UNDRR, Citation2022a). This stakeholder group is primarily responsible for controlling these impedances and can make decisions to improve resilience by reducing delays. These results further emphasize the importance of engaging multiple stakeholders and seeking collaboration to control different impedances and help in reducing recovery time. Based on the understanding of the role of these stakeholders, different strategic measures can be taken to reduce these delays and achieve rapid recovery. The contribution of these measures is quantified in the following subsection.
5.2.3. Reduction of delays from impeding factors
The role of strategic factors and options in accelerating building occupancy and functionality discussed in subsection 4.3 is quantified and presented in this section. compares the recovery assessment of pathways that reduce delays (models ‘l’ to ‘p’) with the baseline model (model ‘a’) to improve our understanding of how different post-earthquake management measures help to improve resilience and reduce overall building downtime. With the inspector on the retainer (model ‘l’), no impacts on recovery estimates were observed at the DBE level, a marginal impact on improving median and 90th percentile reoccupancy time at the MCE level. The respective reduction is only from 5.5 M to 5.4 M and 14 M to 13 M for the DBE and MCE levels. On the other hand, having an engineer or contractor on retainer helped in faster reoccupancy and functional recovery (see models ‘m’ and ‘n’ in ). The findings suggested that having all three; inspector, engineer, and contractor on a collective retainer (model ‘o’) helps to further enhance recovery of the systems at both intensity levels. The expected reoccupancy time reduced from 5.5 M to 4.5 M for MCE level, and median functional recovery time from 4.2 M to 3.8 M, and 9.8 M to 9.2 M for DBE and MCE levels, respectively. Median of full recovery time decreased from 6.2 M to 5.8 M and 11 M to 10 M, respectively, for DBE and MCE levels. The 90th percentile values shown in also indicate a considerable reduction in recovery time.
Table 3. Role of reducing post-disaster delays in recovery.
The study revealed that eliminating long-lead time requirements for specific components and having inspector, engineer, and contractor on retainer, significantly speeded up functional and full recovery (model ‘c’ in , model ‘p’ in , and ). Expected functional recovery time was observed to reduce from 4.2 M to 2.8 M and 9.8 M to 5.9 M, and the full recovery time from 6.2 M to 4.6 M and 11 M to 8.1 M for DBE and MCE levels, respectively. As expected, these factors have no role in reducing the probability of occupancy loss or functionality loss immediately after an event, as shown in . However, lower probability of occupancy or functionality loss compared to the baseline model during the later post-disaster phase was observed. The improvements resulting from controlling delays caused by impeding factors were more pronounced for functionality losses over time at both intensity levels. For example, six months after disaster, the probability of functionality loss at DBE and MCE levels reduced from 38% to 11% and 81% to 48%, respectively, when compared to the baseline model.
5.2.4. Other factors to improve recovery
The study also evaluated the role of insurance as a funding source in reducing losses. It was observed that compared to the baseline model, there was no effect on scenario losses or recovery time (see model ‘af’ in ). This is because insurance claims usually take long to process and secure payouts, forcing the owners to take a loan or raise funding through other sources in order to conduct repair works (Cook, Liel, Haselton, et al., Citation2022). During the study, the availability of cash on hand (COH) varied from 0% to 20% of the building replacement cost. Building models with 0.0% (baseline model), 0.1%, 0.2%, 0.5%, 1.0%, 1.5%, 2.0%, 3.0%, 4.0%, 5.0%, 10%, 15%, and 20% cash (normalized with building replacement cost) available on hand were considered (see models ‘q’ to ‘ab’ in ) to assess their effectiveness. It was found that the expected or median reoccupancy time duration for MCE level was reduced only when 10% or higher COH is available. Functional recovery time for DBE level showed a slight decrease for COH of 2% or higher and no impact at MCE level. Similarly, full recovery time were observed to improve on the availability of COH of 2% or more for the DBE level, while no impact was observed for the MCE level. The improvements observed in functional or full recovery time at MCE level are attributed to the long-lead-time components, and were not influenced by COH. The findings suggest that availability of cash alone does not help to achieve infrastructure resilience unless combined with other factors that are critical for speedy recovery.
For a building performance model allowing temporary repairs, it was observed that the median and 90th percentile reoccupancy time for MCE levels reduced marginally from 5.5 M to 5.2 M and 14 M to 13 M, respectively. The expected functional recovery time for MCE level reduced marginally from 9.8 M to 9.6 M. If the fire safety standards during habitability are relaxed by deploying a fire watch, (model ‘ad’ in ), the reoccupancy or functional recovery time are not significantly affected. This shows that the RC buildings were not at fire risk in the present study. It was also seen that by assuming no surge in demand or managing it efficiently, the recovery time was reduced at higher shaking levels. Corresponding to MCE level, the median reoccupancy, functional recovery, and full recovery time reduced marginally from 5.5 M to 4.8 M, 9.8 M to 9.4 M, and 11 M to 10 M, respectively. The 90th percentile reoccupancy and functional recovery time also improved from 14 M to 13 M and 18 M to 13 M, respectively.
5.3. Combining non-structural performance improvements with reduction of delays
The combined influence of non-structural performance improvements and reduction of impedances was investigated at both considered intensity levels, and the results are presented in (model ‘d’) and . It can be seen that the reduction in scenario losses with respect to the baseline model was substantial, showing enhanced resilience, and was similar to those due to only non-structural improvements. It was also noted that no effect on global consequences and FEMA P-58 repair time were observed. The median and 90th percentile reoccupancy time for MCE level significantly reduced from 5.5 M to 3 D and 14 M to 10 M, respectively. The expected functional recovery time reduced from 4.2 M to 3D for the DBE level and 9.8 M to 5.2 M for the MCE level. The median of full recovery time decreased from 6.2 M to 3.7 M and 11 M to 6.2 M for DBE and MCE levels, respectively.
At both DBE and MCE hazard levels, improving non-structural performance in the pre-disaster phase and reducing delays in the post-disaster phase enhanced infrastructure resilience by the greatest margin. Such a combination helped in reducing the probability of occupancy and functionality losses immediately as well as over time after the disaster, as shown in and is thus a useful pathway to reduce various direct as well as indirect losses. The reduction in probability of occupancy and functional loss immediately following an event was identical to the model with only non-structural performance improvements, as discussed in subsection 5.2.1. However, six months after the disaster event, the probability of occupancy loss was found to drop from 5% to 3% and 45% to 30% for DBE and MCE levels, respectively, compared to the baseline model. The effects were more pronounced in reducing the probability of functionality losses over time. Six months after the event, the probability of functionality loss decreases from 38% to 10% for DBE level and 81% to 42% for MCE level. The study shows that multi-stakeholder collaboration represented the best option for improving recovery performance and achieving infrastructure resilience goals.
6. Conclusion and remarks
The study presented seismic resilience assessment incorporating post-disaster recovery and adaptation parameters of critical buildings under a probabilistic framework. The study showed that such risk and resilience assessments are required to identify and implement adaptive pathways to improve resilience. This study extended the concept of adaptive pathways to reduce seismic risk and improve recovery performance and resilience of built infrastructure. The study also considered the influence of multi-stakeholder collaboration. Various pathways for seismic-resilient infrastructure were presented and their benefits in terms of reduction in losses and downtime were quantified. This study presented the resilience assessment for an archetypical commercial building under various scenarios of pre- and post-disaster preparedness. The archetypical building represented the behavior of all similar reinforced concrete buildings and results are thus representative of that class of buildings.
The study focused on understanding and evaluating the drivers of risk that shape the exposure of critical infrastructure to disasters. The impact of various engineering and management decisions influencing resilience, such as improving non-structural performance, eliminating certain impedances, or mitigating the delays due to such impedances through proper strategies, allowing temporary repairs, post-disaster management, and their combinations were investigated. The performance, losses, and subsequent recovery were estimated under a common probabilistic framework.
The assessment results and benefits of different pathways were evaluated in terms of different resilience metrics, such as scenario expected and upper losses, median and 90th percentile probability of time for building reoccupancy, functional recovery, and full recovery. Various options or combinations presented in the study shows the importance of collaborative decision-making for improving resilience and can be adopted by stakeholders, including designers, engineers, contractors, policymakers, investors, owners, government, and institutions before and after disasters. The results can also be used in designing various adaptive plans to improve recovery performance of structures. The multi-criteria assessment results revealed that the effective self-organization capacity of stakeholders and flexibility in infrastructure planning is essential to manage risks. The study suggested a need for transformation with more focus on understanding root causes of risks and barriers to resilience, engaging multiple stakeholders for risk-informed decisions, and develop more pathways to accomplish resilient infrastructure goals. Some important conclusions from this study are listed below:
The study extended the concept of integrating scientific information into planning and established resilience assessment as a key prerequisite for adaptive pathways to improve infrastructure resilience. In addition to conventional loss and risk assessments, the authors recommend functional recovery assessment as an integral requirement to reveal vulnerabilities, take proper actions, and enhance infrastructure resilience.
The study illustrated that while structural design is traditionally considered a purely technical task involving only architectural, engineering, and constructability considerations, the design of resilient infrastructure requires the involvement of additional multi-disciplinary considerations, such as decision-making speed and post-disaster availability of finances.
The study highlighted that impeding factors have a significant influence on recovery time. It was shown that some impending factors lead to considerably longer recovery time than that estimated using conventional methods.
The archetypical building considered in the study represents the common design and construction practice for reinforced concrete buildings. The study showed that the archetypical building has long occupancy and functionality downtime associated with different hazard levels. The study calls for considering recovery-based performance targets during design. The study also shows the importance of assessment and retrofitting standards and regulations to improve the resilience of critical infrastructure.
The study evaluated the advantages of seismic design and installation of non-structural components and showed that it results in significantly lesser functionality losses and thus helped to enhance resilience.
The effects of eliminating or controlling delays due to various impeding factors during the post-disaster phase were quantified to accelerate recovery. It was shown that these factors require management considerations. The information regarding the delays and corresponding controlling measures and their benefits should be known to these stakeholders. It can be used to prioritize the reduction of controlling factors during the post-disaster phase.
The study quantified and demonstrated how different pre-disaster planning, preparedness strategies, and efficient post-disaster management activities could be combined to improve response to anticipated risks, reduce scenario losses and associated downtime, enhance infrastructure resilience and abate cumulative losses over time after an event.
The methodology and the results presented in the study can be extended and applied to gain insights for the other infrastructure. Future studies may include more pathways for enhancing infrastructure resilience and consider the cost-benefit analyses of the pathways identified in this study.
Supplemental Material
Download MS Word (32.8 KB)Acknowledgments
The first author is a recipient of the Prime Minister’s Research Fellowship for pursuing his doctoral studies at Indian Institute of Technology Bombay. The authors also appreciate access to free academic license of the SP3 software by the HB-Risk group to facilitate computations for performance assessments.
Disclosure statement
No potential conflict of interest was reported by the author(s).
Supplementary material
Supplemental data for this article can be accessed online at https://doi.org/10.1080/23789689.2023.2188347
Additional information
Notes on contributors
Mohammad Rafiq Joo
Mohammad Rafiq Joo is a Prime Minister's Research Fellowship awardee pursuing his doctoral studies at Indian Institute of Technology Bombay, India. His research interests include disaster resilience assessment and enhancement of built infrastructure, structural earthquake engineering, recovery-based seismic design, and disaster risk reduction. Prior to joining IIT Bombay, he has also carried out research on the amplification of seismic waves, underground utility mapping, and load-capacity estimation of composite columns using finite element and machine learning approaches. He was awarded Institute Gold Model (Merit Award) from NIT Srinagar. He has published several peer-reviewed international journals and conference papers and has delivered guest lectures in different engineering colleges.
Ravi Sinha
Prof. Ravi Sinha is a professor at Civil Engineering department of Indian Institute of Technology Bombay, India. His main research interests are disaster risk management with focus on seismic risks. His research areas include resilience and performance-based structural design, vibration control of structures, and condition assessment of structures. He Chairs the Structural Safety Sectional Committee of Bureau of Indian Standards.
References
- ADB. (2022). Disaster-resilient infrastructure unlocking opportunities for Asia and the Pacific. Asian Development Bank. https://doi.org/10.22617/TCS220168-2.
- Almufti, I., & Willford, M. (2013). Resilience-based Earthquake Design Initiative (REDi) for the Next Generation of Buildings. San Francisco, CA: Arup.
- Argyroudis, S. A., Mitoulis, S. A., Chatzi, E., Baker, J. W., Brilakis, I., Gkoumas, K., Vousdoukas, M., Hynes, W., Carluccio, S., Keou, O., Frangopol, D. M., & Linkov, I. (2022). Digital technologies can enhance climate resilience of critical infrastructure. Climate Risk Management, 35, 100387. https://doi.org/10.1016/j.crm.2021.100387
- ASCE-41. (2017) . Seismic evaluation and retrofit of existing buildings. American Society of Civil Engineers.
- ATC 138-3. (2021). Methodology For assessment of functional recovery time. Applied Technology Council. http://www.ATCouncil.org
- Badal, P. S. (2020). A Framework for Multi-Objective Performance-Based Seismic Design of RC Frame Buildings [ PhD Thesis]. Indian Institute of Technology Bombay.
- Badal, P. S., & Sinha, R. (2019). Selection of archetypical building configuration for special reinforced concrete moment-resisting frames. Department of Civil Engineering, Indian Institute of Technology Bombay. https://www.civil.iitb.ac.in/~rsinha/TechRep_SMRF_Archetype
- Badal, P. S., & Sinha, R. (2022). A framework to incorporate probabilistic performance in force-based seismic design of RC buildings as per Indian standards. Journal of Earthquake Engineering, 26(3), 1253–1280. https://doi.org/10.1080/13632469.2020.1713931
- Baker, J. W. (2011). Conditional mean spectrum: Tool for ground-motion selection. Journal of Structural Engineering, 137(3), 322–331. https://doi.org/10.1061/(ASCE)ST.1943-541X.0000215
- Bosomworth, K., Harwood, A., Leith, P., & Wallis, P. (2015). Adaptation pathways :A playbook for developing options for climate change adaptation in natural resource management. Southern Slopes Climate Change Adaptation.
- Bruneau, M., Chang, S. E., Eguchi, R. T., Lee, G. C., O’rourke, T. D., Reinhorn, A. M., Shinozuka, M., Tierney, K., Wallace, W. A., & von Winterfeldt, D. (2003). A framework to quantitatively assess and enhance the seismic resilience of communities. Earthquake Spectra, 19(4), 733–752. https://doi.org/10.1193/1.1623497
- CDRI. (2019). Home | coalition for disaster resilient infrastructure. https://www.cdri.world/
- Chang, S. E., Taylor, J. E., Elwood, K. J., Seville, E., Brunsdon, D., & Gartner, M. (2019). Urban disaster recovery in Christchurch: The central business district Cordon and other critical Decisions. Earthquake Spectra, 30(1), 513–532. https://doi.org/10.1193/022413EQS050M
- Comerio, M. C. (2006). Estimating downtime in loss modeling. Earthquake Spectra, 22(2), 349–365. https://doi.org/10.1193/1.2191017
- Cook, D. T., Liel, A. B., DeBock, D. J., & Haselton, C. B. (2021). Benchmarking FEMA P-58 repair costs and unsafe placards for the Northridge Earthquake: Implications for performance-based earthquake engineering. International Journal of Disaster Risk Reduction, 56, 102117. https://doi.org/10.1016/J.IJDRR.2021.102117
- Cook, D. T., Liel, A. B., Haselton, C. B., & Koliou, M. (2022). A framework for operationalizing the assessment of post-earthquake functional recovery of buildings. Earthquake Spectra, 38(3), 1972–2007. https://doi.org/10.1177/87552930221081538
- Del Gobbo, G. M., Williams, M. S., & Blakeborough, A. (2018). Seismic performance assessment of Eurocode 8-compliant concentric braced frame buildings using FEMA P-58. Engineering Structures, 155, 192–208. https://doi.org/10.1016/j.engstruct.2017.11.016
- de Ruig, L. T., Barnard, P. L., Botzen, W. J. W., Grifman, P., Hart, J. F., de Moel, H., Sadrpour, N., & Aerts, J. C. J. H. (2019). An economic evaluation of adaptation pathways in coastal mega cities: An illustration for Los Angeles. The Science of the Total Environment, 678, 647–659. https://doi.org/10.1016/j.scitotenv.2019.04.308
- Djalante, R., Holley, C., Thomalla, F., & Carnegie, M. (2013). Pathways for adaptive and integrated disaster resilience. Natural Hazards, 69(3), 2105–2135. https://doi.org/10.1007/s11069-013-0797-5
- Du, K., Bai, W., Bai, J., Yan, D., Gong, M., & Sun, J. (2021). Comparative seismic performance assessment of reinforced concrete frame structures with and without structural enhancements using the FEMA p-58 methodology. ASCE-ASME Journal of Risk and Uncertainty in Engineering Systems, Part A: Civil Engineering, 7(4), 04021047. https://doi.org/10.1061/AJRUA6.0001173
- Fazey, I., Wise, R. M., Lyon, C., Câmpeanu, C., Moug, P., & Davies, T. E. (2016). Past and future adaptation pathways. Climate and Development, 8(1), 26–44. https://doi.org/10.1080/17565529.2014.989192
- FEMA. (2016) . National disaster recovery framework. Federal Emergency Management Agency.
- FEMA P-2090. (2021). Recommended options for improving the built environment for post-earthquake reoccupancy and functional Recovery Time. Federal Emergency Management Agency and National Institute of Standards and Technology. https://doi.org/10.6028/NIST.SP.1254
- FEMA P-58-1. (2018). Seismic performance assessment of buildings volume 1-methodology. Federal Emergency Management Agency. http://www.ATCouncil.org
- FEMA P-58-2. (2018). Seismic performance assessment of buildings volume 2-implementation guide second edition. Federal Emergency Management Agency. www.ATCouncil.org-
- FEMA P-58-3. (2018). Seismic performance assessment of buildings, volume 3 – supporting electronic materials and background documentation. Federal Emergency Management Agency. www.ATCouncil.org/
- FEMA P-58-5. (2018). Seismic Performance Assessment of Buildings, Volume 5 – Expected Seismic Performance of Code-Conforming Buildings. Federal Emergency Management Agency. www.ATCouncil.org?
- FEMA P695. (2009) . Quantification of Building Seismic Performance Factors. Federal Emergency Management Agency.
- Ghasemof, A., Mirtaheri, M., & Karami Mohammadi, R. (2022). Multi-objective optimization for probabilistic performance-based design of buildings using FEMA P-58 methodology. Engineering Structures, 254, 113856. https://doi.org/10.1016/j.engstruct.2022.113856
- Günay, S., & Mosalam, K. M. (2013). PEER performance-based earthquake engineering methodology, revisited. Journal of Earthquake Engineering, 17(6), 829–858. https://doi.org/10.1080/13632469.2013.787377
- Haasnoot, M., Kwakkel, J. H., Walker, W. E., & Ter Maat, J. (2013). Dynamic adaptive policy pathways: A method for crafting robust decisions for a deeply uncertain world. Global Environmental Change, 23(2), 485–498. https://doi.org/10.1016/j.gloenvcha.2012.12.006
- Haselton, C. B., Liel, A. B., Deierlein, G. G., Dean, B. S., & Chou, J. H. (2011). Seismic collapse safety of reinforced concrete buildings. I: Assessment of ductile moment frames. Journal of Structural Engineering, 137(4), 481–491. https://doi.org/10.1061/(ASCE)ST.1943-541X.0000318
- Haselton, C. B., Liel, A. B., Taylor Lange, S. C., & Deierlein, G. G. (2016). Calibration of model to simulate response of reinforced concrete beam-columns to collapse. ACI Structural Journal, 113(6), 1141–1152. https://doi.org/10.14359/51689245
- Ibarra, L. F., Medina, R. A., & Krawinkler, H. (2005). Hysteretic models that incorporate strength and stiffness deterioration. Earthquake Engineering & Structural Dynamics, 34(12), 1489–1511. https://doi.org/10.1002/eqe.495
- IPCC. (2014). Climate-resilient pathways: adaptation, mitigation, and sustainable development. working group ii to the fifth assessment report of the intergovernmental panel on climate change
- IS 13920. (1993). Ductile detailing of reinforced concrete structures subjected to seismic forces - Code of practice. In Bureau of Indian Standards, New Dehli.
- IS 1893 (Part-1). (2002). Criteria for earthquake resistant design of structures. In Bureau of Indian Standards, New Dehli.
- IS 456. (2000). Plain and Reinforced Concrete-Code of practice. In Bureau of Indian Standards, New Dehli.
- Joakim, E. P., Mortsch, L., & Oulahen, G. (2015). Using vulnerability and resilience concepts to advance climate change adaptation. Environmental Hazards, 14(2), 137–155. https://doi.org/10.1080/17477891.2014.1003777
- Joo, M. R. (2022). Performance-Based Seismic Resilience Assessment of Reinforced Concrete Buildings. Annual Progress Seminar, Department of Civil Engineering, Indian Institute of Technology Bombay.
- Joo, M. R., Badal, P. S., & Sinha, R. (2022). Recovery-based seismic resilience assessment of IS code-conforming RC buildings. In Proceedings of 17th Symposium on Earthquake Engineering. Roorkee, India: IIT Roorkee.
- Joo, M. R., & Sinha, R. (2022a). Adaptive Pathways for Disaster-Resilient Infrastructure – Resilience Assessment as a Fundamental Requirement. Proceedings of DRI Technical Conference. New Delhi, India.
- Joo, M. R., & Sinha, R. (2022b). Functional recovery and performance-based earthquake engineering. National Conference on Resilient Infrastructure (NCRI). Kerala, India.
- Judd, J. P., & Pakwan, N. (2018). Seismic performance of steel moment frame office buildings with square concrete-filled steel tube gravity columns. Engineering Structures, 172, 41–54. https://doi.org/10.1016/j.engstruct.2018.06.016
- Kurth, M. H., Keenan, J. M., Sasani, M., & Linkov, I. (2019). Defining resilience for the US building industry. Building Research & Information, 47(4), 480–492. https://doi.org/10.1080/09613218.2018.1452489
- Kwakkel, J. H., Haasnoot, M., & Walker, W. E. (2016). Comparing robust decision-making and dynamic adaptive policy pathways for model-based decision support under deep uncertainty. Environmental Modelling & Software, 86, 168–183. https://doi.org/10.1016/J.ENVSOFT.2016.09.017
- McKenna, F., Fenves, G. L., & Scott, M. H. (2000). Open System for Earthquake Engineering Simulation. University of California. http://opensees.berkeley.edu
- Molina Hutt, C., Almufti, I., Willford, M., & Deierlein, G. (2016). Seismic loss and downtime assessment of existing tall steel-framed buildings and strategies for increased resilience. Journal of Structural Engineering, 142(8), C4015005. https://doi.org/10.1061/(ASCE)ST.1943-541X.0001314
- Molina Hutt, C., Hulsey, A. M., Kakoty, P., Deierlein, G. G., Eksir Monfared, A., Wen-Yi, Y., & Hooper, J. D. (2022). Toward functional recovery performance in the seismic design of modern tall buildings. Earthquake Spectra, 38(1), 283–309. https://doi.org/10.1177/87552930211033620
- Molina Hutt, C., Vahanvaty, T., & Kourehpaz, P. (2022). An analytical framework to assess earthquake-induced downtime and model recovery of buildings. Earthquake Spectra, 38(2), 1283–1320. https://doi.org/10.1177/87552930211060856
- Panagiotakos, T. B., & Fardis, M. N. (2001). Deformations oF reinforced concrete members at yielding and ultimate. ACI Structural Journal, 98(2). https://doi.org/10.14359/10181
- PEER. (2013). PEER NGA-WEST 2 ground motion database. https://ngawest2.berkeley.edu/
- Raghukanth, S. (2020). Development of probabilistic seismic hazard map of India. Personal Communication.
- The Rockefeller Foundation. (2013) . 100 Resilient Cities. Rockfeller Foundation.
- Sikula, N. R., Mancillas, J. W., Linkov, I., & McDonagh, J. A. (2015). Risk management is not enough: A conceptual model for resilience and adaptation-based vulnerability assessments. Environment Systems and Decisions, 35(2), 219–228. https://doi.org/10.1007/s10669-015-9552-7
- SP3. (2022) . Seismic Performance Prediction Program (v1.2.0). Haselton- Baker Risk Group.
- Tellman, B., Bausch, J. C., Eakin, H., Anderies, J. M., Mazari-Hiriart, M., Manuel-Navarrete, D., & Redman, C. L. (2018). Adaptive pathways and coupled infrastructure: Seven centuries of adaptation to water risk and the production of vulnerability in Mexico City. Ecology and Society, 23(1), art1. https://doi.org/10.5751/ES-09712-230101
- Terzic, V., & Kolozvari, K. (2022). Probabilistic evaluation of post-earthquake functional recovery for a tall RC core wall building using F-Rec framework. Engineering Structures, 253, 113785. https://doi.org/10.1016/J.ENGSTRUCT.2021.113785
- Terzic, V., Villanueva, P. K., Saldana, D., & Yoo, D. Y. (2021). F-Rec framework: Novel framework for probabilistic evaluation of functional recovery of building systems (PEER Report No. 2021/06). Pacific Earthquake Engineering Research Center (PEER).
- UNDRR. (2005). Hyogo framework for action. United Nations Office for Disaster Risk Reduction. https://www.preventionweb.net/sendai-framework/Hyogo-Framework-for-Action
- UNDRR. (2015) . Sendai Framework for Disaster Risk Reduction 2015 - 2030. United Nations Office for Disaster Risk Reduction.
- UNDRR. (2022a) . Handbook for Implementation of the Principles for Resilient Infrastructure. United Nations Office for Disaster Risk Reduction.
- UNDRR. (2022b) . Principles for Resilient Infrastructure. United Nations Office for Disaster Risk Reduction.
- UNDRR. (2022c). Global assessment report on disaster risk reduction 2022: Our world at risk: Transforming governance for a resilient Future. United Nations Office for Disaster Risk Reduction.
- Werners, S. E., Wise, R. M., Butler, J. R. A., Totin, E., & Vincent, K. (2021). Adaptation pathways: A review of approaches and a learning framework. Environmental Science & Policy, 116, 266–275. https://doi.org/10.1016/j.envsci.2020.11.003
- Wise, R. M., Fazey, I., Stafford Smith, M., Park, S. E., Eakin, H. C., Archer Van Garderen, E. R. M., & Campbell, B. (2014). Reconceptualising adaptation to climate change as part of pathways of change and response. Global Environmental Change, 28, 325–336. https://doi.org/10.1016/j.gloenvcha.2013.12.002