
Abstract
The grass emperor Lethrinus laticaudis is a coral reef fish that has high value to fisheries and is vulnerable to overharvesting. The complete mitochondrial genome was assembled from approximately 5.5 million reads produced by Illumina MiSeq. The 16,758 bp consisted of 13 protein-coding genes, 22 transfer RNA genes and two ribosomal RNA genes (12S and 16S). The genes and RNAs order and orientation on as well as the A + T base content (50.7%) was similar to what is found in other Teleosts. A phylogenetic tree with the most closely related species available in GenBank was built to validate L. laticaudis mitogenome.
Keywords:
Lethrinus laticaudis Alleyne & Macleay, 1877 is an exploited species of Lethrinidae that occurs in tropical waters of western Pacific and southeastern Indian oceans throughout southern Indonesia, Australia, Papua New Guinea, Solomon Islands and New Caledonia (Carpenter & Niem Citation2001). They mainly inhabit brackish and marine water with adults common over shallow (<50 m) coral reef habitats and their juveniles occupying seagrass meadows and mangrove forests (Carpenter & Niem Citation2001; Travers et al. Citation2010). The species is considered an excellent eating fish and is targeted by commercial fishers and recreational anglers across northern Australia (Coleman Citation2003). Although the grass emperor is considered robust to fishing pressure (Grubert et al. Citation2010) due to its high reproductive capacity (i.e. serial batch spawners, high spawning frequency, high batch fecundity) (Ayvazian et al. Citation2004), it is heavily exploited in some areas. Genetic information on the species’ stock structure is required to support future decisions on fisheries management and ensure the sustainability of exploited populations. In this study, we determine the complete mitogenomic sequence for L. laticaudis using a next generation sequencing approach.
Genomic DNA was extracted from a tissue sample (WAM16-001) using Qiagen DNAesy Blood and Tissue Kits (Qiagen, Germantown, USA) following the manufacturer’s instructions. The purified genomic DNA was processed (Illumina, San Diego, CA) on a MiSeq Illumina platform at the AGRF (Australian Genomics Research Facilities).
The MiSeq run yielded 5,601,280 sequences with a read length of 300 bp. The mitogenome was assembled from paired end sequences. The reads were first mapped against the complete mitochondrial genome of Larimichthys crocea (Scianidae, GenBank Accession Number NC_011710) in Geneious version 9.0.2 (http://www.geneious.com, Kearse et al. Citation2012). The 8163 mapped reads were then assembled de novo to produce a 16,758 bp length mitogenome assembly (GenBank Accession Number: KU530221). Indels were validated or corrected based on depth and sequence quality. The overall mean coverage was 145 (min = 2; max = 410; SD = 47.9). De novo annotations of the mitogenomic sequence were computed using the MitoAnnotator pipeline on the Mitofish webserver (Iwasaki et al. Citation2013).
The complete mitogenome of L. laticaudis consisted of 13 protein-coding genes, 22 transfer RNA (tRNA), 2 ribosomal RNA (rRNA) as well as two non-coding regions namely the origin of light strand replication (OL) and the control region (D-Loop). The genes and RNAs were typically ordered and oriented between the two strands of the mitogenome as described in . Moreover, the base composition was A, 32%, T, 18.7%, G, 21.3%, C, 28% with an A + T base content (50.7%) similar to other Teleosts.
Table 1. Detailed structure of Lethrinus laticaudis mitogenome (KU530221).
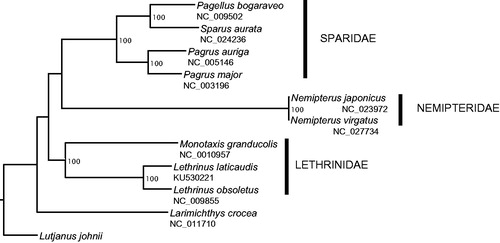
To validate our mitogenome and assist with future taxonomic and phylogenetic studies, L. laticaudis mitogenome was aligned against the mitogenomes of closely related species chosen based on the classification of bony fishes (Betancur et al. Citation2013) and considering their availability in GenBank. The phylogenetic tree () showed that our mitogenome grouped together with the other Lethrinidae species. The Sparidae as well as the Nemipteridae species grouped together and formed a sister clade to the Lethrinidae (). Our findings are consistent with what was described in Betancur et al. (Citation2013) and validate the accuracy of our mitogenome and species sample.
Figure 1. Phylogenetic tree of 11 closely related species including Lethrinus laticaudis based on the analysis of mitogenome sequences. The mitogenomes were aligned in Geneious using ClustalW alignment method with default settings. Poorly aligned positions and indels were removed with Gblock v 0.91b (Castresana Citation2000; Dereeper et al. Citation2008) using default settings and the D-Loop region was also excluded (total length: 15,323 bp). A heuristic maximum likelihood (ML) search was conducted using RaxML HPC v8 (Stamatakis Citation2006) on XSEDE, implemented in the CyberInfrastructure for Phylogenetic Research (CIPRES) portal v3.3 (http://www.phylo.org/portal2, Miller et al. Citation2010). Lutjanus johnii was set as the outgroup species for our analysis. A rapid bootstrap analysis and a search for best-scoring ML tree were performed. Robustness of the nodes was assessed with 1000 bootstrap replicates.
The present genomic information will help lay the foundations for more detailed understanding of the biological and genetic diversity of the species, and contribute to its conservation and sustainable management.
Acknowledgements
The authors thank Mike Travers, Steve Newman and other staff from the Western Australian Department of Agriculture and Fisheries for sample collection and valuable comments.
Disclosure statement
The authors report no conflicts of interest. The authors alone are responsible for the content and writing of this article.
Funding information
This research was supported by the Fisheries Research and Development Corporation (Project 2013/017); and the researcher LT was supported by the North Australia Marine Research Alliance (NAMRA – AIMS/ANU/CDU/NT Government) post-doctoral Fellowship.
References
- Ayvazian S, Chatfield B, Australia W. 2004. The age, growth, reproductive biology and stock assessment of grass emperor, Lethrinus laticaudis in Shark Bay, Western Australia. North Beach, Western Australia: Department of Fisheries, Research Division, WA Marine Research Laboratories.
- Betancur RR, Broughton RE, Wiley EO, Carpenter K, López JA, Li C, Holcroft NI, Arcila D, Sanciangco M, Cureton II JC. 2013. The tree of life and a new classification of bony fishes. PLoS Curr. 5:1–33.
- Carpenter KE, Niem VH. 2001. FAO species identification guide for fishery purposes. The living marine resources of the Western Central Pacific. Volume 5. Bony fishes part 3 (Menidae to Pomacentridae). Rome, Italy: FAO Library.
- Castresana J. 2000. Selection of conserved blocks from multiple alignments for their use in phylogenetic analysis. Mol Biol Evol. 17:540–552.
- Coleman APM. 2003. The national recreational fishing survey: the Northern Territory. Northern Territory Department of Business, Industry and Resources Development. Fishery Report.
- Dereeper A, Guignon V, Blanc G, Audic S, Buffet S, Chevenet F, Dufayard J-F, Guindon S, Lefort V, Lescot M. 2008 . Phylogeny.fr: robust phylogenetic analysis for the non-specialist. Nucl Acids Res. 36:W465–W469.
- Grubert MA, Kuhl PJ, Penn JW. 2010. Ecological risk assessment. Northern Territory coastal line fishery. Norther Territory Department of Resources. Fishery Report.
- Iwasaki W, Fukunaga T, Isagozawa R, Yamada K, Maeda Y, Satoh TP, Sado T, Mabuchi K, Takeshima H, Miya M. 2013. MitoFish and MitoAnnotator: a mitochondrial genome database of fish with an accurate and automatic annotation pipeline. Mol Biol Evol. 30:2531–2540.
- Kearse M, Moir R, Wilson A, Stones-Havas S, Cheung M, Sturrock S, Buxton S, Cooper A, Markowitz S, Duran C. 2012. Geneious Basic: an integrated and extendable desktop software platform for the organization and analysis of sequence data. Bioinformatics. 28:1647–1649.
- Miller M, Pfeiffer W, Schwartz T. Creating the CIPRES Science Gateway for inference of large phylogenetic trees. Gateway Computing Environments Workshop (GCE), 2010, IEEE, 1–8.
- Stamatakis A. 2006. RAxML-VI-HPC: maximum likelihood-based phylogenetic analyses with thousands of taxa and mixed models. Bioinformatics. 22:2688–2690.
- Travers M, Potter I, Clarke K, Newman S, Hutchins J. 2010. The inshore fish faunas over soft substrates and reefs on the tropical west coast of Australia differ and change with latitude and bioregion. J Biogeogr. 37:148–169.