
Abstract
A complete mitochondrial genome was sequenced from a grapsid crab, Grapsus tenuicrustatus (Herbst 1783), which was collected from a rocky intertidal zone of Chuuk lagoon. The size of mitochondrial genome is 15,858 bp with 31.9% A, 22.8% C, 12.2% G and 33.1% T distribution. Furthermore phylogenetic relationships of the Grapsoidea evaluated due to mitochondrial protein-coding genes. As per the obtained results, the families Grapsidae and Varunidae have sister group relationship in the superfamily Grapsoidea.
The grapsid crabs containing about 160 species in 9 genera inhabit rocky zones, estuaries, and marshes (WoRMS Citation2016). There is only one complete mitochondrial genome known from the Grapsidae species, Pachygrapsus crassipes (Yu et al. Citation2014). In this study, complete mitochondrial genome of grapsid species, Grapsus tenuicrustatus (Herbst 1783) sequenced and reported. This is the second record of complete mitochondrial genome from the family Grapsidae.
Specimens of G. tenuicrustatus were collected from the rocky intertidal zone of Weno Island, Chook Lagoon, Federated States of Micronesia (N 7°28′40″, E 151°53′49″) on 25 February 2015. The specimens were preserved in 97% ethanol and deposited in the Marine Biodiversity Institute of Korea (MABIK CR00235261).
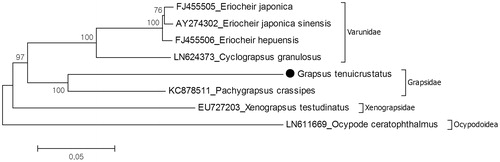
The mitochondrial genome composed of 13 protein-coding genes, 2 ribosomal RNA genes 16S and 12S rRNA, and 22 tRNA genes. There are 10 overlapping regions in the genome with 1–8 bp length. The largest overlapping region is located between tRNA-Trp and tRNA-Cys. The genome shows 15 intergenic sequences varying from 1 to 48 bp in length. In comparison with P. crassipes, although they have identical gene order, their mitochondrial genome length is different. Size of mitochondrial genome of G. tenuicrustatus is 15,858 bp (GenBank accession number: KT878721), which is longer than P. crassipes mitochondrial genome (15,652 bp). The difference between two species can be explained by longer NAD4 gene region of G. tenuicrustatus. While G. tenuicrustatus has 1,641 bp, P. crassipes has 1339 bp for same region. Another reason is the putative control region. G. tenuicrustatus have putative control region, 494 bp that located between 12S rRNA gene and tRNA-Ile in G. tenuicrustatus with 68.4% A–T content although P. crassipes does not have putative control region. Phylogenetic tree of Grapsoidea showed that G. tenuicrustatus and P. crassipes are members of the Grapsidae. Families Grapsidae and Varunidae have sister group relationship and Xenograpsidae early branched in the superfamily Grapsoidea (). Similar results were observed in previous nuclear and mitochondrial gene-based molecular study (Tsang et al. Citation2014). This mitochondrial genome data provide genetic markers for phylogenetic of the grapsid crabs, which will be a part of mitochondrial genome library for provide evolutionary and systematic studies.
Figure 1. Molecular phylogeny of G. tenuicrustatus in the superfamily Grapsoidea. The phylogeny of G. tenuicrustatus reconstructed with maximum likelihood statistical method by MEGA 6 software (Tamura et al. Citation2013). For reconstruction, the complete mitochondrial genomes of the Grapsoidea species were retrieved from the GenBank and amino acid sequences of all protein coding genes except ATP8 gene were used for analysis. mtREV with Freqs (+F) model used for amino acid substitution and bootstrap method replicated 1000 times for the test of phylogeny. Ocypode ceratophthalmus which belongs to the superfamily Ocypodoidea chosen as representative of outgroup. For sequencing, the mitochondrial DNA was extracted from walking leg. Purified libraries were profiled using the Agilent Bioanalyzer and sequenced using the Illumina MiSeq platform to yield 300 bp paired end reads. Mitochondrial genes were assembled and annotated by MITObim software (Hahn et al. Citation2013) and MITOS web server (Bernt et al. Citation2013). The annotation of mitogenome sequences was refined by Geneious software version 9.1.2 (http://www.geneious.com, Kearse et al. Citation2012).
Funding information
This research was a part of the project titled ‘Development of overseas marine bioresources and a system for their utilization’, funded by the Ministry of Oceans and Fisheries, Korea (Grant PM 59120).
Acknowledgements
We thank to the Department of Marine Resources, State of Chuuk, Federated States of Micronesia, for allowing marine organism research.
Disclosure statement
The authors report no conflict of interest.
References
- Bernt M, Donath A, Jühling F, Externbrink F, Florentz C, Fritzsch G, Pütz J, Middendorf M, Stadler PF. 2013. MITOS: improved de novo metazoan mitochondrial genome annotation. Mol Phylogenet Evol. 69:313–319.
- Hahn C, Bachmann L, Chevreux B. 2013. Reconstructing mitochondrial genomes directly from genomic next-generation sequencing reads – a baiting and iterative mapping approach. Nucleic Acids Res. 41:e129
- Kearse M, Moir R, Wilson A, Stones-Havas S, Cheung M, Sturrock S, Buxton S, Cooper A, Markowitz S, Duran C, et al. 2012. Geneious basic: an integrated and extendable desktop software platform for the organization and analysis of sequence data. Bioinformatics. 28:1647–1649.
- Tamura K, Stecher G, Peterson D, Filipski A, Kumar S. 2013. MEGA6: molecular evolutionary genetics analysis Version 6.0. Mol Biol Evol. 30:2725–2729.
- Tsang LM, Schubart CD, Ahyong ST, Lai JCY, Au EYC, Chan TY, Ng PKL, Chu KH. 2014. Evolutionary history of true crabs (Crustacea: Decapoda: Brachyura) and the origins of freshwater crabs. Mol Biol Evol. 31:1173–1187.
- Yu YQ, Ma WM, Yang WJ, Yang JS. 2014. The complete mitogenome of the lined shore crab Pachygrapsus crassipes Randall 1840 (Crustacea: Decapoda: Grapsidae). Mitochondrial DNA. 25:263–264.
- WoRMS Editorial Board. 2016. World register of marine species; [cited 2016 Apr 5]. Available from http://www.marinespecies.org.