
Abstract
Pelagic fishes captured in the international tuna fisheries have attracted increasing attention in recent years because of declines in their populations. In this study, 58 complete mitochondrial genomes of pelagic species from the classes Teleostean and Chondrichthyans were analyzed. The length of the 58 mtDNA sequences ranged from 15,598 to 18,880 bp, and all of which contained 13 protein-coding genes, 22 tRNA genes, 2 rRNA genes, and 1 control region. Our results suggested that mitochondrial genomes could be a powerful marker for resolving the phylogeny of pelagic fishes. Phylogenetic relationships based on the complete mitochondrial among 58 species indicated that Teleostean and Chondrichthyans are well separated. However, the control region length of Mobula japonicais was much larger than the other species in this study. Additionally, the Prionace glauca was divided into the clade in the genus Carcharhinus which provided a prospective taxonomic status of P.glauca.
Tuna fisheries have been prosecuted around the world since at least the pre-1950s (Miyake et al. Citation2004) and the fisheries brings important economic and social benefits to many nations and areas (Langley et al. Citation2009; Barclay Citation2010; Parris Citation2010). Tuna has a higher economic value compared to other species and the high market demands for tuna have led to significant overcapacity in tuna fishing fleets (Joseph Citation2003). Furthermore, most stocks of the principal marketable tuna species are nearly fully exploited (Majkowski Citation2007), as well as the production of bycatch from tuna fishery increases with the fishing fleets. Ecosystem-based fishery management (EBFM) is a new direction for fishery management, essentially reversing the order of management priorities to start with the ecosystem rather than the target species (Pikitch et al. Citation2004). Management practice proves the EBFM is a more effective management method in the pelagic fishes (Raakjaer et al. Citation2014; Skern-Mauritzen et al. Citation2016).
Molecular genetic data has widely been applied for marine fishery management (Waples et al. Citation2008). The mitochondrial (mt) genome has been widely used as a marker for molecular genetic studies because of its high rate of mutation and exclusively maternal mode of inheritance (Brown et al. Citation1979; Harrison Citation1989). Recent studies, however, demonstrated exceptions to these widely held concepts of mitochondrial biology (Ravago et al. Citation2002). In particular, the observation of mtDNA length variability within species (Rand Citation1993) challenges the view of evolution, which indicates that more ancient species have with larger genomes.
In this study, the molecular biology of samples from 58 pelagic fishes captured as bycatch in the tuna fishery was used to describe their phylogeny. All the 58 species were accessed from GenBank (). The mitochondrial DNA length of the 58 species ranged from 15,598 to 18,880 bp. However, the control region of Mobula japonica was observed to be as long as 3165 bp, while that of the other species in this study were smaller than 1500bp. The patterns of mitochondrial DNA variation were investigated in pelagic species to examine their evolution.
Table 1. Fifty-eight complete mitochondrial DNA pelagic species from tuna fishery.
A phylogenetic tree was constructed based on the complete mitochondrial DNA of 58 pelagic species from tuna fishery () to understand the evolutionary relationship and the position of pelagic species. Maximum-likelihood fits of 24 different nucleotide substitution models () were tested before constructing the phylogenetic tree; the results showed that TN93 + G + I model fits these data the best for the neighbour-joining tree (NJ Tree). The NJ Tree was conducted in MEGA 5 (MEGA Inc., Englewood, NJ; Tamura et al. Citation2011) with bootstrap values of 1000 replicates. The NJ Tree successfully divided the Teleostean and Chondrichthyans into two separate groups, and all the genus species were well determined except for the Carcharhinus and Prionace. The results of phylogenetic tree indicated that M. japonica is a more ancient species, since it stands at the root of the tree. The length of mitochondrial DNA of M. japonica was much larger () than that of the other species in this study which provided further evidence that M. japonica is a more ancient species in the pelagic species.
Figure 1. Neighbour-joining tree of 58 pelagic species from tuna fishery.
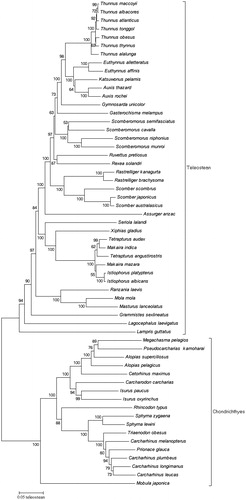
Table 2. Maximum-Likelihood fits of 24 different nucleotide substitution models.
Prionace glauca with different morphologic characters from Carcharhinus, such as long pectoral fins greater than internarial, a first dorsal fin origin well behind the rear angle of the pectoral fin, dermal gill rakers, bigger upper tooth with jaws, and much fewer rows of teeth than that of Carcharhinus (Compagno Citation1988). Moreover, a prolonged and gradual process of clasper of P. glauca making it rather difficult to be used for determining the maturation of males in Prioncae (Compagno Citation1984). Furthermore, the colour at the top of P. glauca is dark indigo blue, while generally brown, blue bronze, and olive in the species of Carcharhinus. But, Naylor’s allozyme electrophoretic analyses (Naylor Citation1989) indicated that P. glauca was included in the gene of Carcharhinus. And Dosay-Akbulut (Citation2008) used the ribosomal IT1-2 regions sequences to present the phylogenetic relationship with the genus Carcharhinus, the bootstrap tree of the NJ (Kimura) indicated that P. glauca is a member of genus Carcharhinus. A bootstrap tree of NJ was constructed with the whole mtDNA sequences from tuna fisheries species in this study, which point out that P. glauca was cladded into the group of genus Carcharhinus. Consequently, the NJ Tree based on the whole mtDNA sequences can be considered a powerful marker for resolving the phylogeny relationships within pelagic species.
Acknowledgements
We would like to thank the professor Cody Szuwalski from University of California Santa Barbara and Bai Li from Maine University for assistance in improving the paper.
Disclosure statement
The authors report no conflicts of interest. The authors alone are responsible for the content and writing of the paper.
Funding
This work was supported by the China National Fisheries Observer Program (08-54).
References
- Barclay K. 2010. Impacts of tuna industries on coastal communities in Pacific Island countries. Marine Policy. 34:406–413.
- Brown WM, George M, Wilson AC. 1979. Rapid evolution of animal mitochondrial DNA. Proc Natl Acad Sci USA. 76:1967–1971.
- Compagno LJV. 1984. Sharks of the World. FAO Species Catalog. Rome: Food and Agriculture Organization of the United Nations. p. 250–655.
- Compagno LJV. 1988. Sharks of the order Carcharhiniformes. Princeton (NJ): Princeton University Press.
- Dosay-Akbulut M. 2008. The phylogenetic relationship within the genus Carcharhinus. Comptes Rendus Biologies. 331:500–509.
- Harrison RG. 1989. Animal mitochondrial DNA as a genetic marker in population and evolutionary biology. Trends Ecol Evol (Amst.). 4:6–11.
- Joseph J. 2003. Managing fishing capacity of the world tuna fleet. Rome: Food and Agriculture Organization of the United Nations. p. 67.
- Langley A, Wright A, Hurry G, Hampton J, Aqorua T, Rodwell L. 2009. Slow steps towards management of the world's largest tuna fishery. Marine Policy. 33:271–279.
- Majkowski J. 2007. Global fishery resources of tuna and tuna-like species. Rome: Food and Agriculture Organization of the United Nations. p. 54.
- Miyake M, Miyabe N, Nakano H. 2004. Historical trends of tuna catches in the world. Roma: Food and Agriculture Organization of the United Nations. p. 74.
- Naylor GJP. 1989. The phylogenetic relationships of Carcharhiniform sharks inferred from electrophoretic data, Ph.D. Dissertation. College Park, MD: University of Maryland.
- Nei M, Kumar S. 2000. Molecular evolution and phylogenetics. New York: Oxford University Press.
- Parris H. 2010. Tuna dreams and tuna realities: defining the term “maximising economic returns from the tuna fisheries” in six Pacific Island states. Marine Policy. 34:105–113.
- Pikitch EK, Santora C, Babcock EA, Bakun A, Bonfil R, Conover D, Dayton P. 2004. Ecology. Ecosystem-based fishery management. Science. 305:346–347.
- Raakjaer J, Van Leeuwen J, van Tatenhove J, Hadjimichael M. 2014. Ecosystem-based marine management in European regional seas calls for nested governance structures and coordination: a policy brief. Marine Policy. 50:373–381.
- Rand DM. 1993. Endotherms, ectotherms, and mitochondrial genome-size variation. J Mol Evol. 37:281–295.
- Ravago RG, Monje VD, Juinio-Meñez MA. 2002. Length and sequence variability in mitochondrial control region of the milkfish, Chanos chanos. Mar Biotechnol. 4:40–50.
- Skern-Mauritzen M, Ottersen G, Handegard NO, Huse G, Dingsør GE, Stenseth NC, Kjesbu OS. 2016. Ecosystem processes are rarely included in tactical fisheries management. Fish Fisheries. 17:165–175.
- Tamura K, Peterson D, Peterson N, Stecher G, Nei M, Kumar S. 2011. MEGA5: molecular evolutionary genetics analysis using maximum likelihood, evolutionary distance, and maximum parsimony methods. Mol Biol Evol. 28:2731–2739.
- Waples RS, Punt AE, Cope JM. 2008. Integrating genetic data into management of marine resources: how can we do it better? Fish Fisheries. 9:423–449.