
Abstract
The Eld’s deer or brow-antlered deer (Rucervus eldii) is one of the most endangered cervids of Southeast Asia. Geographically, it has three distinct subspecies; Sangai or Manipur's brow-antlered deer (R. e. eldii), Siamese brow-antlered deer (R. e. siamensis) and Thamin or Myanmar’s brow antlered deer (R. e. thamin). We examined the genetic diversity of wild and captive populations of R. e. eldii and compared its relationship with other subspecies using mtDNA control region gene. During the analysis, only one haplotype was detected in 30 samples of R. e. eldii. No genetic variation was observed among the R. e. eldii populations. The reduced genetic diversity indicates that the population has passed through the bottleneck effect that might have resulted in the inbreeding depression.
Introduction
The Eld’s deer (Rucervus eldii) is the most localized cervid species found in India occurring as a single isolated population in a 40 km2 area of the Keibul Lamjao National Park (KLNP), Manipur (Hussain et al. Citation2006). Once distributed throughout much of Southeast Asia extending from Manipur to Indochina and southern China, it is now confined in small isolated patches (Gray et al. Citation2015). Traditional taxonomy divides Eld’s deer into three subspecies; Sangai or Manipur’s brow-antlered deer (R. e. eldii, McClelland Citation1842); Siamese brow-antlered deer (R. e. siamensis, Lydekker Citation1915) and Thamin or Myanmar’s brow antlered deer (R. e. thamin, Thomas Citation1918). A fourth subspecies R. e. hainanus, has been recently recognized from the Hainan Island, Southern China (Zhang et al. Citation2009). Among these, Sangai is the rarest with a localized population of about 100 adult individuals occurring in the southern fringe of the Loktak Lake in Manipur. In fact, the Indian subspecies was considered extinct until a small population of around 14 individuals was rediscovered in the early 1950s (Ranjitsinh Citation1975). Since then effective conservation measures have re-established the population. In the present study, we assessed levels of genetic diversity of R. e. eldii with their sister subspecies using mtDNA control region. Additionally, we compared the wild samples with the captive population, to visualize patterns of differentiation and examine genetic relationships with their sister subspecies.
Materials and methods
DNA extraction and sequencing
The tissue samples from dead and decaying carcasses and the faecal pellets of wild and captive populations of Sangai were collected from the KLNP and several zoos in India (Supplementary Table 1). The tissue samples were stored at −20 °C and fresh faecal samples were carefully collected and stored in 70% ethanol at room temperature. DNA was extracted from all the samples using the phenol/chloroform method (Sambrook et al. Citation1989) and GuHCl-based method (Gupta et al. Citation2013). PCR amplifications were carried out in 20μl volumes containing 10–40 ng of extracted genomic DNA containing 1 × PCR buffer, 2.0 mM MgCl2, 0.2 mM of each dNTP, 3 pmol of each primer, and 0.5 units of AmpliTaq Gold DNA polymerase (Applied Biosystem, Foster City, CA) using primer Cerv.tPro and CervCRH (Balakrishnan et al. Citation2003). The amplification conditions were as follows: 95 °C for 10 min, followed by 35 cycles at 95 °C for 45 seconds, 55 °C for 45 seconds and 72 °C for 1 min, with a final extension of 72 °C for 10 min. The efficiency and reliability of the PCR reactions were monitored using positive and negative control reactions. The PCR products were electrophoresed on 2% agarose gel and visualized under UV light in the presence of ethidium bromide dye. The amplified PCR product were treated with exonuclease-I and shrimp alkaline phosphatase (USB, Cleveland, OH, USA) for 15 min each at 37 °C and 80 °C, respectively to remove any residual primer. The cleaned PCR products were processed for bi-directional DNA sequencing using the Big Dye Terminator Cycle Sequencing Kit version 3.1 on an ABI 3130 Genetic Analyzer (Applied Biosystems, Foster City, CA). The quality of raw sequences was manually checked using the Sequencher version 4.7 software (Gene codes corporation USA) and editing of data was done with the BioEdit software (Hall Citation1999).
Statistical analysis
All the sequences were aligned using the CLUSTAL X program (Thompson et al. Citation1997) and alignments were checked by visual inspection. Mean pairwise differences between subspecies (Kimura’s 2-parameter) were generated in MEGA 7 (Kumar et al. Citation2016). DnaSP 5.0 was used to analyze the haplotype (h) and nucleotide (p) diversity (Librado & Rozas Citation2009). The Bayesian consensus tree was constructed using the Monte Carlo Markov Chain (MCMC) method by BEAST (version 1.7.5; Drummond & Rambaut Citation2007). Based on the partial sequence of mtDNA control region sequence, phylogenetic tree was generated using the Hasegawa–Kishino–Yano (HKY) model with a constant rate applied across the tree.
Results
Geographical distribution of haplotypes
We identified 15 haplotypes from 96 sequences. Of these, 10 were found in 37 samples of R. e. thamin, one was found in 30 samples of R. e. eldii, three were found in seven samples of R. e. siamensis, and one was detected in 22 samples of R. e. hainanus. We observed 36 variable nucleotides among 478 base pair long sequence (), thus accounting for 8.8% viable sites. Four distinct SNPs were detected in R. e. eldii on nucleotide (nt) positions (). The haplotype and nucleotide diversities of each population indicated that the haplotype diversity was high in R. e. thamin and R. e. siamensis, whereas no genetic diversity was observed in R. e. hainanus and captive and wild population of R. e. eldii. Based on Kimura’s 2-parameter model, the pairwise genetic distances between haplotypes fall in the range of 0.002–0.049, with the overall average at 0.027. The mean pairwise distance between the populations of R. e. thamin and R. e. eldii was 0.032 ± 0.008, R. e. thamin and R. e. siamensis was 0.032 ± 0.007 and R. e. eldii and R. e. siamensis was 0.039 ± 0.009. These analyses indicated a low pairwise distance between the R. e. eldii and R. e. thamin suggesting identical mtDNA lineage, whereas high pairwise distance was observed between R. e. eldii and R. e. siamensis.
Table 1. Polymorphic sites within 15 mtDNA control region haplotypes of Eld’s deer and the distribution of haplotypes in each population.
Phylogenetic status
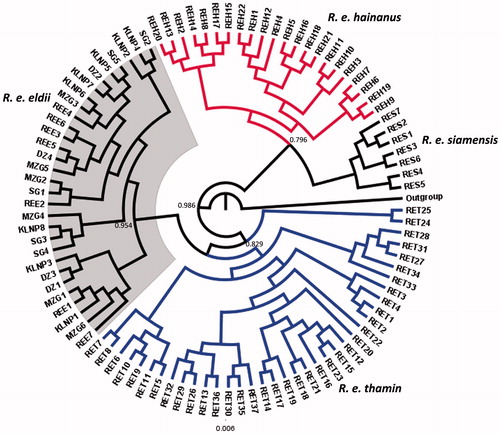
All the subspecies of Eld’s deer were explicitly assigned different clade (). Large proportion of genetic variations was identified in the R. e. thamin clade that indicated an unambiguous population structuring. The wild and captive populations of R. e. eldii exhibited single haplotypes and clustered together. The subspecies R. e. siamensis and hainanus were interspersed, which could reflect some degree of sequence variation within the sampled dataset themselves. It shows that the status of R. e. siamensis needs a formal study to examine its accurate taxonomic position. The results further indicated an explicit population structuring within R. e. thamin and R. e. siamensis population and significant genetic divergence between the subspecies. Diversity measures calculated for the R. e. thamin and R. e. siamensis showed that both the subspecies have high haplotype and nucleotide diversity, whereas R. e. eldii exhibited no variation in the nucleotides.
Figure 1. Bayesian (MCMC) consensus tree of 96 Eld’s deer sequences based in the mtDNA control region. Posterior values in percentage are provided at their respective nodes. The Elaphurus davidianus (AF291894) was used as an out group. Gray shade represents clade of captive and wild population of Sangai deer (R. e. eldii).
Discussion
In the present study, no nucleotide diversity was found in wild and captive populations of R. e. eldii which indicate evidence of the bottleneck effect. All individuals of R. e. eldii were represented by single haplotype with no genetic variation. It indicated a restricted gene flow among the wild and captive populations of R. e. eldii. A possible explanation for the lack of genetic diversity in R. e. eldii is the geographical isolation of this subspecies that prevented the gene flow. The fragmented populations adapted the local environmental conditions and utilized limited ecological resources available to them in the floodplains areas compared to its other subspecies may be another cause of low genetic diversity (Hussain et al. Citation2006). During the last few years, an increasing number of captive populations of R. e. eldii were established in different zoos in India from the source stock of Delhi Zoo, further magnifying the effect of inbreeding. Diversity indices were absent in R. e. eldii and R. e. hainanus, which indicates that the both the populations had gone through a genetic bottleneck in the past. Despite the low genetic distance between R. e. eldii and R. e. thamin and higher haplotypes in R. e. thamin population, the R. e. eldii clustered with the R. e. thamin in Bayesian consensus tree (). The phylogeography of R. e. eldii, R. e. thamin, and R. e. siamensis indicated clear population structuring and significant genetic divergence between the subspecies. The genetic relationship of Eld’s deer with related cervids suggest that it has a close affinity with the sambar (Rusa unicolor) and hog deer (Axis porcinus) that is closely related to the chital (Axis axis), and were grouped together as monophyly (Angom et al. Citation2015). The phylogeny of Eld’s deer subspecies revealed monophyly. R. e. eldii from Manipur showed a closest relationship with R. e. thamin than the R. e. siamensis. During the analysis, only one haplotype was detected in wild and captive populations of R. e. eldii. The lack of genetic diversity within the R. e. eldii indicates that the population is under inbreeding depression.
TMDN_A_1325335_Supplementary_Information.docx
Download ()Acknowledgements
We are grateful to the Department of Forests, Government of Manipur for granting us logistic support. We thank the Director and the Dean, WII for their support. We thank Dr Ruchi Badola, WII, for providing critical comments and suggestions.
Disclosure statement
There is no conflict of interest.
Additional information
Funding
Related Research Data
References
- Angom S, Gupta SK, Kumar A, Hussain SA. 2015. Identification of globally threatened cervids from problematic samples using cytochrome b and control region genes. Conser Genet Resources. 7:647–650.
- Balakrishnan CN, Monfort SL, Gaur A, Singh L, Sorenson MD. 2003. Phylogeography and Conservation Genetics of Eld’s deer (Cervus eldii). Mol Ecol. 12:1–10.
- Drummond AJ, Rambaut A. 2007. BEAST: Bayesian evolutionary analysis by sampling trees. BMC Evol. Biol. 7:214.
- Gray T, Brook NE, McShea SM, Mahood WJ, Ranjitsingh S, Miyunt MK, Hussain SA, Timmins R. 2015. Rucervus eldii. The IUCN Red List of Threatened Species 2015: e.T4265A22166803 [Internet]; [cited 2015 Nov 20]. Available from: http://dx.doi.org/10.2305/IUCN.UK.20152.RLTS.T4265A221668.en
- Gupta SK, Kumar A, Hussain SA. 2013. Extraction of PCR-amplifiable DNA from a variety of biological samples with uniform success rate. Conser Genet Resources. 5:215–217.
- Hall TA. 1999. BioEdit: a user-friendly biological sequence alignment editor and analysis program for Windows 95/98/NT. Nuc Acids Sym. 41:95–98.
- Hussain SA, Singsit S, Vaiphei N, Angom S, Kipgen K. 2006. The brow antlered deer of Manipur Cervus eldii eldii, McClelland 1842: A review of their status, ecology and conservation. Ind Forester. 132:40–50.
- Kumar S, Stecher G, Tamura K. 2016. MEGA7: molecular evolutionary genetics analysis version 7.0 for bigger datasets. Mol Biol Evol. 33:1870–1874.
- Librado P, Rozas J. 2009. DnaSP v5: a software for comprehensive analysis of DNA polymorphism data. Bioinformatics. 25:1451–1452.
- Lydekker R. 1915. Catalogue of the ungulate mammals in the British Museum (Natural History), Artiodactyla, Families Cervidae (Deer), Tragulidae (Chevrotains), Camelidae (Camels and Llamas), Suidae (Pigs and Peccaries), and Hippopotamidae (Hippopotamuses). British Museum Trustees, London vol IV.
- McClelland J. 1842. The Calcutta journal of natural history, Vol III. Dehra Dun (India): International Book Distributers.
- Ranjitsinh MK. 1975. Keibul Lamjao Sanctuary and the Brow-antlered deer – 1972 with notes on a visit in 1975. J Bomb Nat Hist Soc. 72:243–255.
- Sambrook J, Fritsch EF, Maniatis T. 1989. Molecular cloning: a laboratory manual. Cold Spring Harbor (NY): Cold Spring Harbor Laboratory Press.
- Thomas O. 1918. The nomenclature of the geographical forms of the Panolia deer (Rucervus eldi and its relatives). J Bomb Nat Hist Soc. 25:363–367.
- Thompson JD, Gibson TJ, Plewniak F, Jeanmougin F, Higgins DG. 1997. The Clustal X Windows interface: flexible strategies for multiple sequence alignment aided by quality analysis tools. Nuc Acids Res. 24:4876–4882.
- Zhang Q, Zeng Z, Sunlifeng SY. 2009. The origin and phylogentics of Hainan Eld’s deer and implications for deer conservation. Acta Theriol Sin. 29:365–371.