
Abstract
The mitochondrial DNA control region is the most polymorphic region of the mitochondrial genome. To infer the organization and variation of Tetraonidae mitochondrial DNA control region, the entire control region sequences of 18 species were analyzed. The length of the control region sequences ranged from 1127 bp (Bonasa sewerzowi) to 1156 bp (Centrocercus minimus). The average genetic distances among the species within the genera varied from 0.53% (Tympanuchus) to 9.42% (Bonasa). The average genetic distances showed insignificantly negative correlation with ts/tv. Five conserved sequence boxes in the domain II of Tetraonidae sequences were identified. The alignment of the Tetraonidae five boxes and CSB-1 sequences showed a few sequence variations. The results indicated that the genus Dendragapus might not be monophyletic.
Tetraonidae is a group of birds from the order Galliformes, including six genera, eighteen species. Lucchini et al. (Citation2001) preliminary described the structure of the mtDNA control region of Tetraonidae. But the rates and patterns of molecular evolution of Tetraonidae control region are not known. In the present study, we examined the organization and variation of the control region of Tetraonidae species retrieved from GenBank (). The aim is to characterize the structural features and patterns of sequence evolution of the Tetraonidae mitochondrial DNA control region.
Table 1 Species examined and source of sequence data in the present study.
A total of 18 species from 6 genera belonging to the Tetraonidae family were analyzed. All the Tetraonidae species had only one control region. The control region spans the region between the genes for tRNAGlu and tRNAPhe in the Tetraonidae species. The length of the control region is relatively conserved, about 1145 ± 11 bp, but that of Bonasa sewerzowi is only 1127 bp.
The average nucleotide composition of Tetraonidae control region sequences was as follows: 25.92%A, 33.65%T, 14.01%G and 26.43%C, with a bias against G. The amount of A + T was more than that of G + C among whole control region, especially in domain III, same as reported other avian control region (e.g. Marshall and Baker Citation1997; Ruokonen and Kvist Citation2002; Huang and Ke Citation2016).
Genetic distances between species ranged from 0.27% (between Tympanuchus phasianellus and Tympanuchus cupido) to 13.05% (between Tetrao urogallus and Bonasa sewerzowi), showing a wide range of divergences. The average genetic distances among the species within the genera varied from 0.53% (Tympanuchus) to 9.42% (Bonasa). The average genetic distances showed insignificantly negative correlation with ts/tv (r = −0.6852, p > .05).
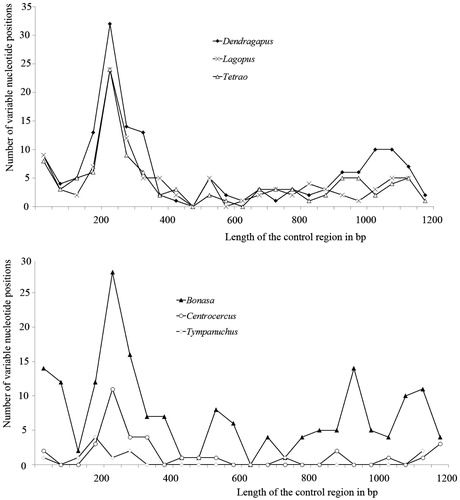
Nucleotide substitutions occur more frequently in peripheral domains. Average substitution rate for the three domains was 0.51:0.22:0.27, corresponding to relative proportions of 5:2:3, respectively. Among all the genera of Tetraonidae, domain I is the most variable of the three domains ().
Figure 1. Distribution of the variable sites in the control region. The number of variable sites within genera has been plotted in 50-bp intervals.
Five conserved sequence boxes in the domain II of Tetraonidae sequences were localized and identified as boxes F, E, D, C and B. These foxes were also identified by Randi and Lucchini (Citation1998) in Alectoris sequences, except B-box. In F-box, 21 of 28 nucleotide positions were fully conserved among the Tetraonidae sequences. There were both four nucleotide positions were variable in C-box and B-box, while there were only one and two nucleotide positions were variable in D-box and E-box, respectively.
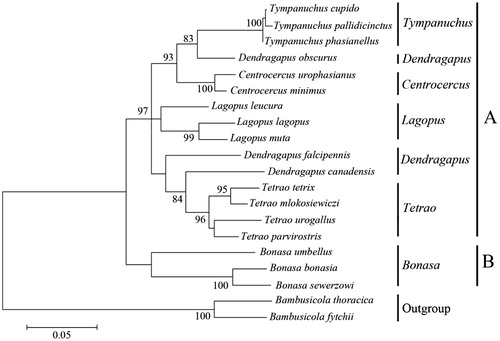
On the basis of hierarchical likelihood ratio tests (hLRTs) as implemented in ModelTest 3.0, the model general time reversible (GTR) model + gamma distribution (G) +invariable (I) was used (GTR + G +I, −lnL = 4643.26, AIC = 9372.72, BIC = 9711.70). Maximum likelihood method was used to reconstruct the phylogenetic trees based on GTR + G +I model. Member of Tetraonidae was formed an alone clade, as a sister to out-group (). Species of Bonasa was the first to split from the Tetraonidae lineage. All the genera could be discriminated by their distinct clades in the phylogenetic tree except Dendragapus. Our results indicated that the genus Dendragapus might not be monophyletic.
Figure 2. Phylogenetic tree of Tetraonidae constructed from mitochondrial DNA control region sequence. Numbers at nodes indicate bootstrap values (≥80%) from 1000 replications.
Disclosure statement
The authors report no conflicts of interest.
Additional information
Funding
References
- Huang ZH, Ke DH. 2016. Structure and evolution of the Phasianidae mitochondrial DNA control region. Mitochondrial DNA A DNA Mapp Seq Anal. 27:350–354.
- Li B, Zhu C, Ding P, Bai S, Cui J. 2016. Complete mitochondrial genome of black grouse (Lyrurus tetrix). Mitochondrial DNA A DNA Mapp Seq Anal. 27:134–135.
- Li XJ, Huang Y, Lei FM. 2014. Complete mitochondrial genome sequence of Bonasa sewerzowi (Galliformes: Phasianidae) and phylogenetic analysis. Zoolog Syst. 39:359–371.
- Lucchini V, Höglund J, Klaus S, Swenson J, Randi E. 2001. Historical biogeography and a mitochondrial DNA phylogeny of grouse and ptarmigan. Mol Phylogenet Evol. 20:149–162.
- Marshall HD, Baker AJ. 1997. Structural conservation and variation in the mitochondrial control region of fringilline finches (Fringilla spp.) and the greenfinch (Carduelis chloris). Mol Biol Evol. 14:173–184.
- Randi E, Lucchini V. 1998. Organization and evolution of the mitochondrial DNA control region in the avian genus Alectoris. J Mol Evol. 47:449–462.
- Ruokonen M, Kvist L. 2002. Structure and evolution of the avian mitochondrial control region. Mol Phylogenet Evol. 23:422–432.
- Shen YY, Liang L, Sun YB, Yue BS, Yang XJ, Murphy RW, Zhang YP. 2010. A mitogenomic perspective on the ancient, rapid radiation in the Galliformes with an emphasis on the Phasianidae. BMC Evol Biol. 10:132.