
Abstract
The complete mitochondrial genome sequence of pearl perch (Glaucosoma buergeri) was determined using a PCR-based method. The genome was 16,529 bp in length and included 37 genes (13 protein-coding genes, 22 transfer RNA genes, and two ribosomal RNA genes) and two non-coding regions (control region and origin of the light strand replication). A maximum likelihood analysis was conducted to confirm the phylogenetic position of this species using almost all the data available on Pempheriformes in the database. The complete mitochondrial genome sequence data obtained from our study would be useful for analyzing the evolutionary relationships of the Pempheriformes and population genetics of the Glaucosomatidae.
The Glaucosomatidae is a small monogeneric family comprising of four species, three of which are endemic to Australia, and one (Glaucosoma buergeri) is widely distributed from Western Australia to Southern Japan (Mckay Citation1997). Glaucosomatids are of commercial and recreational value in these areas. Therefore, molecular data of these species are indispensable for their resource management and conservation. However, the genetic information on glaucosomatids is insufficient as only partial genomic or mitochondrial DNA sequences of approximately 1000 bp have been registered in public databases. In the present study, we determined the complete mitogenome sequence of G. buergeri and conducted phylogenetic analysis including Pempheriform fishes that have been shown to be closely related to the glaucosomatids based on previous studies (Mckay Citation1997; Near et al. Citation2013).
A specimen of G. buergeri was purchased from the Kyoto City Central Wholesale Market in Kyoto Prefecture, Japan, and deposited at the National Museum of Nature and Science, Tokyo (Voucher number: NSMT-P 101224). The complete mitogenome of G. buergeri was determined by PCR-based sequencing using fish versatile primers (Miya and Nishida Citation1999; Satoh et al. Citation2016). The mitogenome (DDBJ accession number: AP018347) was 16,529 bp in length with a more highly conserved structural organization (typical 37 genes and gene order) compared with that of other teleost fishes. The overall base composition of the L-strand was characterized by A (27.97%), C (29.39%), G (16.6%), and T (26.02%) and is similar to that observed in most other fishes (Satoh et al. Citation2016).
To accurately determine the phylogenetic position of glaucosomatids and intra-family relationships, a supermatrix analysis (de Queiroz and Gatesy Citation2007) was performed using 23 complete and 20 partial mitogenome sequences of percomorphs. The resultant supermatrix tree strongly supported the monophyly of Glaucosomatidae and revealed that the glaucosomatids were most closely related to Pempheridae (). This close relationship observed in our study is supported by previous morphological analyses and nuclear gene studies (Tominaga Citation1986; Johnson Citation1993; Betancur et al. Citation2013; Thacker et al. Citation2015). Phylogenetic relationships within Glaucosomatidae were congruent with a previously published molecular study (Liu et al. Citation2010); G. hebraicum was placed as sister to a clade comprising G. scapulare and G. buergeri, and G. magnificum was placed at the most basal position within the glaucosomatids.
Figure 1. Supermatrix tree based on 23 complete and 20 partial mitogenome sequences of glaucosomatids and related species. Accession numbers are indicated before the species names. In the case of G. buergeri accessions, the location of collection is also indicated. Bootstrap values are indicated at each node. A backbone constraint tree was generated using complete mitogenome sequences (closed circles) by partitioned maximum-likelihood (ML) analysis. The analysis was conducted on a data matrix (13,439 positions) including all concatenated nucleotide sequences of the mitogenomes, except the ND6 gene. Gene sequences were aligned individually using the online version of MAFFT (http://mafft.cbrc.jp/alignment/server/; Katoh and Standley Citation2013), and ambiguous regions were trimmed using the online version of GBlocks with the least stringent settings (http://molevol.cmima.csic.es/castresana/Gblocks_server.html; Castresana Citation2000). Optimal partition model was determined using PartitionFinder ver 2 (Lanfear et al. Citation2017). Rapid bootstrap analyses were conducted with 1000 replications. Partitioned ML analyses were performed with RAxML-GUI ver. 1-5b1 (Silvestro and Michalak Citation2012) using the GTRGAMMAI nucleotide substitution model. The supermatrix tree was constructed based on 20 DNA barcode sequences (closed squares) that were prepared using the same methods as those used for the backbone tree with the GTRCAT model.
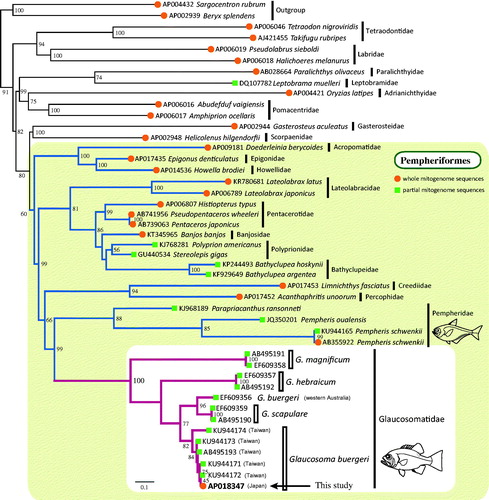
Results of phylogenetic analysis strongly supported the monophyly of each Glaucosoma species, with the exception of G. buergeri (EF609356) (). G. buergeri (EF609356) from Western Australia clustered with G. scapulare, a species that is mainly distributed in Eastern Australia and has been rarely collected from Western Australia, according to the Atlas of Living Australia (https://www.ala.org.au/), an international biodiversity database. This inconsistency in data could have resulted from an introgression between the two species or, although unlikely, from mislabeling of samples. It is also possible that G. buergeri has intraspecies variation, wherein G. buergeri population in the northern hemisphere is genetically diverse from that in the southern hemisphere. To test these hypotheses, further investigations are required using a larger sample size collected from widely distributed geographical locations.
Acknowledgments
I thank Dr. Taro Watanabe (Atmosphere and Ocean Research Institute, The University of Tokyo) for helping me to obtain the specimen, and Dr. Kaoru Kuriiwa in the fish laboratory of the National Museum of Nature and Science, Tokyo for registering the specimen. I would like to thank Enago (www.enago.jp) for the English language review.
Disclosure statement
The author reports no conflicts of interest. The author alone is responsible for the content and writing of this paper.
Additional information
Funding
Related Research Data
References
- Betancur RR, Broughton RE, Wiley EO, Carpenter K, López JA, Li C, Holcroft NI, Arcila D, Sanciangco M, Cureton IIJC, et al. 2013. The tree of life and a new classification of bony fishes. PLoS Currents.
- Castresana J. 2000. Selection of conserved blocks from multiple alignments for their use in phylogenetic analysis. Mol Biol Evol. 17:540–552.
- de Queiroz A, Gatesy J. 2007. The supermatrix approach to systematics. Trends Ecol Evol (Amst). 22:34–41.
- Johnson DG. 1993. Percomorph Phylogeny: Progress and Problems. Bull Mar Sci. 52:3–28.
- Katoh K, Standley DM. 2013. MAFFT multiple sequence alignment software version 7: improvements in performance and usability. Mol Biol Evol. 30:772–780.
- Lanfear R, Frandsen PB, Wright AM, Senfeld T, Calcott B. 2017. PartitionFinder 2: new methods for selecting partitioned models of evolution for molecular and morphological phylogenetic analyses. Mol Biol Evol. 34:772–773.
- Liu SH, Yeh WB, Mok HK. 2010. Phylogeny of Glaucosomatidae inferred from molecular evidence. J Fish Biol. 76:348–356.
- McKay RJ. 1997. FAO Species Catalogue. Volume 17. Pearl perches of the world (family Glaucosomatidae). An annotated and illustrated catalogue of the pearl perches known to date. Rome: Food and Agriculture Organisation of the United Nations; p. 26.
- Miya M, Nishida M. 1999. Organization of the mitochondrial genome of a deep-sea fish, gonostoma gracile (Teleostei: Stomiiformes): first example of transfer RNA gene rearrangements in bony fishes. Mar Biotechnol. 1:416–426.
- Near TJ, Dornburg A, Eytan RI, Keck BP, Smith WL, Kuhn KL, Moore JA, Price SA, Burbrink FT, Friedman M, Wainwright PC. 2013. Phylogeny and tempo of diversification in the superradiation of spiny-rayed fishes. Proc Natl Acad Sci USA. 110:12738–12743.
- Satoh TP, Miya M, Mabuchi K, Nishida M. 2016. Structure and variation of the mitochondrial genome of fishes. BMC Genomics. 17:719.
- Silvestro D, Michalak I. 2012. raxmlgui: a graphical front-end for RAxML. Org Divers Evol. 12:335.
- Thacker CE, Satoh TP, Katayama E, Harrington RC, Eytan RI, Near TJ. 2015. Molecular phylogeny of Percomorpha resolves Trichonotus as the sister lineage to Gobioidei (Teleostei: Gobiiformes) and confirms the polyphyly of Trachinoidei. Mol Phylogenet Evol. 93:172–179.
- Tominaga Y. 1986. The relationships of the families Glaucosomatidae and Pempheridae. In: Uyeno T, Arai R, Taniuchi T Matsuura K, editors. Indo-Pacific Fish Biology. Tokyo: Ichthyological Society of Japan; p. 595–599.