
Abstract
DNA barcoding has become a popular method of choice for identification of specimen based on molecular techniques. Here, we present preliminary findings on generating robust DNA barcode library of Cervids of India. The dataset comprising the DNA barcode library of seven deer species included in the genus Cervus, Axis and Muntiacus classified under family Cervidae. Mitochondrial Cytochrome C Oxidase subunit I gene of ca. 710 bp accepted widely as DNA barcode region, was used for generating species specific signature from 31 known samples of seven Indian deer species. Expectedly, the NJ tree clustered three genera i.e. Cervus, Axis and Muntiacus of Cervids of India into three clades. Further, the intra- and interspecies distances based on Kimura 2 parameter model also supported the results. The average intra- and interspecies sequence divergence were 0.011 (±0.09) and 0.65 (±0.14), respectively. The present study has exhibited that DNA barcoding has discriminating power to delineate boundaries among the closely related species. The data generated are of high importance to the law enforcement agencies in effective identification of species in wildlife offence cases. The similar approach can be utilized for generating DNA barcodes for other Indian mammals for making effective management and conservation action decisions.
Introduction
Indian subcontinent is a home to four mega biodiversity hot-spots among the 35 hot-spots around the world as defined by Conservation International (Myers et al. Citation2000). Of the known species that inhabits the Indian sub-continent, few species are endemic while many species have flourished through the course of evolution.
Majority of deer species are classified under family Cervidae, which is the second most diverse group in the world after family Bovidae. Deer are among the most abundant, visible and wondrous mammal with around 40 existing species in the world (Gaur et al. Citation2003). These deer (Cervidae) species are classified into sixteen genera and two subfamilies with five tribes (Gilbert et al. Citation2006; Hassanin et al. Citation2012). The subfamily, Cervinae composed of two tribes Cervini (with four genera i.e. Cervus, Axis, Dama, and Rucervus), the second is Muntiacus (genus: Muntiacus and Elaphodus) (Gilbert et al. Citation2006). However, in Indian subcontinent, seven deer species are present and classified under three genera namely Cervus, Axis and Muntiacus, where genus Cervus consisted with four deer species i.e. Hangul (Cervus hanglu hanglu), Swamp deer (Rucervus duvaucelii), Sambar (Rusa unicolor) and Brow antlered deer (Rucervus eldii); genus Axis composed with a species i.e. Chital (Axis axis) along with a sub-species Hog deer (Axis porcinus) and lastly, genus Muntiacus is composed of single species i.e. Barking deer (Muntiacus muntjak). In India, deer species are protected under the Wildlife (Protection) Act, 1972 (WPA) under different schedules (I, II, III and IV), moreover all species also protected under International Union for Conservation of Nature (IUCN) and Convention on International Trade in Endangered species (CITES) in different categories and appendix, respectively (IUCN, 2016; CITES, 2016). The detail conservation and population status are given in .
Table 1. List of seven Indian deer species, the number of individuals, Genus, distribution and conservation status of each used in the present study.
Last few decades, saw an unprecedented onslaught on the wild fauna as a result of poaching and habitat fragmentation. Deer are generally considered as a prey species to the large carnivores and forms an integral part of an ecosystem, hunted primarily for local consumption as well as for commercial benefits (Qureshi et al. Citation2004; Tordoff et al. Citation2005; Maxwell et al. Citation2007; Johnson Citation2010). Reckless poaching of deer has resulted in mortification of fragile ecosystem since the prey density becomes low, ultimately effecting food availability for carnivores like tigers, leopards, etc. At times during, wildlife crime, meat samples seized are in horrible condition and sometimes samples of multiple species are mixed in the single container and send for forensic examination. In such cases, it is necessary to generate a unified system for analysis of wildlife samples that can substantially delineate the species identification.
For over a long time, molecular genetics has been an indispensible tool for species identification, taxonomic classification and their correlation (Parson et al. Citation2000; Budowle et al. Citation2003; Ortea et al. Citation2009; Laakmann et al. Citation2013; Rajpoot et al. Citation2017). DNA barcoding is a simple technique with complex applications in biodiversity analysis and its assessment to generate a digital identification system. The cytochrome c oxidase subunit 1 (COI) has been designated as DNA barcode loci for mtDNA-based identification of animal specimens (Folmer et al. Citation1994; Hebert, et al. Citation2003). Few last decades have resulted in an exponential rise in the popularity of DNA barcoding to address different biological questions related to biodiversity using complex biological samples (Hebert, et al. Citation2003; Lahaye et al. Citation2008; Hajibabaei et al. Citation2011). The DNA barcoding methodology depends on the assumption that each species will have similar DNA barcodes representing its intraspecies variability. Information based on DNA sequences have widely been used in systematic, phylogenetic, phylogeography and species identification in wildlife forensics to address different biological questions (Hebert et al. Citation2004). The present study addresses the need for comprehensive DNA barcode database of all seven deer species in India to better integrate the wildlife management and wildlife law enforcement in India.
Materials and methods
Sample collection and laboratory procedure
A total of 31 samples of seven deer species inhabiting India were collected from different regions and stored as dried/fresh tissue in cryo vials till processing them for DNA extraction. Seven currently surviving Indian deer species i.e. Sambar (n = 5), Hangul (n = 5), Swamp deer (n = 5), Chital (n = 5), Hog deer (n = 3), Barking deer (n = 5) and Brow antlered deer (n = 3) were used in this study ().
Genomic DNA was isolated from these samples using the Qiagen DNeasy Blood and Tissue Kit (Qiagen, Valencia, CA) according to the instruction manual. Extracted DNA templates were amplified by polymerase chain reaction (PCR) using the universal primer of COI (Folmer et al. Citation1994).
The amplification through PCR (ABI 2700 Thermo Cycler) was executed using 2× PCR master mix (Thermo Fisher Scientific, Waltham, MA), 4 pm of each primer and approximately 45–50 ng of genomic DNA under subsequent condition: initial denaturation at 95 °C for 5 min, followed by 40 cycles of denaturation at 94 °C for 35 s, primers annealing at 45 °C for 1 min, extension at 72 °C for 45 s with a final extension at 72 °C for 15 min. Thereafter, 3.5 µl of PCR products were subjected to electrophoresis on 1.5% agarose gel and visualized over the transilluminator to detect the amplification. During the whole procedure, extraction and PCR blanks were incorporated into the analysis to check the contamination. Bidirectional sequencing of COI gene was performed using Big dye terminator cycle sequencing kit® v 3.1 (Kumar et al. Citation2014). The sequences reported in this paper have been submitted in NCBI GenBank and accession numbers are awaited.
Data analysis
Sequence data generated were analyzed by Sequence Analysis software v 5.2 (Applied Biosystems, Foster City, CA) and the forward and reverse sequences were trimmed and assembled using Cromas 2.6.4 (http://www.technelysium.com.au). After validating all obtained sequence data, multiple sequence alignment (MSA) was performed using CLUSTAL W as implemented in BioEdit v 7.0.9.0 software (Hall Citation1999). The intraspecies and interspecies distances were calculated using Kimura 2 parameter (K2P) model (Kimura 1980) as recommended by the Consortium for Barcode of Life (CBOL, http://www.barcoding.si.edu/protocols.html) using MEGA 7.0 software (Kumar et al. Citation2016). Evolutionary distances were calculated using neighbor-joining (NJ) method (Saitou and Nei Citation1987), and the phylogenetic tree was constructed with 1000 bootstrap replicates (Felsenstein Citation1985) using MEGA 7.0 (Kumar et al. Citation2016). The species identification success rate was calculated using genetic distance and BLAST methods. Reference DNA sequence of musk deer was downloaded from GenBank and was used as out-group for the analysis.
Results and discussion
Divergence assessment
The isolated genomic DNA for all 31 samples was of good quality. The obtained novel sequences of COI (658 bp) contained 479 conserved regions, 129 variable sites, 71 parsimony sites and 58 singleton sites. The BLAST result of COI sequences indicated that all seven Indian deer samples were matched with 99–100% with respective species. The maximum likelihood estimate of transition/transversion bias (R) was 11.18 whereas nucleotide composition of COI loci was A = 31.8%; T = 24.6%; C = 27.1% and G = 16.6%. Furthermore, the average intraspecies mean pairwise difference was 0.11 (± 0.09), while average interspecies sequences divergence was 0.65 (± 0.14). The observed variable sites position within the COI sequences of seven Indian deer species are shown in .
Table 2. Variable sites position in COI mitochondrial loci among Indian Cervids.
Determination of intraspecies and interspecies K2P distances
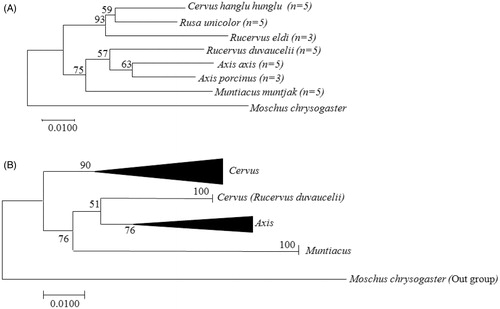
The obtained COI sequences clearly showed intraspecies and interspecies distance among seven deer species. The tree topology revealed that these seven Indian deer species were divided into two major groups, where clear intraspecies (within species level) and interspecies (genus level) distances were observed by using a K2P technique (). Among four species from genus Cervus included in the study, NJ tree, clustered an array of three species in one group (Hangul, Sambar and Brow antlered deer) with node support 59–93%, while Swamp deer was clustered in another group with genus Axis. The second group formed by genus Axis (Chital and Hog deer) and Muntiacus (Barking deer), also had an interesting inclusion of Swamp deer together with genus Axis as sister group with 57% node support. In genus Axis, the intraspecies K2P distance based on tree topology showed that Chital and Hog deer are clustered together with 63% node distance. Whereas in genus Muntiacus, Barking deer clustered separately from genus Axis with node distance of 75%. The interspecies distance in NJ tree also divided these three genera clearly with tree ranged from 52% to 91%.
Figure 1. The evolutionary relationship among Indian Cervidae using the Neighbor-Joining method (NJ) undertaken in MEGA 7.0. (A) Topology showing the intraspecies (species level) relationship between seven Indian deer species and (B) topology showing interspecies (genus level) relationship.
The evolutionary divergence based on intraspecies variation, in seven deer species, ranged from 0.45 (± 0.09) to 0.156 (± 0.023), whereas the maximum sequences divergence (0.156; ± 0.023) were observed between Brow antlered deer and Barking deer (). Between Cervus group the sequences divergences ranged from 0.045 (± 0.09) to 0.117 (± 0.016), where the maximum divergence (0.117; ± 0.016) was observed between Brow antlered deer and Swamp deer, whereas minimum divergence was observed (0.045; ± 0.09) between Hangul and Sambar. Moreover, in the Axis group, observed sequence divergence from Chital to Hog deer was 0.065 (± 0.012), while in Muntiacus, sequence divergence was absent since Barking deer was solitary representative of the group, albeit it showed minimum sequence divergences (0.116; ±0.017) from Chital ().
Figure 2. Estimates of evolutionary divergence over sequence pairs intraspecies (A) and interspecies (B). The numbers of base differences per site from averaging over all sequence pairs between groups are shown for n = 31 nucleotide sequences after removing all ambiguous positions for sequence pairs.
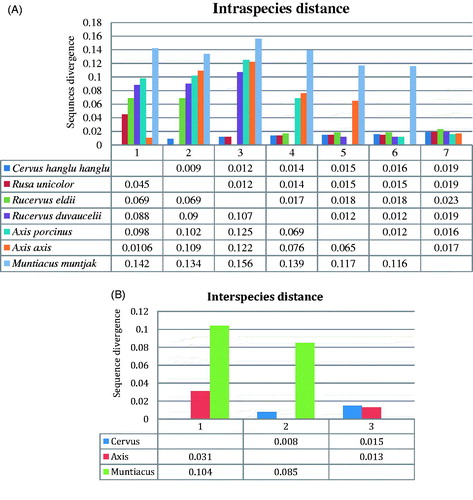
The evolutionary divergence based on interspecies variation, in three genus ranged from 0.031 (± 0.008) to 0.104 (± 0.015), among which, the maximum (0.104; ± 0.015) and minimum (0.031; ± 0.008) sequences divergence was observed between the genus Cervus to Muntiacus and Cervus to Axis, respectively. Moreover, the sequence divergence between Axis to Muntiacus was 0.085 (± 0.013) (). The DNA sequences of COI gene revealed that the obtained sequences are very helpful to delineate the Indian Cervids.
Conclusion
The present study unequivocally demonstrates the applicability of DNA barcodes using COI gene as a potential tool for identification of Cervids in Indian. Our data represent the validity of DNA barcodes in identification of mammalian species especially closely related deer species and a paradigm shift to focus on conservation of mammals through robust tools like DNA barcodes. These barcodes once developed could become potent tools in the hands of enforcement agencies entrusted with the responsibility of checking their illicit trade. In cases where meat samples, raw or finished products of deer species are seized, approach based on the present study would help in robust identification of closely related/multiple species Universally accepted DNA barcode gene when used in concatenation with other mitochondrial gene can deliver information on phylogeographic perspective of the data that would enable law enforcement agencies to track the geographic origin of the wild specimens and their derivatives in illicit trade. An effective check on their collection from wild, in turn, would help in their conservation in situ and wildlife management.
Acknowledgements
The authors are thankful to the Director, Dean and Research Coordinator, Wildlife Institute of India (WII), Dehradun, for their strong support. The authors would also like to thank Nodal Officer of Wildlife Forensic Cell to provide forensic facilities during my PhD research work.
Disclosure statement
The authors declare that they have no competing interests.
Related Research Data
Reference
- Budowle B, Allard MW, Wilson MR. Chakraborty. 2003. Forensics and mitochondrial DNA: applications, debates, and foundations. Annu Rev Genomics Hum Genet. 4:119–141.
- Convention on International Trade in Endangered Species of wild fauna and flora (CITES). 2015 www.cites.org Downloaded on 23 September 2017.
- Folmer O, Black M, Hoeh W, Lutz R, Vrijenhoek R. 1994. DNA primers for amplification of mitochondrial cytochrome c oxidase subunit I from diverse metazoan invertebrates. Mol Marine Biol Biotechnol. 3:294–299.
- Felsenstein J. 1985. Confidence limits on phylogenies: an approach using the bootstrap. Evolution. 39:783–791.
- Gaur A, Singh A, Arunabala V, Umapathy G, Shailaja K, Singh L. 2003. Development and characterization of 10 novel microsatellite markers from Chital deer (Cervus axis) and their cross–amplification in other related species. Mol Ecol Notes. 3:607–609.
- Gilbert C, Ropiquet A, Hassanin A. 2006. Mitochondrial and nuclear phylogenies of Cervidae (Mammalia, Ruminantia): systematics, morphology, and biogeography. Mol Phylogenet Evol. 40:101–117.
- Hassanin A, Delsuc F, Ropiquet A, Hammere C, Vuuren BJ, Matthee C, Couloux A. 2012. Pattern and timing of diversification of Cetartiodactyla (Mammalia, Laurasiatheria), as revealed by a comprehensive analysis of mitochondrial genomes. C R Biol. 335:32–50.
- Hajibabaei M, Shokralla S, Zhou X, Singer GAC, Baird DJ. 2011. Environmental barcoding: a next-generation sequencing approach for biomonitoring applications using River Benthos. PLoS One. 6:e17497.
- Hebert PDN, Penton EH, Burns JM, Janzen DH, Hallwachs W. 2004. Ten species in one: DNA barcoding reveals cryptic species in the neotropical skipper butterfly Astrapes fulgerator. Proc Natl Acad Sci USA. 101:14812–14817.
- Hebert PDN, Ratnasingham S, deWaard JR. 2003. Barcoding animal life: cytochrome c oxidase subunit 1 divergences among closely related species. Proc Biol Sci. 270:S96–S99.
- Hebert PDN, Cywinska A, Ball SL, deWaard JR. 2003. Biological identifications through DNA barcodes. Proc Biol Sci. 270:313–321.
- Hall TA. 1999. BioEdit: a user-friendly biological sequence alignment editor and analysis program for Windows 95/98/NT. Nucl Acids Symp Ser. 41:95–98.
- IUCN Red List of Threatened Species. Version 2017-2. www.iucnredlist.org. Downloaded on 23 September 2017.
- Johnson RN. 2010. The use of DNA identification in prosecuting wildlife traffickers in Australia: do the penalties fit the crimes? Forensic Sci Med Pathol. 6:211–216.
- Kimura M. 1980. A simple method for estimating evolutionary rates of base substitutions through comparative studies of nucleotide sequences. J. Mol. Evol. 16:111–120.
- Kumar VP, Kumar D, Goyal SP. 2014. Wildlife DNA forensic in curbing illegal wildlife trade: specie identification from seizures. Int J Fore Sci Pathol. 2:38–42.
- Laakmann S, Gerdts G, Erler R, Knebelsberger T, Martínez Arbizu P, Raupach MJ. 2013. Comparison of molecular species identification for North Sea calanoid copepods (Crustacea) using proteome fingerprints and DNA sequences. Mol Ecol Resour. 13:862–876.
- Lahaye R, Van der Bank M, Bogarin D, Warner J, Pupulin F, Gigot G, Maurin O, Duthoit S, Barraclough TG, Savolainen V. 2008. DNA barcoding the floras of biodiversity hotspots. Proc Natl Acad Sci USA. 105:2923–2928.
- Maxwell A, Nareth C, Kong D, Timmins R, Duckworth JW. 2007. Hog Deer (Axis porcinus) confirmed in the wild in eastern Cambodia. Nat Hist Bull Siam Soc. 54:227–237.
- Myers N, Mittermeier RA, Mittermeier CG, da Fonseca GA, Kent J. 2000. Biodiversity hotspots for conservation priorities. Nature. 24403: 853–858.
- Ortea I, Barros L, Gallardo JM. 2009. Closely related shrimp species identification by MALDI-ToF mass spectrometry. J Aquat Food Prod T. 18:146–155.
- Parson W, Pegoraro K, Niederstatter H, Foger M, Steinlechner M. 2000. Species identification by means of the cytochrome b gene. Int J Legal Med. 114:23–28.
- Qureshi Q, Sawarkar VB, Rahmani AR, Mathur PK. 2004. Swamp deer or Barasingha (Cervus duvauceli Cuvier, 1823). ENVIS Bull. 7:181–192.
- Rajpoot A, Kumar VP, Bahuguna A, Kumar D. 2017. Araniella cucurbitina: the first molecular evidence of a palearctic species of genus Araniella inhabiting India. Mitochond DNA Part A. 28:1–9. https://doi.org/10.1080/24701394.2017.1373105
- Saitou N, Nei M. 1987. The neighbor-joining method: a new method for reconstructing phylogenetic trees. Mol Biol Evol. 4:406–425.
- Kumar S, Stecher G, Tamura K. 2016. MEGA7: molecular evolutionary genetics analysis version 7.0 for bigger datasets. Mol Bio Evol. 33:1870–1874. https://doi.org/10.1093/molbev/msw054
- Tordoff AW, Timmins RJ, Maxwell A, Keavuth H, Vuthy L, Hourt KE, editors. 2005. Biological assessment of the Lower Mekong Dry Forests Ecoregion. pp. 192. WWF Greater Mekong Programme, Phnom Penh, Cambodia.