
Abstract
High-altitude inhospitable environments impose a formidable life challenge for the local animals. Training and exposure to high-altitude environments produce both distinct physiological and phenotypic characteristics. The mitochondrion, an organelle crucial for the energy production, plays an important role in hypoxia adaptation. In this study, we investigated the mitochondrial DNA (mtDNA) polymorphism and copy number variation between the population pairs from distinct altitudes across the multi-species. Higher mitochondrial DNA control region’s genetic diversity is conspicuous in high-altitude animals versus low-altitude relatives. We also found an accordant decrease of mtDNA copy number in most of the tissues from high-altitude animals. Compared to mammals, chickens have significantly distinct mitogenomic characteristics, and more significant changes in the skeletal muscle mtDNA copy number between high- and low-altitude individuals. Our study catches a snapshot of the biological similarities and differences in the mitochondrial high-altitude acclimation across the species.
Introduction
Hypobaric hypoxia is associated with the extreme environmental characteristics of high-altitude environments, which is much more than that of lowland environments at similar latitudes. This imposes strong selective pressure on high-altitude animal species, both native and migratory. Compared with low-altitude animals, these animals possess unique high-altitude physiological adaptations and evolutionarily derived complex genetic architectures (Grether Citation2005). Tremendous genomic analyses have identified a vast array of rapidly evolving genes, contributing to the phenotypic change in the high-altitude animals (Simonson et al. Citation2010; Qiu et al. Citation2012; Li et al. Citation2013; Lorenzo et al. Citation2014). Recent comparative genomic analyses have revealed convergence and divergence in the gene expression changes between the species while adapting to high-altitude environments (Tang et al. Citation2015; Tang et al. Citation2017). Mitochondria, having an indispensable role in the energy metabolism, being extremely sensitive to the different energy-related selective pressures, more than the nuclear genome, is a core feature of extreme high-altitude acclimatization (Shen et al. Citation2009; Murray and Horscroft Citation2016). Mitochondrial genetic and phenotypic variations for high-altitude adaptation have been reported in mammals, including, among others, the Tibetan yak, Tibetan sheep, Tibetan pig, and bar-headed goose (Scott et al. Citation2011; Gu et al. Citation2012; Nabholz et al. Citation2013; Hodgkinson et al. Citation2014; Li et al. Citation2016; Liu et al. Citation2016). In this study, focus had been laid on the mitochondrial genome and mitochondrial copy number in the population pairs from distinct altitudes within a particular species. An attempt has been made to catch a glimpse of the consistencies and differences in the mitochondrial signatures shaped by high-altitude adaptation across multi-species.
Materials and methods
The detailed information of the animals and geographical locations are shown in . The liver, brain, heart, lung, and skeletal muscle (the longissimus dorsi in four mammals and the chest muscle in chicken) were collected and used to extract complete DNA using MicroElute Genomic DNA kit (Omega, GA). Mitochondrial DNA (mtDNA) sequences from ten breeds were sequenced by an ABI 3730 DNA sequencer (Applied Biosystems, Foster City, CA). The mtDNA sequences in this study (GenBank accession numbers: MG837547-MG837556) were assembled manually using the computer program DNASTAR. A neighbor-joining tree was constructed using the Kimura 2-parameter method with software MEGA 6.0 (Tamura et al. Citation2013). Sequences of mitochondrial DNA D-loop region were downloaded from the GenBank () and were used to calculate the nucleotide diversity (π), using the DNAsp software (Librado and Rozas Citation2009).
Figure 1. Characteristics and phylogenetic analysis of mitogenome in five high-altitude species and their low-altitude relatives. (a) Detailed information of animals and geographical locations. b. Base content of mitochondrial genome across five species. c. Neighbor joining tree of five species, based on complete mtDNA sequences (Accession numbers: MG837547-MG837556); red branches denote high-altitude animals, and blue branches denote low-altitude animals.
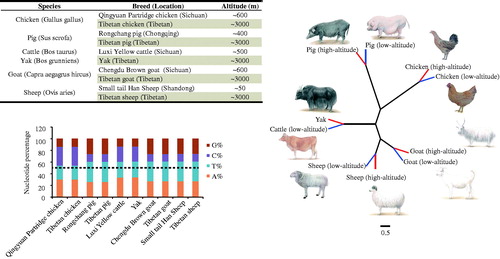
Table 1. Genetic diversity analysis of the mtDNA D-loop region between high-altitude (from Tibet) and low-altitude animals (mostly from Sichuan basin).
Relative amounts of nuclear DNA and mtDNA were determined using quantitative RT-PCR as previously described (Miller et al. Citation2003). The mitochondrial genes ATP6, COX1, and ND1 were used to quantify mtDNA. The GCG, AGRT1, SCD, CSN2β, and AGRT1, was used as the single-copy nuclear gene for pig, cattle/yak, sheep, goat, and chicken, respectively. Twice the ratio of ATP6/COX1/ND1 to single-copy nuclear gene number reflected the relative mtDNA content. Primer sequences used for mtDNA sequencing and mtDNA copy number detection are provided in Supplementary materials (available at https://doi.org/10.6084/m9.figshare.6603149).
Results and discussion
Characteristics and phylogenetic analysis of mitogenomes
The mitochondrial genome sequences of ten breeds, within five species (pig, cattle, sheep, goat, and chicken, from high- versus low-altitude regimes) were determined. Mitogenomes were all ∼16.5 kb in length with heavy nucleotide biases toward A and T (accounting for 60%), except in chicken (), which showed a relatively balanced nucleotide composition. Additionally, based on phylogenetic analysis, mammals sort into bird (chicken), omnivore (pig), and ruminant (goat, sheep, and cattle/yak) clades (), agreeing with established phylogenetic relationships across these species (Nabholz et al. Citation2009; Nabholz et al. Citation2013).
Nucleotide diversity of the mtDNA D-loop region
Mitochondrial DNA genetic markers can partly reflect the population fluctuations associated with local adaptations, especially the relatively sensitive mitochondrial control region (D-loop region) (Hassanin et al. Citation2009; Cheng et al. Citation2011). Here, we determined the similarities and differences in nucleotide diversity within the mtDNA D-loop region in a large-scale population analysis between high- and low-altitude species (). We observed relatively higher genetic diversity in the mtDNA D-loop region of high-altitude animals, which corresponds to previous results in the Tibetan pig (Li M et al. Citation2016), Tibetan sheep (Niu et al. Citation2017), Tibetan goat (Deng et al. Citation2017), and yak (Yue et al. Citation2016). We attribute the phenomenon to geographically isolating environments, and different domestication histories between the high- and low-altitude animals. Stronger artificial selection in low-altitude populations may contribute to the genetic diversity attenuation. Additionally, we found that different species exhibit different fold changes in the genetic diversity between high- and low-altitude populations, ranging from 1.05 in sheep to 15.6 in cattle/yak. The high-level diversity change in cattle/yak may be attributed to their highly diverged relationship (split from each other before 1.05–1.50 million years ago) (Qiu et al. Citation2012; Bai Citation2015). Interestingly, we found a significantly greater change in the genetic diversity (4.68 fold change in chicken, compared with 1.29 in pig, 1.11 in goat, 1.05 in sheep) between the pairs compared in bird than so in mammal.
Detection of mtDNA copy number
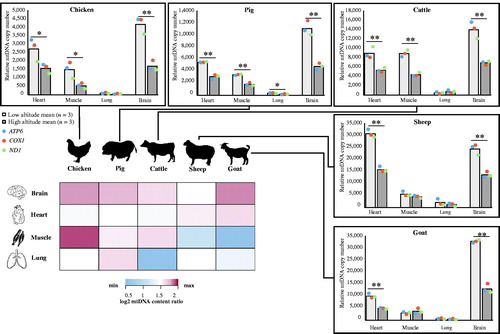
The decrease in mtDNA copy number associated with local animals living on the Tibetan Plateau has been demonstrated to be a long-term adaptive change contributed to high-altitude hypoxia adaption. We first investigated the mtDNA copy number in the population pairs from distinct altitudes within each group of a specific tissue (heart, skeletal muscle, lung, and brain) (). For most of these tissues, we found the mtDNA copy number of high-altitude animals were lower than low-altitude counterparts. The result is consistent with the previous observations of decreased mitochondrial content with a concurrent smaller production of reactive oxygen species (ROS) across the vertebrate animal tissues, both in vitro and in vivo, when exposed to chronic hypoxia (Zhang et al. Citation2008; Heather et al. Citation2012; Li Y et al. Citation2016; Niu et al. Citation2017; Jin et al. Citation2018). However, increase in mitochondrial density occur in the early phases of acclimatization in response to acute hypoxia, which increases the metabolic cost of oxygen at the expense of cell damage by harmful ROS (Luo et al. Citation2011; McElroy and Chandel Citation2017). Moreover, we found the mtDNA copy number in highly aerobic brain (Larson et al. Citation2014) and heart tissues (Nakada et al. Citation2017) to exhibit higher copy number levels than in other tissues, meanwhile exhibiting a relatively greater change ratio of mtDNA copy number between low- and high-altitude animals across five species (). The lung, as the primary respiratory organ, exhibited relatively blunting response to the altitude in mitochondrial content change across the five species, and the lowest copy number levels of the four tissues. Interestingly, we observed the greatest mtDNA copy number change in chicken skeletal muscle (). This observation raises the point that birds might have distinct mitochondrial phenotypic acclimatization processes for high-altitude hypoxia compared with mammals. Consistent with this, a previous study found hundreds of genes related to aerobic metabolism were differentially expressed in skeletal muscle between high- and low-altitude sparrows (Cheviron et al. Citation2008). Other studies have demonstrated different mtDNA sequence features (Nabholz et al. Citation2009) and physiological adaptations to high altitudes (Scott et al. Citation2009; Scott Citation2011; Murray and Horscroft Citation2016) between birds and mammals.
Figure 2. mtDNA copy number analysis of four tissues across five species, and a heatmap of mtDNA copy number ratio between low- and high-altitude animals (n = 3/group) in those four tissues. Student’s t-test, *p < 0.05, **p < 0.01. Colored entries represent the log2 mtDNA copy number ratio between low-altitude and high-altitude animals. The significant value was regarded as 1.5.
Conclusions
In this study, we determined pairwise differences in mitochondrial DNA polymorphism and copy number between high-altitude populations and low-altitude counterparts for each species. These mitochondrial gene sequence and content observations consistently indicate that birds have distinctly different mitochondrial acclimation processes to cope with high-altitude hypoxia than mammals. Our study provides insight to the general and specific characteristics of mitochondrial phenotypic acclimatization and genetic adaptation to high-altitude hypoxia in birds and mammals.
Supplemental Material
Download MS Word (24.3 KB)Disclosure statement
The authors report no conflicts of interest. The authors alone are responsible for the content and writing of this article.
Additional information
Funding
Related Research Data
References
- Bai JL. 2015. Phylotaxonomic position of Tianzhu white yak (Poephagus grunniens) based on nucleotide sequences of multiple subunits of cytochrome c oxidase. J Appl Anim Res. 43:431–438.
- Cheng Y, Jin X, Shi G, Wang R, Xu T. 2011. Genetic diversity and population structure of miiuy croaker populations in East China Sea revealed by the mitochondrial DNA control region sequence. Biochem Syst Ecol. 39:718–724.
- Cheviron ZA, Whitehead A, Brumfield RT. 2008. Transcriptomic variation and plasticity in rufous-collared sparrows (Zonotrichia capensis) along an altitudinal gradient. Mol Ecol. 17:4556–4569.
- Deng J, Feng J, Li L, Zhong T, Wang L, Guo J, Ba G, Song T, Zhang H. 2017. Polymorphisms, differentiation, and phylogeny of 10 Tibetan goat populations inferred from mitochondrial D-loop sequences. Mitochondrial DNA A DNA Mapp Seq Anal. 29:439–445.
- Grether GF. 2005. Environmental change, phenotypic plasticity, and genetic compensation. Am Nat. 166:E115–E123.
- Gu M, Dong X, Shi L, Shi L, Lin K, Huang X, Chu J. 2012. Differences in mtDNA whole sequence between Tibetan and Han populations suggesting adaptive selection to high altitude. Gene. 496:37–44.
- Hassanin A, Ropiquet A, Couloux A, Cruaud C. 2009. Evolution of the mitochondrial genome in mammals living at high altitude: new insights from a study of the tribe Caprini (Bovidae, Antilopinae). J Mol Evol. 68:293–310.
- Heather LC, Cole MA, Tan JJ, Ambrose LJ, Pope S, Abd-Jamil AH, Carter EE, Dodd MS, Yeoh KK, Schofield CJ, et al. 2012. Metabolic adaptation to chronic hypoxia in cardiac mitochondria. Basic Res Cardiol. 107:268.
- Hodgkinson A, Idaghdour Y, Gbeha E, Grenier J-C, Hip-Ki E, Bruat V, Goulet J-P, de Malliard T, Awadalla P. 2014. High-Resolution Genomic Analysis of Human Mitochondrial RNA Sequence Variation. Science. 344:413–415.
- Jin L, Mao K, Li J, Huang W, Che T, Fu Y, Tang Q, Liu P, Song Y, Liu R, et al. 2018. Genome-wide profiling of gene expression and DNA methylation provides insight into low-altitude acclimation in Tibetan pigs. Gene. 642:522–532.
- Larson J, Drew KL, Folkow LP, Milton SL, Park TJ. 2014. No oxygen? No problem! Intrinsic brain tolerance to hypoxia in vertebrates. J Exp Biol. 217:1024–1039.
- Li M, Jin L, Ma J, Tian S, Li R, Li X. 2016. Detecting mitochondrial signatures of selection in wild Tibetan pigs and domesticated pigs. Mitochondrial DNA A DNA Mapp Seq Anal. 27:747–752.
- Li M, Tian S, Jin L, Zhou G, Li Y, Zhang Y, Wang T, Yeung CKL, Chen L, Ma J, et al. 2013. Genomic analyses identify distinct patterns of selection in domesticated pigs and Tibetan wild boars. Nat Genet. 45:1431–1438.
- Li Y, Huang W, Yu Q, Cheng Y-T, Kong Q-P. 2016. Lower mitochondrial DNA content relates to high-altitude adaptation in Tibetans. Mitochondrial DNA A DNA Mapp Seq Anal. 27:753–757.
- Librado P, Rozas J. 2009. DnaSP v5: a software for comprehensive analysis of DNA polymorphism data. Bioinformatics. 25:1451–1452.
- Liu JB, Ding XZ, Guo TT, Yue YJ, Zeng YF, Guo X, Chu M, Han JL, Feng RL, Sun XP, et al. 2016. The complete mitochondrial genome sequence of the wild Huoba Tibetan sheep of the Qinghai-Tibetan Plateau in China. Mitochondrial DNA A DNA Mapp Seq Anal. 27:4689–4690.
- Lorenzo FR, Huff C, Myllymäki M, Olenchock B, Swierczek S, Tashi T, Gordeuk V, Wuren T, Ri-Li G, McClain DA, et al. 2014. A genetic mechanism for Tibetan high-altitude adaptation. Nat Genet. 46:951–956.
- Luo Y, Liao W, Chen Y, Cui J, Liu F, Jiang C, Gao W, Gao Y. 2011. Altitude can alter the mtDNA copy number and nDNA integrity in sperm. J Assist Reprod Genet. 28:951–956.
- McElroy GS, Chandel NS. 2017. Mitochondria control acute and chronic responses to hypoxia. Exp Cell Res. 356:217–222.
- Miller FJ, Rosenfeldt FL, Zhang C, Linnane AW, Nagley P. 2003. Precise determination of mitochondrial DNA copy number in human skeletal and cardiac muscle by a PCR‐based assay: lack of change of copy number with age. Nucleic Acids Res. 31:61e–e61.
- Murray AJ, Horscroft JA. 2016. Mitochondrial function at extreme high altitude. J Physiol (Lond.). 594:1137–1149.
- Nabholz B, Glémin S, Galtier N. 2009. The erratic mitochondrial clock: variations of mutation rate, not population size, affect mtDNA diversity across birds and mammals. BMC Evol Biol. 9:54.
- Nabholz B, Uwimana N, Lartillot N. 2013. Reconstructing the phylogenetic history of long-term effective population size and life-history traits using patterns of amino acid replacement in mitochondrial genomes of mammals and birds. Genome Biol Evol. 5:1273–1290.
- Nakada Y, Canseco DC, Thet S, Abdisalaam S, Asaithamby A, Santos CX, Shah AM, Zhang H, Faber JE, Kinter MT, et al. 2017. Hypoxia induces heart regeneration in adult mice. Nature. 541:222
- Niu L, Chen X, Xiao P, Zhao Q, Zhou J, Hu J, Sun H, Guo J, Li L, Wang L, et al. 2017. Detecting signatures of selection within the Tibetan sheep mitochondrial genome. Mitochondrial DNA A DNA Mapp Seq Anal. 28:801–809.
- Qiu Q, Zhang G, Ma T, Qian W, Wang J, Ye Z, Cao C, Hu Q, Kim J, Larkin DM, et al. 2012. The yak genome and adaptation to life at high altitude. Nat Genet. 44:946
- Scott GR. 2011. Elevated performance: the unique physiology of birds that fly at high altitudes. J Exp Biol. 214:2455–2462.
- Scott GR, Richards JG, Milsom WK. 2009. Control of respiration in flight muscle from the high-altitude bar-headed goose and low-altitude birds. Am J Physiol Regul Integr Comp Physiol. 297:R1066–R1074.
- Scott GR, Schulte PM, Egginton S, Scott AL, Richards JG, Milsom WK. 2011. Molecular evolution of cytochrome C oxidase underlies high-altitude adaptation in the bar-headed goose. Mol Biol Evol. 28:351–363.
- Shen YY, Shi P, Sun YB, Zhang YP. 2009. Relaxation of selective constraints on avian mitochondrial DNA following the degeneration of flight ability. Genome Res. 19:1760–1765.
- Simonson TS, Yang Y, Huff CD, Yun H, Qin G, Witherspoon DJ, Bai Z, Lorenzo FR, Xing J, Jorde LB, et al. 2010. Genetic evidence for high-altitude adaptation in Tibet. Science. 329:72–75.
- Tamura K, Stecher G, Peterson D, Filipski A, Kumar S. 2013. MEGA6: molecular evolutionary genetics analysis version 6.0. Mol Biol Evol. 30:2725–2729.
- Tang Q, Gu Y, Zhou X, Jin L, Guan J, Liu R, Li J, Long K, Tian S, Che T, et al. 2017. Comparative transcriptomics of 5 high-altitude vertebrates and their low-altitude relatives. Gigascience. 6:1–9.
- Tang Q, Huang W, Guan J, Jin L, Che T, Fu Y, Hu Y, Tian S, Wang D, Jiang Z, et al. 2015. Transcriptomic analysis provides insight into high-altitude acclimation in domestic goats. Gene. 567:208–216.
- Yue X, Liang Y, Liang Y, Li F. 2016. Comprehensive investigation of nucleotide diverdity in yaks. Anim Genet. 47:752–755.
- Zhang H, Bosch-Marce M, Shimoda LA, Tan YS, Baek JH, Wesley JB, Gonzalez FJ, Semenza GL. 2008. Mitochondrial Autophagy Is an HIF-1-dependent Adaptive Metabolic Response to Hypoxia. J Biol Chem. 283:10892–10903.