
Abstract
In this study, the complete mitochondrial genome of Nereocystis luetkeana was recovered through Illumina sequencing data. This complete mitochondrial genome of N. luetkeana was 37,399 bp in length and contained a compact gene coding structure, which accounts for 93% of whole genome. The mt genome of N. luetkeana encoded 63 genes including 37 protein-coding genes, 24 tRNA genes and 2 ribosomal RNA genes. The overall GC content of N. luetkeana cp genome is 35.0%. By phylogenetic analysis using whole genome-wide alignments through NJ method, N. luetkeana existed in a unique branch as a distinct genus, which showed a relative close relationship with the clade of Saccharina and Laminaria (Laminariaceae). This complete mitochondrial genome can be subsequently used for further evolution studies of brown algae and provide valuable insight into dynamic evolution of genome arrangements.
Bull kelp, N. luetkeana, is an annual species of subtidal brown macroalgae that serves as major biogenic habitat on the Pacific Coast of North America (Springer et al. Citation2007). They are ecologically important because they provide structure for a variety of other organisms and contribute substantial primary production to food webs within and below the photic zone. Blades of bull kelp balance drag reduction and sunlight exposure in different flow environments via changes in width and flatness (Koehl et al. Citation2008). The organelle genome information of N. luetkeana is still limited, even though lots of mt genomes from Laminariaceae have been available. In this study, the complete mitochondrial genome of N. luetkeana was recovered through Illumina sequencing data. This complete mitochondrial genome can be subsequently used for evolution studies of brown algae and provide valuable insight into dynamic evolution of genome arrangements.
The wild sample of N. luetkeana was collected from the coast line in Sequim, Washington, U.S.A (48.07°N, 123.04°W). Whole genomic DNA was extracted using CTAB method. Then the isolated DNA was used in high-through sequencing on Illumina Hiseq 2000 platform. Both dried sample and isolated DNA was stored at –20 °C in Key Laboratory of Marine Bioactive Substances in State Oceanic Administration. The raw reads sequenced by Illumina Hiseq 2000 platform were trimmed after quality filtration, then clean reads were assembled by SPAdes 3.6.1 (Bankevich et al. Citation2012) based on default settings. We used another mitochondrial genomes from Laminariaceae as reference sequences to align the contigs and identify gaps. To fill the gap, Price (Ruby et al. Citation2013) and MITObim v1.8 (Hahn et al. Citation2013) were applied and Bandage (Wick et al. Citation2015) was used to verify the circular structure. The mean sequencing coverage of this mt genome is 85X. This complete sequence was primarily annotated by Plann (Huang and Cronk Citation2015) combined with manual correction. All tRNAs were confirmed using the tRNAscan-SE search server (Lowe and Eddy Citation1997). Other protein-coding genes were verified by BLAST search on the NCBI website (http://blast.ncbi.nlm.nih.gov/), and manual correction for start and stop codons were conducted. The circular mt genome map was drawn using OrganellarGenomeDRAW (Lohse et al. Citation2007). This complete mt genome sequence together with gene annotations were submitted to GenBank under the accession numbers of MH392199.
The mitochondrial genome of N. luetkeana, with a length of 37,399 bp and contained a compact gene coding structure, which acount for 93% of whole genome. This mt genome possesses 63 genes, including 37 protein-coding genes, 2 ribosomal RNA genes (16S and 12S ribosomal RNA) and 24 tRNA genes. The overall GC content of the mt genome is 35.0%. The genome structure, gene order, GC content are similar to another mitochondrial genomes in Laminariaceae.
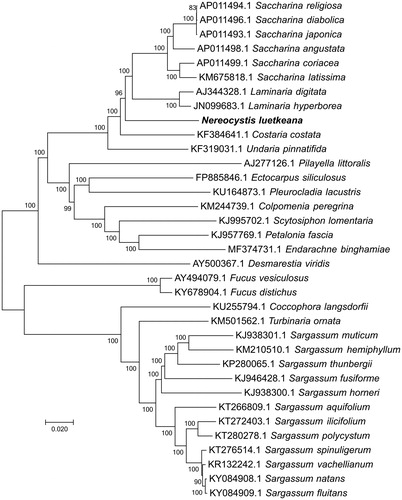
For phylogenetic analysis assessing the relationship of this species, we selected other 34 mitogenomes from brown algae to construct whole genome-wide alignments using HomBlocks (Bi et al. Citation2018), resulting in 28,674 characters in total, including almost all whole or partial PCGs and rRNA genes. The phylogeny tree () was constructed by NJ method under Maximum Composite Likelihood method with 1000 bootstrap calculations in MEGA 6 (Tamura et al. Citation2013). As expected, N. luetkeana existed in a unique branch as a distinct genus, which showed a relative close relationship with the clade of Saccharina and Laminaria (Laminariaceae).
Figure 1. Evolutionary relationships of 35 brown algae. The evolutionary history was inferred using the neighbor-joining method. The percentage of replicate trees in which the associated taxa clustered together in the bootstrap test (1000 replicates) are shown next to the branches. The tree is drawn to scale, with branch lengths in the same units as those of the evolutionary distances used to infer the phylogenetic tree. The evolutionary distances were computed using the Maximum Composite Likelihood method and are in the units of the number of base substitutions per site. The rate variation among sites was modeled with a gamma distribution (shape parameter = 4).
Additional information
Funding
Related Research Data
References
- Bankevich A, Nurk S, Antipov D, Gurevich AA, Dvorkin M, Kulikov AS, Lesin VM, Nikolenko SI, Pham S, Prjibelski AD, et al. 2012. “SPAdes: a new genome assembly algorithm and its applications to single-cell sequencing”. J Comput Biol. 19:455–477.
- Bi G, Mao Y, Xing Q, Cao M. 2018. “HomBlocks: a multiple-alignment construction pipeline for organelle phylogenomics based on locally collinear block searching”. Genomics. 110:18–22.
- Hahn C, Bachmann L, Chevreux B. 2013. “Reconstructing mitochondrial genomes directly from genomic next-generation sequencing reads—a baiting and iterative mapping approach”. Nucleic Acids Res. 41(13):e129.
- Huang DI, Cronk QCB. 2015. “Plann: a command-line application for annotating plastome sequences”. Appl Plant Sci. 3(8):1500026.
- Koehl MAR, Silk WK, Liang H, Mahadevan L. 2008. “How kelp produce blade shapes suited to different flow regimes: a new wrinkle”. Integr Comp Biol. 48:834–851.
- Lowe TM, Eddy SR. 1997. “tRNAscan-SE: a program for improved detection of transfer RNA genes in genomic sequence”. Nucleic Acids Res. 25:955–964.
- Lohse M, Drechsel O, Bock R. 2007. “OrganellarGenomeDRAW (OGDRAW): a tool for the easy generation of high-quality custom graphical maps of plastid and mitochondrial genomes”. Curr Genet. 52:267–274.
- Ruby JG, Bellare P, Joseph L. DRisi. 2013. “PRICE: software for the targeted assembly of components of (Meta) genomic sequence data”. G3: Genes| Genom| Genet. 3:865–880.
- Springer Y, et al. 2007. “Ecology and management of the bull kelp, nereocystis luetkeana: A synthesis with recommendations for future research.” A report to the Lenfest Ocean Program at the Pew Charitable Trusts.
- Tamura K, Stecher G, Peterson D, Filipski A, Kumar S. 2013. “MEGA6: molecular evolutionary genetics analysis version 6.0”. Mol Biol Evol. 30:2725–2729.
- Wick RR, et al. 2015. “Bandage: interactive visualization of de novo genome assemblies”. Bioinformatics. 31(20):3350–3352.