
Abstract
DNA barcoding is a rapid, precise and effective way of species identification. A short and standard target gene/genetic marker is used to create sequence profile of identified species against unidentified. Specific tag or marker is used, which is derived from mitochondrial COI for identification. Effectiveness of this method axes the degree of divergence among species. Compared to method of visible or external morphology, barcoding is more reliable. Labeo genus constitutes an imperative group of organisms with intense diversification and has a potential viable aquaculture importance in subcontinent. Identification is necessary for their representation. The genetic distances were computed, and neighbourhood-joining tree was constructed based on the Kimura 2 Parameter method. GenBank and BOLD revealed definitive identity matches. Conspecific and congeneric K2P nucleotide divergence was estimated. Evolutionary tree was analysed clearly by relating their species to phylogenetic tree, as same as species were bunched under same tree node, while species were differently clustered under distinct nodes. These finding concluded that the gene sequence may serve as milestone for identification and phylogenetic history of related species at molecular level.
Keywords:
Introduction
Fishes are the largest and most diverse class, estimated 30,000 in number (Eschmeyer et al. Citation2010). Identification of fish species is one of the most important tasks of taxonomy (Ward et al. Citation2009). Fish identification is traditionally based on external morphological features (Strauss and Bond Citation1990). Scientific debate concerning molecular method in taxonomy emerged as a more viable tool for identification (Teletchea Citation2010). Molecular identification is challenging, and DNA barcoding provides us a new perspective in fish systematic and ecology (Hubert et al. Citation2008). DNA sequence for identification gained global support as an applicable tool for identification, in particular fishes coordinated using FISH-BOL (Ward et al. Citation2009). Molecular approach involves sequencing and amplification of short universal mitochondrial COI for identification (Jenkins et al. Citation2012).
To the best of our knowledge, molecular identification has not been carried out from this region. Thus, the aim of this study was to identify species in proper representation, its divergence and lineage.
Materials and methods
Sampling of fish
Labeo bata samples were collected from River Chenab, Muzaffargarh (Lat: 30° 04' 31.33"N, Long: 71° 11' 31.67" E), Punjab, Pakistan. Samples were stored at fisheries laboratory, IP & AB, BZU, Multan.
Species identification
Samples were identified with the help of standard taxonomic key (Mirza and Sandhu Citation2007) on the basis of their morphometric characteristics.
Labeo bata (Hamilton Citation1822), Dorsal profile is slightly more convex than abdomen. Lips which is thin and continuous and lower one is reflected from off mandible and with shallow groove along its hind edge. Pair of maxillary barbels, Pharyngeal teeth, Dorsal fin is as high as head with concave upper edge and pectoral fin, deeply forked caudal fin. Fin Formula, B.iii, D. 10 (2/8–3/10), P. 16, V. 7, A. 7, C. 18, L. I. 35, L. tr. 6. (Sarma et al. Citation2017).
DNA isolation, quantification and PCR
DNA isolation was done by the modified phenol chloroform extraction method and DNA was stored at –20 °C until further analyses. DNA was quantified by measuring the absorbance at 260/280 nm with Nanophotometer (IMPLEN). PCR for amplification of genomic DNA and region of mitochondrial CO1 was performed. The most clarified samples were selected for the purpose of sequencing ().
Table 1. Voucher number, genetic distance, quantification and primer sequence for Labeo bata.
Analysis of the data
Sequence was analysed using BioEdit (7.0.5.3) following Hall (Citation1999) and K2P following Kimura (Citation1980). NJ trees (Saitou and Nei Citation1987) were constructed through MEGA version 5 software (Tamura et al. Citation2011). Sequence accession no#BOLD (AAV6679) and GenBank (YP_004285842.1) are as shown in .
Results
Molecular identification revealed similarity for consensus sequence. The average read lengths were 639 bp. Minimum, maximum and average K2P distances were found to be 0, 1.41 and .2, respectively, within species, while they were .11, 1.82 and .34, respectively, among same genus ().
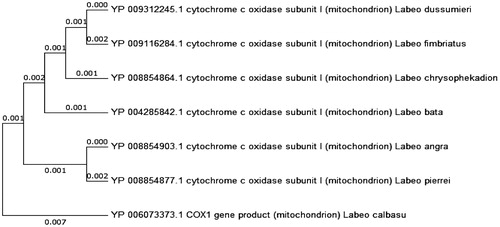
Labeo genus evolutionary analyses were conducted through Mega5 following Tamura et al. (Citation2011), and evolutionary history by maximum-likelihood method, based on the Tamura and Nei (Citation1993) ().
Figure 1. Neighbourhood-joining tree representing genetic relationship among Labeo species.
Discussion
A total of 650 base pairs of COI were used for specie identification (Lohman et al. Citation2009). Basic purpose for molecular analysis is to define the unidentified individual species to be identified, but, occasionally relatively surprisingly, can also central for detection of unpredicted diversity and unnoticed species (Kerr et al. Citation2009).
Absorbance comparison (260/280 nm) of 1.6–2, for pure samples (Cawthorn et al. Citation2011), as revealed in present study is in general agreement.
Mean intraspecific K2P distance was found to be .2% and intragenerically .34%, revealing more divergence among different species as freshwater Indonesian fishes of .15% and 2.53 (Hubert et al. Citation2015), Canadian freshwater fishes of .27% and 8.37% (Hubert et al. Citation2008), Australian freshwater fishes of .39% and 9.93% (Ward et al. Citation2005) and Indian freshwater fish than 0%–.90% and .10%–15.00% (Lakra et al. Citation2015) are in general agreement.
Molecular identification of genus Labeo by COI is used in molecular taxonomy marker for animal species (Luo et al. Citation2011). Primer COI is used for species and population divergence and identification (Khaliq Citation2012). Molecular identification is used to distinguish different species having higher resemblance morphologically.
Conclusion
Molecular identification is not a familiar practice in Pakistan. Study enlightens work importance for identification. Molecular approach is one of the useful identification techniques compared to various traditional identification methods. Subsequent identification method used for decades has many limitations as it does not work during the fish developmental body stages, and for processed fish, fish fillet and damaged specimen. Molecular approach also estimates the nucleic divergence among species, genus and family.
Disclosure statement
No potential conflict of interest was reported by the authors.
Related Research Data
References
- Cawthorn DM, Steinman HA, Witthuhn RC. 2011. Comparative study of different methods for extraction of DNA from fish species commercially available in South Africa. Food Control. 22:231–244.
- Eschmeyer WN, Fricke R, Fong JD, Polack DA. 2010. Marine fish diversity: history of knowledge and discovery (Pisces). Zootaxa. 2525:19–50.
- Hall T. 1999. Bioedit: biological sequence alignment editor and analysis program for Window 95/98/NT. Nucleic Acid Res. 41:95–98.
- Hubert N, Hanner R, Holm E, Mandrak NE, Taylor E, Burridge M, Watkinson D ,Dumont P, Curry A, Bentzen P, et al. 2008. Identifying Canadian freshwater fishes through DNA barcodes. PLoS ONE. 3:2490.
- Hubert N, Kadarusman WA, Busson F, Caruso D, Sulandari S, Nafiqoh N, Pouyaud L, Rüber L, Avarre J, Herder F, et al. 2015. DNA Barcoding Indonesian freshwater fishes: challenges and prospects. De Gruyter Open. 3:144–169.
- Hamilton F. 1822. An account of the fishes found in the river Ganges and its branches. Edinburgh & London, UK.
- Jenkins C, Chapman TA, Micallef JL, Reynolds OL. 2012. Molecular techniques for the detection and differentiation of host and parasitoid species and the implications for management. Insects. 3:763–788.
- Kerr KC, Lijtmaer DOA, Barreira AS, Hebert PD, Tubaro PL. 2009. Probing evolutionary patterns through DNA barcodes. PLoS One. 4:4379.
- Khaliq F. 2012. Isolation and sequencing of cytochrome oxidase C subunit 1 (COI) gene of Tor putitora [Thesis]. Pakistan: University of Sargodha.
- Kimura M. 1980. A simple method for estimating evolutionary rates of base substitutions through comparative studies of nucleotide sequences. J Mol Evol. 16:111–120.
- Lakra WS, Singh M, Goswami M, Gopalakrishnan A, Lal KK, Mohindra V, Sarkar UK, Punia PP, Singh KV, Bhatt JP, Ayyappan S. 2015. DNA barcoding Indian freshwater fishes. Mitochondrial DNA. 27(6):1–8.
- Lohman DJ, Prawiradilaga DM, Meier R. 2009. Improved COI barcoding primers for Southeast Asian perching. Mol Ecol Resour. 9:37–40.
- Luo A, Zhang A, Ho SY, Xu W, Zhang Y, Shi W, Cameron SL, Zhu C. 2011. Potential efficiency of mitochondrial genes for animal DNA barcoding: a case study using eutherian mammals. BMC Genomics. 12:84.
- Mirza MR, Sandhu IA. 2007. Fishes of the Punjab, Pakistan. Pakistan: Polymer Publications.
- Saitou N, Nei M. 1987. The neighbor-joining method: a new method for reconstructing phylogenetic trees. Mol Biol Evol. 4:406–425.
- Sarma KJ, Prajapati M, Mankodi PC. 2017. Morphological description and taxonomic Account of Labeo species (Cypriniformes, Family: Cyprinidae) from Gujarat. India J Ent Zool Std. 5:1120–1125.
- Strauss RE, Bond CE. 1990. Taxonomic methods: morphology. In: Schreck CB, Moyle PB, editors. Methods for fish biology. Maryland: Ameri Fish Soc.
- Tamura K, Nei M. 1993. Estimation of the number of nucleotide substitutions in the control region of mitochondrial DNA in humans and chimpanzees. Mol Biol E. 10:512–526.
- Tamura K, Peterson D, Peterson N, Stecher G, Nei M, Kumar S. 2011. MEGA5: molecular evolutionary genetics analysis using maximum likelihood, evolutionary distance, and maximum parsimony methods. Mol Biol E. 28:2731–2739.
- Teletchea F. 2010. After 7 years and 1000 citations: comparative assessment of the DNA barcoding and the DNA taxonomy proposals for taxonomists and non-taxonomists. Mitochondrial DNA. 21:206–226.
- Ward RD, Hanner R, Hebert PDN. 2009. The campaign to DNA barcode all fishes, FISH-BOL. J. Fish Biol. 74:329–356.
- Ward RD, Zemlak TS, Innes BH, Last PR, Hebert PD. 2005. DNA barcoding Australia’s fish species. Philos Trans R Soc Lond B Biol Sci. 360:1847–1857.