
Abstract
For DNA barcoding, the Cytochrome C Oxidase 1 gene (CO1) is a genetic marker used as uniform, testimonial authentication and reliable evidence for a universal species-level bio-cataloguing system compared with the morphological identification. The barcoding of Catla catla, Cirrhinus mrigala and Labeo rohita of family Cyprinidae was accomplished in the present study. Amplified CO1 gene through PCR was sequenced and figured out using bioinformatic tools. Conspecific and congeneric, K2P nucleotide deviation and nucleotide composition, the number of haplotypes and haplotype diversity were calculated. All three species of studied fish (C. catla, L. rohita and C. mrigala) were G-deficient (17.2, 17.8 and 18.5%) than C (28.3, 27.0, 27.3), A (25.2, 27.3, 26.8) and T (28.0, 28.5, 28.1), respectively. The mean intraspecific and intergeneric K2P genetic distance was .031% and 1.23%, respectively, with a high rate of transitional substitutions. Study revealed that C. catla followed the neutral evolution (R = .5), while C. mrigala (R = 2.01) and L. rohita (R = 2.84) deviated from it and offered very low genetic diversity (<.55).
Introduction
Cytochrome C Oxidase I (CO1), gene of mitochondrial DNA is applied as an appropriate genetic marker for an international bio-identification system to make a distinction in the majority of animal species (Elmeer et al. Citation2012). For the last few decades, a completely preserved tiny fragment of CO1 gene (655 bp) has been projected as standard barcode sequence for species recognition and evolutionary studies (Rach et al. Citation2008; Elmeer et al. Citation2012). Barcoding also resolved the complicatedness that taxonomists countenance for organism’s identification during different life stages from ovum to adult (Hanner et al. Citation2011). The mitochondrial CO1 gene offers different observations in environmental science and systematic of fishes (Hubert et al. Citation2008) and permits researchers to perceive ambiguous species to accomplish data practically and rapidly (Cowan et al. Citation2006). For the reason, throughout the world, scientists have established the databases and repositories of mitochondrial DNA sequences for all animals including fish species (Hanner et al. Citation2011; Akhtar and Ali Citation2016; Akhtar et al. Citation2017). The fish samples were randomly collected from Rawal Fish Hatchery (33.685786″N, 73.115217″E), Islamabad, and Mangla Lake, Mirpur AJK (33.232252″N, 73.739372″E). The labelled samples were packed in polyethylene bags and brought back to the Fisheries Laboratory, University of Azad Jammu and Kashmir, Muzaffarabad, for further analysis. After analysis, voucher specimens were preserved in 70% ethanol. To think about the probable problems with the recognition of species, all the voucher specimen were identified following Jhingran (Citation1991) and Mirza (1991). Genomic DNA was extracted by using standard phenol–chloroform protocol (Sambrook et al. Citation1989). Fish-specific sequencing primers for the CO1 gene of cyprinids species were designed using Primer 3 software. After sequencing and alignment, these sequences were deposited in GenBank for accession numbers (). The nucleotide composition, nucleotide and haplotype diversity were examined by MEGA6 and DnaSP 5.0 program.
Table 1. Details of COI gene sequences, voucher no, sequence length and GenBank accession numbers of three cyprinid spp.
Amplified PCR product were sequenced, and complete barcode’s fragments of 652 (Catla), 676 (Labeo) and 698 (mrigala) base pairs were obtained. The remarkable rate of transitional substitutions compared with transversional was noted. In C. mrigala, out of 698 consensus nucleotide sequence, 648 characters were constant and 50 were variable. Out of 50 variables, 47 were parsimony informative and 3 were singleton. The A + T contents were 53.2% and G + C contents were 46.8%, showing G-deficiency (18.5%) than A (25.2%), C (28.3%) and T (28.0%). The total number of haplotypes and haplotype (gene) diversity in C. mrigala was 7 and .917, respectively, while the average value of nucleotide diversity was .319. The mean intraspecific K2P genetic distance was .003 ± .001.
C. catla produced an average nucleotide length of 652 bps excluding sites with gaps and indels. Out of 652 sites, 634 (97.2%) sites were found to be conserved (monomorphic) and 18 (2.76%) were polymorphic. Three polymorphic sites were parsimony informative, while 15 were singleton. The estimated nucleotide frequencies in C. catla were T = 28.5, C = 27, A = 27.3 and G = 17.2. The A + T contents were 55.8%, and G + C contents were 44.2%. The total number of haplotypes in C. catla was 7 with the average value of haplotype diversity (Hd) being .911, while the average value of nucleotide diversity (Pi) was .549. The intraspecific K2P mean genetic distance was .002 ± .001. Overall sequence divergence between C. catla and C. mrigala was 1.126 ± .357.
The nucleotide composition of CO1 gene sequence was observed in L. rohita as G, 17.8%; A, 26.8%; C, 27.3%; T, 28.1%. The A + T contents were 54.9%, and G + C contents were 45.1%. Multiple sequence alignments of CO1 gene of L. rohita produced a consensus length of 676 base pairs. Out of that 611 were constant, 28 variable characters were singleton and 65 variable characters were parsimony informative. The estimated proportion of invariable sites was zero, and the configuration of the gamma parameter was anticipated as 22.60. The total number of haplotypes in L. rohita was 10 with .933 average haplotype diversity. Similarly, an average value of nucleotide diversity was .122. The mean intraspecific genetic distance was .026 ± .002. On the whole, sequence divergence between L. rohita and C. mrigala was .068 ± .008 and between L. rohita and C. catla was .041 ± .006.
Combined (three fish species) sequences analyses
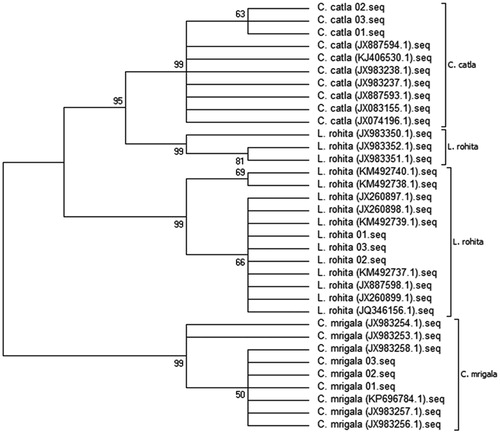
Combined sequence of these three different species was analysed together to form the collective phylogenetic tree. These species created three separate clades which support more than 50% bootstrap values. All samples of C. catla were grouped together with strong bootstrap support (95% posterior probabilities (pP), more than 50% from NJ), while the remaining samples of L. rohita form two subclusters which support more than 65% bootstrap values. Similarly, all the C. mrigala samples were clustered together in a cirrhinus lineage and form two subgroups. The C. mrigala was also positioned as a base of the tree. This consensus tree revealed that the sequences of and L. rohita are closely linked together with C. catla and C. mrigala ().
Figure 1. Neighbour-joining (NJ) tree showing relationships among three cyprinid species. (The number at each node represents the bootstrap value (%) based on 1000 pseudo-replications for NJ analysis).
All three species were G-deficient (17.2, 17.8 and 18.5%). Such type of nucleotides pattern was widely stated in many other fishes with the smaller variations (Khan et al. Citation2016; Akhtar and Ali Citation2016). It showed an obvious anti-G bias as appears commonly in teleost fishes (Zhu et al. Citation2013; Akhtar et al. Citation2017). Moreover, all these species assembled the high rate of transitional substitutions as compared to transversional as shown in other cyprinids (Karim et al. Citation2016; Akhtar and Ali Citation2016; Khan et al. Citation2016). In current investigation, sequences of C. catla follow the neutral evolution (R = .5), while C. mrigala (R = 2.01) and L. rohita (R = 2.84) deviated from it due to external mutations. Such type of deviation was also observed in Schizothoracinae (Ahmad et al. Citation2014; Akhtar and Ali Citation2016).
Examination of CO1 gene of all three species, Catla, Labeo and Mrigala, illustrated very low genetic diversity (<.55) which may be caused by factors such as minimum rate of evolution, decrease in long-term survival, incomplete lineage sorting, inbreeding due to the small size of population, reduced adaptation and fitness (DeSalle and Amato Citation2004; Frankham Citation2009). The loss of genetic diversity is directly correlating with the loss of population (Frankham Citation2009).
The best-fit ML model for the CO1 gene data of C. mrigala and C. catla was HKY, while for L. rohita, it was TN93 model as DNA evolution The mean calculated intraspecific K2P genetic distance (.031%) and mean intergeneric K2P genetic distance (1.23%) revealed that the mean nucleotide divergence between conspecific individuals (.28% and 10.81%) is much less than between Indonesian fresh water fishes (0.15% and 2.53%; Muchlisin et al. Citation2013) and Canadian freshwater fishes (0.27% and 8.37%; Hubert et al. Citation2008). The accuracy of DNA barcoding depends on the degree of severance between intraspecific and interspecific divergence (Chen et al. Citation2015). No insertions, deletions and stop codons were detected from analysed sequences of studied species which rationalized the aspect that the entire amplified sequences represent efficient mitochondrial CO1 sequences. The identification of species strictly on the morphological characters alone is quite unreliable because of considerable geographical and ecological variability. Phylogenetics, systematic and taxonomic study on the basis molecular characterization of indigenous fish species of Azad Jammu and Kashmir, Pakistan, are still highly fragmented and poorly resolved.
Disclosure statement
No potential conflict of interest was reported by the authors.
Related Research Data
References
- Ahmad SM, Bhat FA, Balkhi MH, Bhat BA. 2014. Mitochondrial DNA variability to explore the relationship complexity of Schizothoracine (Teleostei: Cyprinidae). Genet. 142:507–516.
- Akhtar T, Ali G. 2016. DNA barcoding of Schizothorax species from the Neelum and Jhelum Rivers of Azad Jammu and Kashmir. Mitochondrial DNA Part B. 1:934–936.
- Akhtar T, Shafi N, Ali G. 2017. DNA bar-coding of snow trout (S. plagiostomus) from Neelum and Jhelum rivers of Azad Jammu and Kashmir, Pakistan. Inter J Biosci. 10:302–310.
- Chen W, Ma X, Shen Y, Mao Y, He S. 2015. The fish diversity in the upper reaches of the Salween River, Nujiang River, revealed by DNA barcoding. Sci Reports. 5:17437.
- Cowan RS, Chase MW, Kress WJ, Savolainen V. 2006. 300,000 species to identify: problems, progress, and prospects in DNA barcoding of land plants. Taxon. 55:611–616.
- DeSalle R, Amato G. 2004. The expansion of conservation genetics. Nat Rev Genet. 5:702–712.
- Elmeer K, Almalki A, Mohran K, Al-Qahtani K, Almarri M. 2012. DNA barcoding of Oryx leucoryx using the mitochondrial Cytochrome C Oxidase gene. Genet. Mol. Res. 11:539–547.
- Frankham R. 2009. Genetic considerations in reintroduction program for top-order, terrestrial predators. Reintroduction of top-order predators. Blackwell Publishing Ltd.
- Hanner R, Floyd R, Bernard A, Collette BB, Shivji M. 2011. DNA barcoding of billfishes. Mitochondrial DNA. 22:27–36.
- Hubert N, Hanner R, Holm E, Mandrak NE, Taylor E, Burridge M, Watkinson D, Dumont P, Curry A, Bentzen P, et al. 2008. Identifying Canadian freshwater fishes through DNA barcodes. PLoS One. 3:24–90.
- Jhingran VG. 1991. Culture of air-breathing fishes and non-air-breathing predatory carnivorous fishes. Fish and Fisheries of India. 3rd ed. Delhi, India: Hindustan Publishing Corporation.
- Karim A, Iqbal A, Akhtar R, Rizwan M, Amar A, Qamar U, Jahan S. 2016. Barcoding of fresh water fishes from Pakistan. Mitochondrial DNA. 27(4):1–4.
- Khan F, Khattak NK, He D, Liang Y, Li C, Ullah D, Chen Y. 2016. The complete mitochondrial genome organization of Schizothorax Plagiostomus (Teleostei: Cyprinidae) from Northern Pakistan. Mitochondrial DNA Part A. 27:3630–3632.
- Kress WJ, Erickson DL. 2008. DNA barcoding—a windfall for tropical biology? Biotropica. 40:405–408.
- Mirza MR. 1991. A contribution to the systematics of the Schizothoracine fishes (Pisces: Cyprinidae) with the description of three new tribes. Pak J Zool. 23:339–341.
- Muchlisin ZA, Thomy Z, Fadli N, Sarong MA, Siti-Azizah MN. 2013. DNA barcoding of freshwater fishes from Lake Laut Tawar, Aceh Province, Indonesia. Acta Ichthyol Piscatoria. 43:21–29.
- Rach J, DeSalle R, Sarkar IN, Schierwater B, Hadrys H. 2008. Character-based DNA barcoding allows discrimination of genera, species and populations in Odonata. Proc R Soc Lond B Biol Sci. 275:237–247.
- Sambrook J, Fritschi E, Maniatis T. 1989. Molecular cloning: a laboratory manual. New York: Vol 1 Cold Spring Harbor Laboratory Press; p. E5.
- Zhu Y, Chen Y, Cheng Q, Qiao H, Chen W. 2013. The complete mitochondrial genome sequence of Schizothorax macropogon (Cypriniformes: Cyprinidae). Mitochondrial DNA. 24:237–239.