
Abstract
White type Channa argus, which has the common name of the great northern snakehead, has an uncertain classification for many years. In the present study, mitochondrial COI gene has been used to analyze the relationships and genetic diversity of nine kinds of Channa. For the Chnannidae family, the average of the inter-species genetic distance was 0.156 (ranged: 0.000–0.245). And the intra-species genetic distances were ranged from 0.000 to 0.002. For the haplotypes of two-colour morphs of Channa argus, the mean of the pair-wise genetic distances was estimated as 0.0009. This value was within the intra-species genetic distance interval, indicating that two-colour morphs of Channa argus are not subspecies of white type at the molecular level. Moreover, take Lateolabrax maculates and Epinephelus coioides as outgroups, molecular phylogenetic tree showed that all the haploids gather together as a branch and crossing each other. These indicated that the white type Channa argus should be regarded as an albino of bio colour type.
Introduction
The northern snakeheads C. argus (Perciformes, Channoidei, Channidae) is widely distributed in tropical and subtropical lakes, reservoirs, rivers, streams, ponds, ditches, marshes, and other fresh waters of Asia and Africa. It is generally dark green with large black blotches (Berra Citation2007; Bhat et al. Citation2014). However, in recent years, two distinct colour morphs of northern snakehead have been recognized in China (Ding Citation1994). The two-colour morphs have been regarded as distinct species by researchers (Kimura Citation1934; Shih Citation1936). However, more recent studies suggest that the two-colour morphs are colour variations of one single species (Wang et al. Citation1992, Citation1993). Similar findings were obtained via our previous studies (Zhou et al. Citation2016, Citation2017, Citation2018). In order to further elucidate the genetic relationship between the two-colour morphs as well as clarify genetic relationships among the family Channidae, the level of sequence divergence between them based on mitochondrial COI gene sequences was determined. Based on the results, the germplasm and the taxonomic position of white type C. argus were discussed. Our aims were to provide crucial genetic information for fisheries management and conservation of white type C. argus.
Materials and methods
Sample collection
All samples were identified according to morphological characters (Cheng and Zheng, Citation1987; Courtenay and Williams Citation2004). Tissue samples were taken as fin clips and preserved in 95% ethanol. Basic information of sampling sites and size (n) of Channa species were given in .
Table 1. Basic information of sampling sites and size (n) of Channa species.
DNA extraction
Total genomic DNA was extracted from the caudal fin using a standard extraction kit (DNeasy tissue kit, Baitaike Biotech Co., Ltd, China). The amplified primers were given in follows, COI-F: TGGCGGGAAGAGGAATTTAACCTCT; COI-R: AAGAAAGTGACA GAGCGGTTATGTG. The sizes of the amplified fragment length were 1693 bp (Zhou et al. Citation2016). The amplification reaction was carried out in 50 μl volumes consisting of 25 μl of 2× PCR mix buffer, 0.5 μl of 2.5 U/μl Taq DNA polymerase (Takara Bio Inc, Japan), 2 μl of 100 ng/μl DNA template, 2 μl of 10 mM each primer, and 18.5 μl ddH2O. Thermal cycling condition consisted of 94 °C for 5 min, followed by 35 cycles of 94 °C for 30 sec, annealing at 55 °C for 30 sec, and an extension temperature of 72 °C for 90 sec, and then final extension of 72 °C for 10 min. The PCR product was purified using the QIAquick PCR purification kit (Qiagen, Hilden, Germany). Sequencing was conducted on an ABI377 automatic sequencer with both forward and reverse primers.
Data analysis
The nucleotide sequences of mitochondrial COI gene were aligned using Clustal-X (Thompson et al. Citation1997) and then were edited and connected using BioEdit (Hall Citation1999). DNAstar was used to estimate the number of haplotypes and its frequencies (Excoffier et al. Citation2005). The dendrogram of nine populations was constructed using Kimura 2-parameter model in MEGA 6.0 based on the pairwise genetic distance (Tamura et al. Citation2013).
Results
Sequence variation and haplotype distribution
A total of 1693 bp was sequenced for COI gene of 75 individuals. And the complete sequences were aligned unambiguously with 1551 bp nucleotides sequences based on the sequences of other Chnannidae family species in the NCBI database. The variation sites, parsimony informative polymorphic sites, and the conversion/transversion ratio were 2.30.
Sixty nucleotide sequences define 3 haplotypes (WtcaHC1–C3) of white type C. argus and 3 haplotypes (BtcaHC1–C3) of bio colour type C. argus for COI gene (). The nucleotide sequences of all the test Channa species and haplotypes were submitted in GenBank (KU852434-KU852443). The sequences of WtcaHC1 and BtcaHC1 were the common haplotypes, and they have the largest number of distributions.
Table 2. Haplotype information of COI gene among white and bio-colour type C. argus.
Genetic distance analysis
Take Lateolabrax maculates and Epinephelus coioides as outgroups, sequences alignment was performed via MEGA6.0. The result showed that all the haploids gather together as a branch and crossing each other. Genetic distance was calculated based on the Kimura 2-parameter model. The results showed that the interspecific genetic distance was 0.000–0.245 among nine kinds of Channidae species. The maximum interspecific genetic distance was 0.002. The intraspecific genetic distance was 0.000 among different kinds of Channidae species ().
Table 3. Pairwise distances calculated using Kimura 2-parameter model for COI gene.
Phylogenetic tree analysis
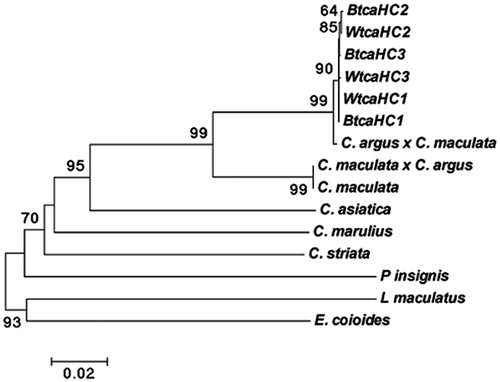
The molecular phylogenetic trees showed that all haplotypes were clustered into a single group with a high confidence value between the white and bio colour type C. argus. The phylogenetic tree was basically consistent with the NJ tree ().
Figure 1. Molecular phylogenetic tree constructed by NJ method based on COI gene using Kimura 2-parameter model. (High bootstrap values (>80%) in 1000 resamplings are shown at the corresponding nodes).
Discussion
Genetic characteristics of COI gene
The speed that the COI gene has evolved was relatively moderate. Thus, speed evolution is suitable for analysis of population and interspecific differences. In recent years, the speed evolution has been widely used for analysis of population genetic structure and phylogenetic aspects in variety of species, such as insects, crabs, shellfish, and fish (Boonkusol and Tongbai Citation2016; Dhar et al. Citation2016; Kartavtsev et al. Citation2016; Ojha et al. Citation2016). This study showed that abundant mtDNA polymorphism with the transition/transversion ratio up to 2.30 (COI) indicated that the nucleotide substitution did not reach saturation. This characteristic suggested that the mtDNA gene could be used as an effective molecular marker to identify different Channidae species.
Analysis of intraspecific and interspecific genetic distance
Research has shown that the genetic distances within species are generally less than 0.020, and most are less than 0.010 in 11 phyla, 13,320 species of animals (Hebert et al. Citation2003). Studies have shown that the genetic structure of C. striata populations in the COI region was largely shaped by a common origin (Siti-Balkhis et al. Citation2011). Previous studies have also shown that the COI gene is a very useful marker for unambiguous-species identification because of its characteristics of genetically conserved within-species (Boonkusol and Tongbai Citation2016; Lara et al. Citation2010). In the present study, by analyzing the sequences of COI gene, the average of intraspecific genetic distance was 0.000, and the maximum genetic distance between different haplotypes was 0.002. The average of intraspecific genetic distance and the maximum genetic distance was less than 0.010. It indicated that the white and bio colour type C. argus have not yet reached the level of subspecies differentiation. Therefore, it may correct the previous classification for the white type C. argus (Shih Citation1936).
Analysis of phylogenetic relationships
Phylogenetic information can estimate the biological related group, genetic relationship or effective and reflect the size of the development information of a gene, and the accuracy of constructing a phylogenetic tree (Takashima et al. Citation2004). NJ tree showed that all the selected Channidae species, not including the outgroups, were clustered together. Similarly, the phylogenetic tree that was constructed by haplotype sequences of the white and bio colour type C. argus showed that all haplotypes were clustered into one and cross each other. These results indicated that the white type should be served as an albino of bio colour type C. argus (Zhou et al., Citation2016, Citation2017, Citation2018) and the results have certain application values in phylogenetic and germplasm analysis. More molecular markers will be used for comprehensive analysis in order to obtain more objective data supports and to further validate the results of this study.
Acknowledgements
All of the procedures and animal handling were performed in accordance with the guide for the Chinese Association for Laboratory Animal Sciences. Approval of the study was obtained from the Animal Ethics Committee of South China Agricultural University. We also wish to express our appreciation to our anonymous reviewers for providing valuable comments on the manuscript.
Disclosure statement
The authors report no conflicts of interest. The authors alone are responsible for the content and writing of this article.
Additional information
Funding
References
- Boonkusol D, Tongbai W. 2016. Genetic variation of striped snakehead fish (Channa striata) in river basin of central Thailand inferred from mtDNA COI gene sequences analysis. J Bio Sci. 16:37.
- Berra TM. 2007. Freshwater fish distribution. Chicago: University of Chicago Press.
- Bhat AA, Haniffa MA, Milton MJ, Paray BA, Divya PR, Gopalakrishnan A. 2014. Genetic variation of striped snakehead (Channa striatus Bloch, 1793) populations using random amplified polymorphic DNA (RAPD) markers. Int J Bio Conser. 6:363–372.
- Cheng, QT, Zheng, BS 1987. Systematic search of fish in China. Beijing: Science Press; p. 456.
- Courtenay Jr WR, Williams JD. 2004. Snakeheads (Pisces, Channidae): a biological synopsis and risk assessment. Reston, Virginia: US Geological Survey Circular 1251.
- Dhar B, Ghose A, Kundu S, Malvika S, Devi NN, Choudhury A, Ghosh SK. 2016. DNA barcoding: molecular positioning of living fossils (Horseshoe Crab). In DNA barcoding in marine perspectives. Springer International Publishing. p.181–199.
- Ding RH. 1994. The fishes of Sichuan, China. 1st edn. Chengdu: Sichuan Science and Technology Press.
- Excoffier L, Laval G, Schneider S. 2005. Arlequin (version 3.0): an integrated software package for population genetics data analysis. Evol Bioinfo. 1:47.
- Hall TA. 1999. BioEdit: a user-friendly biological sequence alignment editor and analysis program for Windows 95/98/NT. Nuc Acids Symp Series. 41:95–98.
- Hebert PDN, Cywinska A, Ball SL, deWaard JR. 2003. Biological identifications through DNA barcodes. Proc Royal Soc London B: Biol Sci. 270:313–321.
- Lara A, Ponce De Leo NJL, Rodríguez R, Casane D, Côté G, Bernatchez L, García-Machado E. 2010. DNA barcoding of Cuban freshwater fishes: evidence for cryptic species and taxonomic conflicts. Mol Ecol Resour. 10:421–430.
- Kartavtsev YP, Sharina SN, Saitoh K, Imoto JM, Hanzawa N, Redin AD. 2016. Phylogenetic relationships of Russian far eastern flatfish (Pleuronectiformes, Pleuronectidae) based on two mitochondrial gene sequences, COI and Cytb, with inferences in order phylogeny using complete mitogenome data. Mitochondrial DNA. 27:667–678.
- Kimura S. 1934. Description of the fishes collected from the Yangtze-kiang, China, by the late Dr. K. Kishinouye and his party in 1927–1929. J Shanghai Sci Inst. 3:11–247.
- Ojha R, Jalali SK, Shivalingaswamy TM, Venkatesan T, Poorani J, Galande SM. 2016. Identification of insect community inhabiting Kaas plateau, Western ghats through cytochrome oxidase subunit I geneJ. J Appl Nat Sci. 8:2170–2174.
- Shih HJ. 1936. Notes on the labyrinth fishes of China. Bull Fan Memorial Inst Biol (Zool). 7:81–82.
- Siti-Balkhis AB, Jamsari AFJ, Hwai TS, Yasin Z, Siti-Azizah MN. 2011. Evidence of geographical structuring in the Malaysian Snakehead, Channa striata based on partial segment of the COI gene. Gen Mol Biol. 34:520–523.
- Takashima S, Ise H, Zhao P, Akaike T, Nikaido T. 2004. Human amniotic epithelial cells possess hepatocyte-like characteristics and functions. Cell Struct Func. 29:73–84.
- Tamura K, Stecher G, Peterson D, Filipski A, Kumar S. 2013. MEGA6: molecular evolutionary genetics analysis version 6.0. Mol Biol Evol. 30:2725–2729.
- Thompson JD, Gibson TJ, Plewniak F, Jeanmougin F, Higgins DG. 1997. The CLUSTAL_X windows interface: flexible strategies for multiple sequence alignment aided by quality analysis tools. Nucleic Acids Res. 25:4876–4882.
- Wang JX, Zhao XF, Zhuo CW, Liao ZG. 1992. Comparative studies on the Ophiocephalus argus and Ophiocephalus argus Kimurai, With the systematics of Ophiocephalus argus. Trans Oceanol Limnol. 2:51–57.
- Wang JX, Liao ZG, Zhang ZG, Zhao XF. 1993. Principal components analysis of the Ophicephalus argus complex (Pisces: Channidae). J Southwest China Normal Uni (Nat Sci). 2:168–172.
- Zhou AG, Chen JT, Xie SL, Chen YF, Zou JX. 2016. The complete mitochondrial genome of Ophicephalus argus kimurai (Perciformes: Channidae). Mitochondrial DNA Part A. 27:1419–1420.
- Zhou AG, Wang C, Jiang WZ, Li ZG, Chen YF, Xie SL, Luo JZ, Zou JX. 2017. Genetic comparison of two color morphs of northern snakehead (Channa argus) and Genetic relatedness among the family Chnannidae. Mitochondrial DNA Part A. 28:971–973.
- Zhou AG, Xie SL, Wang ZL, Fan LF, Wang C, Ye Q, Chen YF, Zou JX. 2017. Molecular evidence of two colour morphs of northern snakehead (Channa argus) based on mitochondrial 12S rRNA. Mitochondrial DNA Part B. 2:283–286.
- Zhou AG, Xie SL, Zhang CN, Wang ZL, Wang C, Feng YY, Chen YF, Zou JX. 2018. Investigations on genetic diversity and relationships among Channa species using AFLP-capillary electrophoresis. Ind J Fisheries. 65:66–71.