
Abstract
The spiny-flanked frog Quasipaa shini is distributed in southcentral China. Here, phylogenetic relationships and diversification of the species were examined using mitochondrial COI gene sequences of 70 individuals from eight populations. Phylogenetic analyses revealed that the species contained two deeply divergent clades (Clades I and II) and five subclades in Clade II. Haplotype network, AMOVA and genetic distance estimations also supported the separations of the six phylogroups. Based on the results, we proposed that at least the Clade I should represent a cryptic species. Neutrality tests indicated that all populations and clades have been probably suffered bottleneck effects or subdivisions.
Introduction
The spiny-flanked frog Quasipaa shini (Ahl Citation1930) is a member of the family Dicroglossidae (Amphibia: Anura; Frost Citation2018). It is commonly found in the mountain streams at 510–1500 m elevation in southcentral China, ranging from the northern Guangxi, Guizhou, extreme southern Hunan, to southern Chongong provinces (Fei et al. Citation2012). In this region, huge mountains (e.g. Nanling Mountains and Dayao Mountains) and deep valleys (e.g. major distributaries of Zhujiang River) were expected to promote diversification, especially in amphibians (Che et al. Citation2010). Whether the remarkable barriers promoted diversification, even speciation within the mountain frog Q. shini, is worth studying.
Because of global changes especially human activities, such as habitat destructions, excessive captures, and pollution, the population size of the spiny frogs including Q. shini has been declining sharply (Fei et al. Citation2009, Citation2012). In view of the serious threats and their high sensitivity to environmental factors, Q. shini was listed as the vulnerable (VU) species in the Red List of China’s Vertebrates (Jiang et al. Citation2016). However, information, especially about the diversification of the species, still remains scarce, and therefore, it is obligatory to develop strategies to make the status of the species clear for protecting it as soon as possible. Obviously, studies on diversification of the species would be a benefit for the conservation of its endemic germplasm resources.
In view of its rapid rate of evolution and maternal inheritance (Sun et al. Citation2012), Mitochondrial DNA (mtDNA) markers have been increasingly used for estimating levels of genetic diversity and recognizing cryptic species (Weiss et al. Citation2011; Liu et al. Citation2015; Wang et al. Citation2017). In this study, the mitochondrial cytochrome oxidase subunit I (COI) gene was used to examine the level of diversification in the frog Q. shini occurring from the mountains in the southcentral China. Our target is to explore: (1) whether there is significant population genetic structure even there are lineages that could be recognized as cryptic species; (2) whether the population genetic structure parallels with geographical structure.
Materials and methods
A total of 70 specimens of Q. shini were collected from eight localities (P1–P8) scattering in the distributional range of the species in southcentral China (; ). Tissues were collected and stored separately in 95% ethanol after specimen fixation. All specimens were preserved in the Chengdu Institute of Biology, Chinese Academy of Sciences (CIB, CAS). Total genomic DNA was extracted from the tissues using a standard phenol-chloroform extraction procedure (Sambrook et al. Citation1989). COI primers and PCR protocols were in accordance with Che et al. (Citation2012). PCR products were sent to Shanghai Generay Biotech Co. Ltd. (Shanghai, China) for sequencing in both the directions using the same primers as used in the PCR. The new sequences were deposited in the GenBank with accession numbers MK093217–MK093237.
Figure 1. Sampling localities in this study and phylogenetic relationships of Quasipaa shini. (A) Sampling localities (P1–P8) in this study. See information of populations P1–P8 in . Size of pie charts denoted beside localities is in proportion to number of samples, and different colors represent different clades/subclades. (B) Maximum likelihood tree based on COI gene sequences of haplotypes. Bootstrap supports of major nodes were denoted near them. Insert: the lower and upper frog photos are the phenotype of Clades I and II, respectively. (C) Haplotype network. The circle size is proportional to number of samples. Each subclade was surrounded by a dotted line. One white dot means one mutation step.
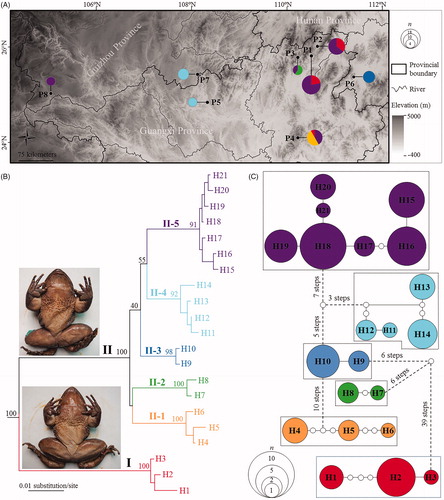
Table 1. Genetic diversity and neutrality tests of Quasipaa shini.
Sequences were aligned using MAFFT 6 (Katoh et al. Citation2002) with default settings and manually checked. Haplotypes were recognized using DnaSP 5 (Librado and Rozas Citation2009). Phylogenetic relationships of the haplotypes were reconstructed using maximum likelihood (ML), as implemented in the program PHYML 3.0 (Guindon et al. Citation2010). For the phylogenetic analyses, COI sequences of one Q. spinosa, one Q. jiulongensis, one Q. boulengeri and one Nanorana taihangnica were downloaded from GenBank (the accession numbers of them were FJ432700, KF199149, KC686711, and KJ569109, respectively) for use as outgroup according to Che et al. (Citation2010). For ML analyses, the best-fitting nucleotide substitution model was selected under the Corrected Akaike Information Criterion (AICc) implemented in JMODELTEST 2.1.7 (Guindon and Gascuel Citation2003; Darriba et al. Citation2012). The optimal nucleotide substitution model (GTR + I) was selected for these analyses. Non-parametric bootstrapping with heuristic searches of 1000 replicates was used to assess confidences of branches in ML trees.
Pairwise uncorrected p-distance between phylogroups were estimated using MEGA (Tamura et al. Citation2011). To visualize the relationships between haplotypes, a haplotype network was constructed using the maximum parsimony method in TCS 1.21 (Clement et al. Citation2000). Haplotype diversity (h) and nucleotide diversity (π) were estimated using DnaSP. Genetic signals of departure from neutrality or potential population expansion were estimated for populations and major clades using Tajima’s D (Tajima Citation1989) and Fu’ Fs (Fu Citation1997) statistics, estimated in DnaSP. The hierarchical distribution of overall diversity was determined using an Analysis of Molecular Variation (AMOVA), as implemented in Arlequin 3.11 (Excoffier et al. Citation2005).
Results
Alignments resulted in 504 base pair long sequences with 74 variable sites. A total of 21 haplotypes were recognized from 70 individuals of eight Q. shini populations. In ML tree, all Q. shini specimens were strongly clustered into one monophyly (). It contained two divergent clades, i.e. Clades I and II (). Clade I contained three haplotypes for nine specimens from three populations (i.e. populations P1, P2, and P4). Clade II contained 18 haplotypes for 61 specimens from all eight populations. So the two clades commonly existed in the populations P1, P2, and P4 (). Clade II was further clustered into five subclades (II-1∼II-5) but with unresolved relationships (). Subclades II-2 and II-5 commonly existed in population P3, and subclades II-1 and II-5 commonly existed in population P4 (). Other populations each have one subclade, i.e. P5 and P7 each only having subclade II-4, P6 only having subclade II-3 and P8 only having subclade II-5 (). The overall genetic distance on the uncorrected p-distance model was 4%. Genetic distance between Clades I and II was 9.4%, much higher than that within Clade I (0.3%) and that between five subclades in Clade II (from 2.5% to 4.4%), of which, the largest one was that between subclades II-1 and II-5, and the smallest one was that between II-4 and II-5. Genetic distance between populations was from 0.7% to 5.5%.
In the haplotype network, the two clades and five subclades of Clade I were all separated by estimations with 95% confidence intervals (). Clade I linked Clade II in 39 steps, and the links between five subclades in Clade II need three to ten steps (). The estimated haplotype diversity and nucleotide diversity were shown in . The total population had high h (0.941). In populations, population P2 had the highest h (0.901), and P1, P3, P4, and P7 also had relatively high h (>0.75), but P5 and P8 had zero h. In phylogroups, Clade II had a high h with 0.932, much higher than h of Clade I with 0.511. Subclades II-1, II-4 and II-5 had high h (>0.73), while II-2 and II-3 had low h (<0.67). The total population had middle π with 0.04046. In populations, populations P1–P4 had middle π > 0.025 but <0.052, and populations P5–P8 had very low π (<0.002). In phylogroups, Clade II had middle π with 0.02330, much higher than π of Clade I with 0.00322. All subclades of Clade I had very low π (<0.0046). When the total population was divided into two groups corresponding to two clades (Clades I and Clade II), AMOVA presented that 75.98% of the molecular variance was attributed to the differentiation among groups, whereas 21.18% of the molecular variance was derived from that within groups. When the total population was divided into six groups corresponding to six subclades (Clades I and five subclades of Clade II), the analyses showed that 91.68% of the molecular variance was attributed to the differentiation among groups, whereas 3.23% and 5.1% of the molecular variance was derived from that within groups and within populations, respectively.
In the total population, Tajima’s D and Fu’s Fs tests all resulted in positive values, though the Fu’s Fs value was significant (p < .05; ), suggesting that there was no recent population expansion. In populations, only P4 had negative but not significant Tajima’s D value (p > .05; ), and hence, all of the populations did not experience recent population expansion (). In phylogroups, only Clade I had negative but not significant Tajima’s D value (p > .05; ), and hence, all of clades/subclades also did not experience recent population expansion ().
Discussion
In this study, we explored the level of diversification of the mountain frog Q. shini through sampling populations almost across its distributional range in southcentral China (; Fei et al. Citation2012). Based on the mitochondrial COI gene sequences, usually used as the DNA barcoding (e.g. Smith et al. Citation2005; Borisenko et al. Citation2008; Tavares et al. Citation2011; Braukmann et al. Citation2017), our phylogenetic analyses resulted in two major clades including six subclades (), and similarly, the haplotype network divided all haplotypes into six groups in accordance with the six subclades (). These results indicated that there might be a cryptic species in the relative widely-distributed species of Q. shini. In general, integrative taxonomy together with morphological and molecular pieces of evidence advocated for recognizing new species with discontinuous or diagnostic morphological characters (e.g. Roxo et al. Citation2015; Li et al. Citation2018). Correspondingly, we found at least one exclusive morphological character for identifying Clades I and II: in Clade I, there was only one black spine on each orbicular wart on the chest of male in breeding seasons ( insert: the lower frog photo); but in Clade II, there were more than two black spines on each orbicular wart on the chest of male ( insert: the upper frog photo). Because the specimens of Clade II presented almost consistent morphology with the holotype and topotype of Q. shini in the description by Ahl (Citation1930), we recommended Clade I as a different species (Quasipaa sp.).
Although for the time being, we have not found diagnostic morphological characteristics between five subclades of Clade II, it did not conclude that there were no cryptic species in them. If we apply the 2% threshold of interspecific genetic divergence as a limit among species (as proposed by Smith et al. Citation2005), the five subclades with the genetic distance of more than 2.5% between each pair should be considered as different species. This fitted the viewpoint for using genetic divergence to separate species that stated that sufficient genetic distance indicated reproductive isolation between possible species or speciation (e.g. Paggi et al. Citation1998; Baric and Sturmbauer Citation1999; Ferguson Citation2002). De Queiroz (Citation2007) proposed that different species delimitations were derived from different methods using different properties (molecular or morphological) and/or focusing on different stages of the speciation process. The molecularly distinguished but morphologically undistinguished subclades (possible species) in this study probably indicated that discontinuous morphological differences between genetically divergent species are accumulating but was not enough for us to detect at present. In addition, the ecological differentiation as another factor for speciation should also be investigated in the future study. Finally, in view of the presence of deep genetic divergence and the lack of phenotypic discontinuities among local populations/subclades of the Q. shini Clade II, we suggested that this group should be a species complex similar to other problematic amphibian species complex or groups, such as Odorrana schmackeri species complex (Li et al. Citation2015) and Amolops mantzorum species group (Lu et al. Citation2014).
All detected clades/subclades of the Q. shini species complex should represent long-time evolutionary units of biodiversity. And our neutrality tests () indicated that all populations of the group have not experienced recent population expansions and might have experienced bottleneck effects or subdivisions (Miracle and Campton Citation1995). Furthermore, in the past decades, the population of the group has decreased because of habitat destructions and excessive captures (Fei et al. Citation2009, Citation2012), and thus, the species was listed as VU (Jiang et al. Citation2016). Therefore, it is important to protect each independent clade/subclade of the group as soon as possible to avoid losing the potential species diversity.
Acknowledgements
We would like to express our gratitude to editors and the anonymous reviewers for their critical comments on the manuscript.
Disclosure statement
No potential conflict of interest was reported by the authors.
Additional information
Funding
References
- Ahl E. 1930. Beiträge zur Lurch- und Kriechtierfauna Kwangsi’s. 3. Frösche. Sitzungsberichte Der Gesellschaft Naturforschender Freunde zu Berlin. 1930:315–319.
- Baric S, Sturmbauer C. 1999. Ecological parallelism and cryptic species in the genus Ophiothrix derived from mitochondrial DNA sequences. Mol Phylogenet Evol. 11:157–162.
- Borisenko AV, Lim BK, Ivanova NV, Hanner RH, Hebert PDN. 2008. DNA barcoding in surveys of small mammal communities: a field study in Suriname. Mol Ecol Resour. 8:471–479.
- Braukmann TW, Kuzmina ML, Sills J, Zakharov EV, Hebert PD. 2017. Testing the efficacy of DNA barcodes for identifying the vascular plants of Canada. PLoS One. 12:e0169515.
- Che J, Chen HM, Yang JX, Jin JQ, Jiang KE, Yuan ZY, Murphy RW, Zhang YP. 2012. Universal COI primers for DNA barcoding amphibians. Mol Ecol Resour. 12:247–258.
- Che J, Zhou WW, Hu JS, Yan F, Papenfuss TJ, Wake DB, Zhang YP. 2010. Spiny frogs (Paini) illuminate the history of the Himalayan region and Southeast Asia. Proc Natl Acad Sci USA. 107:13765–13770.
- Clement M, Posada D, Crandall K. 2000. TCS: a computer program to estimate gene genealogies. Mol Ecol. 9:1657–1660.
- Darriba D, Taboada GL, Doallo R, Posada D. 2012. jModelTest 2: more models, new heuristics and parallel computing. Nat Meth. 9:772.
- De Queiroz K. 2007. Species concepts and species delimitation. Syst Biol. 56:879–886.
- Excoffier L, Laval G, Schneider S. 2005. Arlequin (version 3.0): an integrated software package for population genetics data analysis. Evol Bioinform. 1:47–50.
- Fei L, Hu SQ, Ye CY, Huang YZ. 2009. Fauna sinica, amphibia Vol. 3, Anura ranidae. Beijing: Science Press.
- Fei L, Ye CY, Jiang JP. 2012. Colored atlas of Chinese Amphibians and their distributions. Chengdu: Sichuan Publishing House of Science and Technology.
- Ferguson JWH. 2002. On the use of genetic divergence for identifying species. Biol J Linn Soc. 75:509–516.
- Frost DR. 2018. Amphibian Species of the World Version 6.0. New York, USA: American Museum of Natural History. Available from: http://research.amnh.org/vz/herpetology/amphibia/ (accessed 20 October 2018).
- Fu YX. 1997. Statistical test of neutrality of mutations against population growth, hitchhiking and background selection. Genetics. 147:915–925.
- Guindon S, Dufayard JF, Lefort V, Anisimova M, Hordijk W, Gascuel O. 2010. New algorithms and methods to estimate maximum-likelihood phylogenies: assessing the performance of PhyML 3.0. Syst Biol. 59:307–321.
- Guindon S, Gascuel O. 2003. A simple, fast, and accurate algorithm to estimate large phylogenies by maximum likelihood. Syst Biol. 52:696–704.
- Jiang ZG, Jiang JP, Wang YZ, Zhang E, Zhang YY, Li LL, Xie F, Cai B, Cao L, Zheng GM, et al. 2016. Red list of China’s vertebrates. Biodiv Sci. 24: 500–551.
- Katoh K, Misawa K, Kuma K, Miyata T. 2002. MAFFT: a novel method for rapid multiple sequence alignment based on fast Fourier transform. Nucleic Acids Res. 30:3059–3066.
- Li YM, Wu XY, Zhang HB, Yan P, Xue H, Wu XB. 2015. Vicariance and its impact on the molecular ecology of a Chinese Ranid frog species-complex (Odorrana schmackeri, Ranidae). Plos One. 10:e0138757.
- Li SZ, Xu N, Lv JC, Jiang JP, Wei G, Wang B. 2018. A new species of the odorous frog genus Odorrana (Amphibia, Anura, Ranidae) from southwestern China. PeerJ. 6:e5695.
- Librado P, Rozas J. 2009. DnaSP v5: a software for comprehensive analysis of DNA polymorphism data. Bioinformatics. 25:1451–1452.
- Liu HX, Li Y, Liu XL, Xiong DM, Wang LX, Zou GW, Wei QW. 2015. Phylogeographic structure of Brachymystax lenok tsinlingensis (Salmonidae) populations in the Qinling Mountains, Shaanxi, based on mtDNA control region. Mitochondrial DNA. 26:532–537.
- Lu B, Bi K, Fu J. 2014. A phylogeographic evaluation of the Amolops mantzorum species group: cryptic species and plateau uplift. Mol Phylogenet Evol. 73:40–52.
- Miracle AL, Campton DE. 1995. Tandem repeat sequence variation and length heteroplasmy in the mitochondrial DNA D-loop of the threatened Gulf of Mexico sturgeon, Acipenser oxyrhynchus desotoi. J Hered. 86:22–27.
- Paggi L, Nascetti G, Webb SC, Mattiucci S, Cianchi R, Bullini L. 1998. A new species of Anisakis Dujardin, 1845 (Nematoda, Anisakidae) from beaked whales (Ziphiidae)-allozyme and morphological evidence. Syst Parasitol. 40:161–174.
- Roxo FF, Ochoa LE, Costa-Silva GJ, Oliveira C. 2015. Species delimitation in Neoplecostomus (Siluriformes: Loricariidae) using morphologic and genetic approaches. DNA Barcodes. 3:110–117.
- Sambrook J, Fritsch EF, Maniatis T. 1989. Molecular cloning: a laboratory manual. New York, USA: Cold Spring Harbor Laboratory Press.
- Smith MA, Fisher BL, Hebert PDN. 2005. DNA barcoding for effective biodiversity assessment of a hyperdiverse arthropod group: the ants of Madagascar. Philos Trans R Soc B. 360:1825–1834.
- Sun P, Shi Z, Yin F, Peng S. 2012. Genetic variation analysis of Mugil cephalus in China Sea based on mitochondrial COI gene sequences. Biochem Genet. 50:180–191.
- Tajima F. 1989. Statistical method for testing the neutral mutation hypothesis by DNA polymorphism. Genetics. 123:585–595.
- Tamura K, Stecher G, Peterson D, Fiipski A, Kumar S. 2011. MEGA6: molecular evolutionary genetics analysis using evolutionary distance. Mol Biol Evol. 28:2725–2729.
- Tavares ES, Gonçalves P, Miyaki CY, Baker AJ. 2011. DNA barcode detects high genetic structure within neotropical bird species. PLoS One. 6:e28543.
- Wang B, Xie F, Li JN, Wang G, Li C, Jiang JP. 2017. Phylogeographic investigation and ecological niche modelling of the endemic frog species Nanorana pleskei revealed multiple refugia in the eastern Tibetan Plateau. PeerJ. 5:e3770. DOI: 10.7717/peerj.3770.
- Weiss S, Marić S, Snoj A. 2011. Regional structure despite limited mtDNA sequence diversity found in the endangered Huchen, Hucho hucho (Linnaeus, 1758). Hydrobiologia. 658:103–110.