
Abstract
The Gray eel-catfish, Plotosus canius is a widely distributed species in Indo-West Pacific region and predominantly found in marine and brackish water. Although the recent genetics study evidenced the different population of P. canius from Southeast Asia, sampling from Indian water is required to assess the ample population structure. Hence, the current study is aimed to generate the DNA sequences of P. canius from Sundarban to recognize the genetic distinctiveness of the Indian population. Both P. canius and P. lineatus showed more than one clade in neighbor-joining (NJ) phylogeny. Further, the high genetic divergences in P. canius (5.2–11%) and P. lineatus (3.6–11%) depicted cryptic and diverse population. The median-joining network with 21 haplotypes also suggested unique haplogroup of P. canius from Sundarbans. However, more sampling of P. canius from diverse geographical locations and involving additional molecular markers would substantiate the conservation genetics and proper management.
1. Introduction
Fishes of the genus Plotosus (Family Plotosidae) are commonly known as the eel-tail catfish that are identified to be nine different species (Gomon and Taylor Citation1982). Plotosus canius and P. lineatus have cosmopolitan distribution, however, the other species have narrow distribution range. Plotosus canius is known from the Indo-West Pacific, coasts of India, Sri Lanka, Bangladesh and Myanmar, Indo-Australian Archipelago, Philippines, and Papua New Guinea. Plotosus lineatus is Indo-Pacific species, distributed in Red Sea, East Africa to Samoa, Japan, southern Korea, the Ogasawara Islands, Australia, Lord Howe Island, Palau and Yap in Micronesia, East Africa, and Madagascar (Eschmeyer Citation2012). Plotosus limbatus is distributed in the Indian Ocean, east coast of Africa, Knysna, South Africa. Plotosus nkunga is native to Western Indian Ocean, Kosi Bay to Knysna in South Africa, and possibly extending to Zanzibar, Tanzania. Plotosus fisadoha is native to Western Indian Ocean, Madagascar; P. papuensis is native to Asia and Oceania, New Guinea; P. abbreviates is native to Western Pacific; P. japonicas is native to Japan, including the Ryukyu island; and P. nhatrangensis is native to the Western Pacific and Vietnam (Froese and Pauly Citation2018).
Besides the original description, P. canius has been exclusively discussed on their morphology (Kumar Citation2012; Usman et al. Citation2013), fecundity (Khan et al. Citation2002), feeding biology (Leh et al. Citation2012), biological properties (Prithiviraj Citation2014), and bioactive properties (Prithiviraj and Annadurai Citation2012). Plotosus canius is an amphidromous and demersal bony and venomous catfish that prefers marine and brackish water habitats and predominantly found in estuaries, rivers, lagoons, and shallow waters (Prithiviraj and Annadurai Citation2012). In the recent past, the phylogeny and population genetics of P. canius is largely attempted from the Malaysian coastal waters and evidenced the genetic variability within the population (Khalili Samani et al. Citation2016). However, the genetics of P. canius has never been discussed from the Indian waters. Nevertheless, it is reported that the population of many fish species were genetically isolated due to alterations of their native biogeography (Pauly et al. Citation2002, Thomsen et al. Citation2012). Hence, the combined study of morphology, ecology, and molecular studies are necessary to know the species precisely.
The morphology and DNA barcoding technique are largely used in biodiversity research and evidenced as an effective combined approach for species identification (Hebert et al. Citation2003; Tyagi et al. Citation2017; Kundu, Kumar, Tyagi, et al. Citation2018), evaluating the fish diversity (Abdullah and Rehbein Citation2016; Laskar et al. Citation2018a), resolving the taxonomic uncertainty (Kundu, Kumar, Laskar, et al. Citation2018; Laskar, Kumar, Kundu, Tyagi, et al. Citation2018), and estimating the population genetics (Khalili Samani et al. Citation2016). Thus, the present study aimed to generate the DNA barcode data of P. canius from Indian waters and genetically compared with the available database sequences generated from the different geographical locations. The estimation of genetic divergence, phylogeny, and haplotyping might resolve the status of P. canius from Indian waters.
2. Materials and methods
2.1. Sample collections and morphological identification
Five specimens of P. canius were collected from different localities in Sundarbans (PCS ZSI 01: 21.76 N 88.07 E, PCS ZSI 02: 21.86 N 88.17 E, PCS ZSI 03: 21.89 N 88.57 E, PCS ZSI 04: 22.11 N 88.78 E, PCS ZSI 05: 22.19 N 88.95 E) and preserved in 70% molecular grade ethanol with proper voucher IDs at the Centre for DNA Taxonomy, Zoological Survey of India (ZSI), Kolkata (). A meager amount of muscle tissue was collected from each sample by using a sterile surgical blade for downstream molecular experiments and stored at −80 °C. The specimens were collected from outside the protected areas, thus no prior permission was required in this study. The morphological identification of the studied specimens was executed by following the previous literature and description (Gomon and Taylor Citation1982; Ng and Sparks Citation2002; Yoshino and Kishimoto Citation2008).
2.2. DNA extraction, PCR amplification, and sequencing
Genomic DNA was extracted by using the QIAamp DNA Investigator Kit (QIAGEN Inc., Germantown, MD) as per the standard protocol mentioned by manufacturing company. Each genomic DNA was checked in 1% Agarose gel and quantification of the DNA was determined by using the Nanodrop (Eppendrof, Hamburg, Germany). The published primer pairs, FishF1– 5′TCAACCAACCACAAAGACATTGGCAC3′ and FishR1– 5′TAGACTTCTGGGTGGCCAAAGAATCA3′ was used to amplify the partial cytochrome oxidase C subunit I (COI) segment of mitochondrial gene in a Veriti® Thermal Cycler (Applied Bio systems, Foster City, CA) (Ward et al. Citation2005). The 25 µl PCR mixture contains 10 pmol of each primer, 20 ng of DNA template, 1X PCR buffer, 1.0–1.5 mM of MgCl2, 0.25 mM of each dNTPs, and 0.25 U of Platinum Taq DNA Polymerase High fidelity (Invitrogen, Life Science Technologies, Carlsbad, CA). The PCR products were checked in 1% agarose gel and purified using a QIAquickR Gel extraction kit (QIAGEN Inc., Germantown, MD). Bi-directional sequencing of each sample was carried out in 48 capillary array 3730 DNA Analyzer (Applied Biosystems, Foster City, CA) following Sanger sequencing methods at the in-house sequencing facilities in ZSI, Kolkata.
2.3. Sequence check and dataset preparation
The generated forward and reverse chromatograms of each sample were checked by Sequence Scanner software (Applied Biosystems Inc., Foster City, CA). Further, the consensus sequence of each sample was assembled by the forward sequences and ‘reverse complementary’ of the reverse sequences. The final sequences were checked through the online nucleotide BLAST program and ORF finder to examine the complete alignment, insertion-deletion, and start-stop codons (http://www.ncbi.nlm.nih.gov/gorf/gorf.html). Finally, the sequences were submitted in the GenBank database to acquire the specific accession number. The generated sequences were preliminarily identified through online identification system, in GenBank with Nucleotide BLAST search and in the BOLD database with identification engine. Further, 57 publicly available mtCOI sequences of same and related species (P. canius = 29, P. nkunga = 3, P. lineatus = 20, P. limbatus = 3, and P. japonicas = 2) were acquired from the GenBank database after screening the collection localities. One sequence of Cephaloscyllium silasi (family Scyliorhinidae) was incorporated in the dataset as an out-group. Total 63 sequences were aligned using ClustalX software (Thompson et al. Citation1997) to form a combined dataset (515 bp) and analyzed the genetic distance and clustering pattern through Kimura 2 parameter (K2P) and neighbor-joining (NJ) tree by using MEGA6 (Tamura et al. Citation2013). The number of haplotypes of P. canius was estimated by using DnaSP 4.10.9 (Librado and Rozas Citation2009) and the identical sequences were considered as the same haplotype. Haplotype diversity (Hd) and nucleotide diversity (π) for different population of P. canius were calculated through DnaSP 4.10.9. The median joining networks of all haplotypes were drawn in NETWORK 4.6.1 (Bandelt et al. 1999).
3. Results and discussion
The studied specimens were identified as P.canius based on the dusky-brown coloration with a black dorsal fin tip and the long barbels on the nostrils that crosses the eyes (). The generated sequences showed 97% similarity with the GenBank sequences of P. canius (KX657716, MF588561, MF601472: collected from the Sundarbans, Bangladesh; MG495943: collected from the Sundarbans, India), P. nkunga (KF511562, collected from the Hooghly River, Kolkata, India), and Plotosus sp. (KJ959641, collected from the Hooghly River, Kolkata, India). Further, the generated sequences also showed 96.47% similarity with the BOLD system sequences of P. nkunga (GDK288-13, Yanum Estuary, Puducherry). Thus, the sequence similarity search mislead the identification of the studied samples in both GenBank and BOLD system. Hence, the genetic divergence was calculated for the studied dataset to confirm the distinctiveness of P. canius and P. nkunga. The overall mean genetic divergence was 12.8% observed in the studied dataset of five Plotosus species. Three species, P. japonicas, P. nkunga, and P. limbatus shows 0% intra-specific genetic divergence, while the other two species P. canius and P. lineatus shows 3.7 and 5.5% intra-specific genetic divergence, respectively. The inter-specific genetic distance was ranging from 5.1 to 22.7% in the studied dataset. The recently described P. japonicas showed 5.1, 7.2, 19.6, and 22.7% inter-specific genetic distance with P. lineatus, P. limbatus, P. canius, and P. nkunga respectively. Further, the high genetic divergence (13.9%) resulted in P. canius and P. nkunga. The sequence of P. nkunga (KF511562) showed 13.6% genetic divergence with the three sequences of P. nkunga (JF494190, JF494191, JF494192) and 0.6–8.1% genetic divergence with 33 sequences of P. canius. Hence, considering the genetic divergence and distribution pattern of P. nkunga in South Africa, we argued the identification of the specimens (Accession no. KF511562 in GenBank and Sequence ID, GDK288-13 in BOLD system) and should be treated as P. canius.
Figure 1. (A) Collection locality map of P. canius in Sundarbans, Eastern India. (B) Lateral view of P. canius (C) Dorsal view of head (D) Ventral view of head (E) Pelvic and anal fins (F) Neighbor-joining tree of Plotosus species shows high genetic variability of P. canius (Green color shade) and P. lineatus (Blue color shade) specific to the different geographical locations. The mtCOI sequence of Cephaloscyllium silasi (family Scyliorhinidae) was used as an out-group in the phylogeny (G) Median-joining network shows 21 different haplotypes and distant populations of P. canius from India in comparison with Southeast Asia. Haplotypes are shown in different color circles that are also superimposed in the phylogeny.
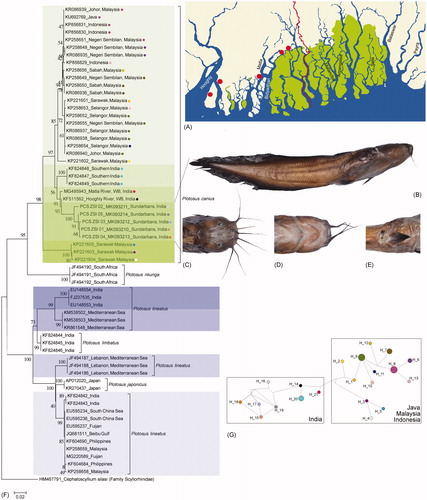
The NJ phylogeny showed distinct clades of the studied species with high bootstrap support. Three distinct clades were revealed in the phylogeny represented by P. japonicas, P. nkunga, and P. limbatus each. However, the mtCOI sequences of P. canius showed five clades (Malaysia + Indonesia + Java clade, Southern India clade, WB-India clade, Sundarbans-India clade, and Malaysia clade) in the studied dataset with >85 bootstrap supports (). The P. lineatus also showed four clades (Indian clade, Mediterranean Sea clade, Lebanon-Mediterranean Sea clade, and India + South China Sea + Fuijan + Beibu Gulf + Philippines + Malaysia clade) in the studied dataset with >99 bootstrap supports. The five different clades of P. canius showed 0–0.8% within-group genetic divergence in the studied dataset. The generated sequences of P. canius by Sundarbans-India clade represent 3.3% genetic divergence with the closest WB-India clade, however, showed 5.2, 5.8, and 11% genetic divergence with the Southern India clade, Malaysia + Indonesia + Java clade, and Malaysia clade, respectively. The four different clades of P. lineatus showed 0–0.2% within-group genetic divergence in the studied dataset. The Indian clade of P. lineatus showed 3.6% genetic divergence with Mediterranean Sea clade, 10.5% genetic divergence with Lebanon- Mediterranean Sea clade, and 11% genetic divergence with India + South China Sea + Fuijan + Beibu Gulf + Philippines + Malaysia clade. In the recent past, the five populations of P. canius were demonstrated by mtCOI gene from Malaysian waters (Khalili Samani et al. Citation2016). Further, the high intraspecific genetic variability was also detected in P. lineatus (Bariche et al. Citation2015). In the present study with mtCOI gene also resulted in high-genetic variability in both P. canius and P. lineatus, which depicted cryptic diversity correlated with the different population from diverse geographical locations. The studied sequences of P. canius resulted in 21 haplotypes with 75 polymorphic sites, Hd= 0.95 and π = 0.035 in the studied dataset. The median-joining network depicted two distinct clustering of P. canius collected from Java + Indonesia + Malaysia and India. Further, the generated sequences of P. canius from Sundarbans, India resulted in shallow clustering discrepancy in the P. canius from Southern India and WB (West Bengal), India (). Hence, the high-genetic variability, distinct clade in NJ phylogeny, halpotyping, and clustering pattern in median-joining network evidenced the distinct population of P. canius in Sundarbans, eastern India.
The Sundarbans is the largest mangrove forest in the coastal region of the Bay of Bengal. This unique landscape is regarded as a UNESCO World Heritage site, shared by both India and Bangladesh. This region is well known for containing numerous endemic, ecologically, economically important flora and fauna and is an important habitat for many Endangered and distinct evolutionary significant unit of Bengal tiger (Singh et al. Citation2015). It is reported that the alteration of biogeography, directly influence the population structure through species dynamics, colonization, and isolation (Costello et al. Citation2003). Further, for acclimatization of any species in a foreign environment, the population accumulates genetic mutation (Charlesworth and Willis Citation2009). The resulted high-genetic variation in P. canius from the Sundarbans region offered a viable encouragement to monitor the local traits, genetic drift, and inbreeding effects (Tallmon et al. Citation2004; Duvernell et al. Citation2008; Leray and Knowlton Citation2015). In addition to this, the population structure of many other species could indicate the sustainable management and healthy environment of Sunderbans.
Acknowledgements
We thank the Director of Zoological Survey of India, Kolkata, Ministry of Environment, Forest and Climate Change, New Delhi for providing necessary permissions and facilities. The first author (SK) acknowledge the on-going project fellowship program of the ‘NMHS large grant, Conservation of Threatened Vertebrate Fauna in Indian Himalayan Region through Long-Term Monitoring and Capacity Building’ in the ZSI, Kolkata.
Disclosure statement
No potential conflict of interest was reported by the authors.
Additional information
Funding
References
- Abdullah A, Rehbein H. 2016. DNA barcoding for the species identification of commercially important fishery products in Indonesian markets. Int J Food Sci Technol. 52:266–274.
- Bandelt HJ, Forster P, Röhl A. 1999. Median-joining networks for inferring intraspecific phylogenies. Mol Biol Evol. 16:37–48.
- Bariche M, Torres M, Smith C, Sayar N, Azzurro E, Baker R, Bernardi G. 2015. Red sea fishes in the Mediterranean Sea: a preliminary investigation of a biological invasion using DNA barcoding. J Biogeogr. 42:2363–2373.
- Charlesworth D, Willis JH. 2009. The genetics of inbreeding depression. Nat Rev Genet. 10:783–796.
- Costello AB, Down TE, Pollard SM, Pacas CJ, Taylor EB. 2003. The influence of history and contemporary stream hydrology on the evolution of genetic diversity within species: an examination of microsatellite DNA variation in bull trout, Salvelinus confluentus (Pisces: Salmonidae). Evolution. 57:328–344.
- Duvernell DD, Lindmeier JB, Faust KE, Whitehead A. 2008. Relative influences of historical and contemporary forces shaping the distribution of genetic variation in the Atlantic killifish, Fundulus heteroclitus. Mol Ecol. 17:1344–1360.
- Eschmeyer WN. 2012. Catalog of fishes. California Academy of Sciences. [Accessed 2019 Feb 11] http://research.calacademy.org/research/ichthyology/catalog/fishcatmain.asp.
- Froese R, Pauly D., editors. 2018. Fishbase. World Wide Web electronic publication. www.fishbase.org. Accessed October 15, 2018.
- Gomon JR, Taylor WR. 1982. Plotosus nkunga, a new species of catfish from South Africa, with a redescription of Plotosus limbatus Valenciennes and a key to the species of Plotosus (Siluriformes: Plotosidae). Vol. 22. J. L. B. Smith Institute of Ichthyology Special Publication; Grahamstown: Rhodes University, p. 1–16.
- Hebert PD, Cywinska A, Ball SL, deWaard JR. 2003. Biological identifications through DNA barcodes. Philosophical transactions of the Royal Society of London. Series B, Biol Sci. 270:313–322.
- Khalili Samani N, Esa Y, Nurul Amin SM, Mohd Ikhsan NF. 2016. Phylogenetics and population genetics of Plotosus canius (Siluriformes: Plotosidae) from Malaysian coastal waters. PeerJ. 4:e1930.
- Khan MSA, Alam MJ, Rheman S, Mondal S, Rahman MM. 2002. Study on the Fecundity and GIS of brackish catfish Plotosus canius. Online J Biol Sci. 2:232–234.
- Kumar B. 2012. Finding of (Plotosidae: Siluriforms) and its abundance from Parangipettai Coastal Area–a review. Int J Recent Sci Res. 3:482–485.
- Kundu S, Kumar V, Laskar BA, Tyagi K, Chandra K. 2018. Investigating genetic divergence in subspecies of Manouria emys: distinct lineages or plastron anomalies? Mitochondrial DNA B. 3:166–170.
- Kundu S, Kumar V, Tyagi K, Chandra K. 2018. Environmental DNA (eDNA) testing for detection of freshwater turtles in a temple pond. Herpetol Notes. 11:1–3.
- Laskar BA, Kumar V, Kundu S, Darshan A, Tyagi K, Chandra K. 2018. DNA barcoding of fishes from River Diphlu within Kaziranga National park in Northeast India. Mitochondrial DNA A DNA Mapp Seq Anal. 30:126–134. doi:10.1080/24701394.2018.1463373.
- Laskar BA, Kumar V, Kundu S, Tyagi K, Chandra K. 2018. Taxonomic quest: validating two mahseer fishes (Actinopteri: Cyprinidae) through molecular and morphological data from biodiversity hotspots in India. Hydrobiologia. 815:113–124.
- Leh MUC, Sasekumar A, Chew LL. 2012. Feeding biology of Eel Catfish Plotosus Canius Hamilton in a Malaysian Mangrove Estuary and Mudflat. Raffles Bull Zool. 60:551–557.
- Leray M, Knowlton N. 2015. DNA barcoding and metabarcoding of standardized samples reveal patterns of marine benthic diversity. Proc Natl Acad Sci USA. 112:2076–2081.
- Librado P, Rozas J. 2009. DnaSP v5: a software for comprehensive analysis of DNA polymorphism data. Bioinformatics. 25:1451–1452.
- Ng HH, Sparks JS. 2002. Plotosus fisadoha, a new species of marine catfish (Teleostei: Siluriformes: Plotosidae) from Madagascar. Proc Biol Soc Washington. 115: 564–569.
- Pauly D, Christensen V, Guénette S, Pitcher TJ, Sumaila UR, Walters CJ, Watson R, Zeller D. 2002. Towards sustainability in world fisheries. Nature. 418:689–695.
- Prithiviraj N, Annadurai D. 2012. Studies on bioactive properties of the Catfish Plotosus canius (Hamilton, 1822). Int J Recent Sci Res. 3:467–473.
- Prithiviraj N. 2014. Studies on biological properties and in silico approach of Plotosus canius, from Parangipettai coastal waters. Int J Modern Res Rev. 1:24–37.
- Singh SK, Mishra S, Aspi J, Kvist L, Nigam P, Pandey P, Sharma R, Goyal SP. 2015. Tigers of Sundarbans in India: is the population a separate conservation unit? PLoS One. 10:e0118846.
- Tallmon DA, Luikart G, Waples RS. 2004. The alluring simplicity and complex reality of genetic rescue. Trends Ecol Evol. 19:489–496.
- Tamura K, Stecher G, Peterson D, Filipski A, Kumar S. 2013. MEGA6: molecular evolutionary genetics analysis version 6.0. Mol Biol Evol. 30:2725–2729.
- Thompson JD, Gibson TJ, Plewniak F, Jeanmougin F, Higgins DG. 1997. The CLUSTAL_X windows interface: flexible strategies for multiple sequence alignment aided by quality analysis tools. Nucleic Acids Res. 25:4876–4882.
- Thomsen PF, Kielgast J, Iversen LL, Møller PR, Rasmussen M, Willerslev E. 2012. Detection of a diverse marine fish fauna using environmental DNA from seawater samples. PLoS One. 7:e41732.
- Tyagi K, Kumar V, Singha D, Chandra K, Laskar BA, Kundu S, et al. 2017. DNA barcoding studies on Thrips in India: cryptic species, species complexes. Sci Rep. 7:1–14.
- Usman BI, Amin SMN, Arshad A, Rahman MA. 2013. Review of some biological aspects and fisheries of Grey-Eel Catfish Plotosus canius (Hamilton, 1822). Asian J Anim Vet Adv. 2:154–167.
- Ward RD, Zemlak TS, Innes BH, Last PR, Hebert P. 2005. DNA barcoding of Australia’s fish species. Philos Trans Royal Soc B. 360:1847–1857.
- Yoshino T, Kishimoto H. 2008. Plotosus japonicus, a new eeltail catfish (Siluriformes: Plotosidae) from Japan. Bull Natl Mus Nat Sci. S2:1–11.