
Abstract
The species diversity of freshwater fishes from the transboundary river, Jaldhaka is still unknown to the scientific communities. We generated 40 DNA barcode sequences of 16 morphologically identified freshwater fishes and compared genetically with the database sequences. Ten species (Acanthocobitis botia, Barilius bendelisis, Crossocheilus latius, Channa punctata, Channa quinquefasciata, Garra gotyla, Garra kempi, Opsarius barna, Psilorhynchus balitora, and Pseudecheneis sulcata) showed unique haplotypes in the studied riverine system. Further, the estimated genetic divergences, BA tree topology, and ABGD species delimitation methods revealed the presence of cryptic diversity in Badis badis, Garra annandalei, G. gotyla, G. kempi, P. balitora, Rasbora daniconius, and Pethia ticto. The study suggested more exhaustive sampling and generation of more molecular data to strengthen the fact. The aimed integrated approach will be helpful to detect the extant species diversity, helps to reevaluate the checklist and promote sustainable conservation management to protect this unparalleled ecosystem.
1. Introduction
The beginning of the twenty-first century witnessed an era of water scarcity looming largely on future generations. The transboundary rivers not only demarcate the political boundaries of two neighboring territories but also accommodates the indigenous aquatic biota of adjacent realms (Arjoon et al. Citation2016). India is one of the noteworthy nations in the world, which shares numerous common rivers with its contiguous nations, viz. Pakistan, Nepal, Bhutan, China, Bangladesh, and Myanmar (Zawahri Citation2009). The inland water ecosystems frequently confront physical modification, habitat loss, over-exploitation, and massive pollution in many parts of the world including India (Carrizo et al. Citation2017). The impact of climate change, rising floods, and droughts are apparent in many transboundary basins and also affect the colligate riparian regions (Bandyopadhyay Citation2003). The water convention on the fortification and use of the transboundary watercourses delivers an effectual agenda implemented by the Environment and Security Initiative (ENVSEC) together with United Nations Development Programme (UNDP), United Nations Environment Programme (UNEP), and Organization for Security and Co-operation in Europe (OSCE), International Water Assessment Centre (IWAC), and World Meteorological Organization (WMO) for monitoring the climate change (UNEP-DHI and UNEP Citation2016).
India with its seven transboundary river basins viz., Muhuri (aka Little Feni), Fenney, Ganges-Brahmaputra-Meghna, Indus, Irrawaddy, Kaladan, and Karnaphuli; has signed the treaty upon sharing of water with their neighboring countries and bioresources (Crow et al. Citation1995; Chakraborty and Serageldin Citation2004). These mutual agreements predominantly support both the parties in terms of water usage by human, energy development, irrigation as well as a broad spectrum of socioeconomic development. Fish and fishery resources are the most lucrative biotic component which is directly linked with the human as food sources and economically important commodities (Sarkar Citation2018). Subsequently, the rivers flow through the territory of different neighboring countries carrying away several exotic species which possess major threats to the native fauna by invading their ecosystem (Collins et al. Citation2012). Hence, the diversity assessment of freshwater fishes from any transboundary river is an indicator-based assessment, for knowing the indigenous faunal composition, classify the rivers at risk from various anthropogenic factors, and increase awareness for sustainable conservation. To achieve this goal, the traditional taxonomy has played a major role in inventorying the biodiversity since long back (Ebach and Holdrege Citation2005). Several ichthyologists had surveyed this region since British India, and first reported 131 fish species from this region (Shaw and Shebbeare Citation1937). Later on, several researchers have surveyed and reported the freshwater fish diversity from different riverine systems in this region (Jayaram and Singh Citation1977; Sen Citation1992; Barat et al. Citation2015; Das Citation2015). A recent study estimated a total of 119 fish species from the River Jaldhaka (Sarkar and Pal Citation2018). However, the detection of species diversity of freshwater fishes of this region has never been attempted through molecular tools. In addition, the contemporary molecular approaches have gained large success as an accelerator tool for classical taxonomy by accurate species identification, delimitation of the genetic boundaries, and evolutionary pattern (Hebert et al. Citation2003; Hajibabaei et al. Citation2007). The DNA barcoding is manifested as an effective method for species identification and systematics research on freshwater fishes in India (Khedkar et al. Citation2014; Lakra et al. Citation2016; Barman et al. Citation2018; Laskar et al. Citation2018). Hence, the present study was conducted to survey the transboundary river Jaldhaka and generate the DNA barcode data of sampled fishes. The specimens were morphologically identified and the DNA sequences were compared with the available GenBank sequences of the same species collected from the diverse locality. This DNA barcode-based assessment provides a first insight into the freshwater fish species diversity of Jaldhaka river at the edge of India and Bhutan. The present results also allow to test the genetic unicity of the Jaldhaka fishes with other population. The present effort would help to revise the regional checklist of Ichthyofauna, enrich the global barcode database, and strengthen the management strategies of transboundary rivers and allied biodiversity.
2. Materials and methods
2.1. Taxon sampling and wet-laboratory experiment
The researchers of Zoological Survey of India (ZSI) have accomplished the ichthyological exploration in the transboundary river (27.104 N 88.870 E) in West Bengal state, east India (). The topology map and transboundary rivers of the study area, CGIAR SRTM (3 seconds resolution) data at the country level have been downloaded from DIVA-GIS Spatial data download platform (http://www.diva-gis.org/datadown). Spatial analyst extension and ArcGIS 10.6 software (ESRI 2019) have been used for clipping the river line vector file and overlaying the river line profiles for both the landscapes, Bhutan, and West Bengal (ESRI®, CA, USA). The revirine system originates from the Bitang lake of southern Sikkim in eastern Himalaya and flows through Bhutan, West Bengal, Bangladesh, and joined with Brahmaputra River. The fish samples were captured by a recommended cast net (mesh size >2 cm) and preserved in 70% alcohol for downstream study. A total of 40 selected freshwater fish samples was collected and subsequently preserved in 70% alcohol for both morphological and molecular investigations. The studied specimens were identified through morphological data and meristic counts as described earlier (Eschmeyer Citation2012; Vishwanath et al. Citation2014). All the identified specimens were stored in National Zoological Collections (NZCs) with individual voucher numbers at Freshwater Fish Section, ZSI, FPS Building, ZSI, Kolkata. A required amount of muscle tissue was collected aseptically from each specimen for molecular study and stored at Centre for DNA Taxonomy Laboratory, Molecular Systematics Division, ZSI, Kolkata for future reference. The extraction of genomic DNA, PCR of the mitochondrial Cytochrome C Oxidase Subunit I (mtCOI) gene fragment, primer pairs, and gel electrophoresis of the amplicons was performed as per previous protocols (Ward et al. Citation2005). The bi-directional Sanger sequencing was performed on a 48-capillary 3730 DNA Analyzer at the ZSI in-house sequencing facilities with the standardized protocol (Kundu et al. Citation2019).
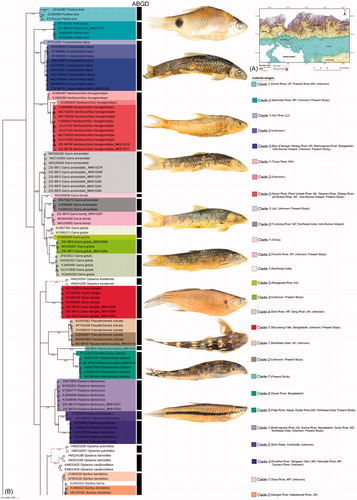
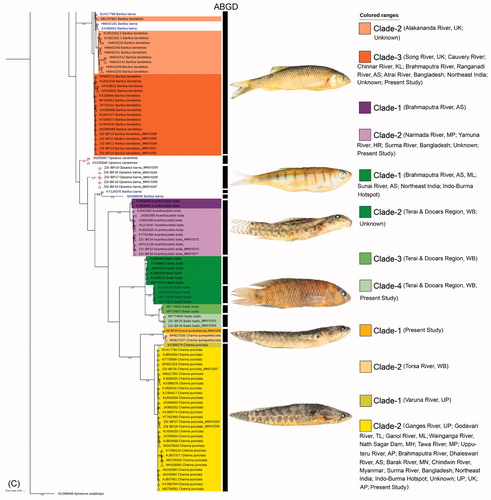
Figure 1. (A) Map shows the topology and river lines of North West Bengal and Bhutan with collection locality of freshwater fishes from transboundary river. (B) The split BA tree showing the multiple clades within the monophyletic and polyphyletic clustering of the studied species with both generated and database sequences. Species delimitation through ABGD analysis were denoted by black bar besides each clades. Representative photographs of each studied species was superimposed besides each clade. Indian states were abbreviated as Uttar Pradesh: UP; Maharashtra: MH; Madhya Pradesh: MP; Gujarat: GJ; Arunachal Pradesh: AR; Manipur: MN; Meghalaya: ML; Assam: AS; Mizoram: MZ; Haryana: HR; Uttarakhand: UK; West Bengal: WB; Kerala: KL; Telengana: TL; Andhra Pradesh: AP. (C) The split BA tree showing the multiple clades within the monophyletic and polyphyletic clustering of the studied species with both generated and database sequences. Species delimitation through ABGD analysis were denoted by black bar besides each clades. Representative photographs of each studied species was superimposed besides each clade.
2.2. In-silico analysis
The consensus sequences were incurred from the forward and reverse chromatograms of each sample. Both the noisy end of each sequence was trimmed to diminish the misleading result in genetic analysis. The generated sequences were checked through BLASTn (Basic Local Alignment Search Tool) (https://blast.ncbi.nlm.nih.gov) and ORF finder (http://www.ncbi.nlm.nih.gov/gorf/gorf.html) to identify the insertion-deletion and exact amino acid array of the organism. Further, the consensus sequences were submitted in the GenBank to obtain the accession numbers (MK610279 to MK610318). The generated sequences were primarily checked through similarity search in global BLASTn. The availability of mtCOI sequences of the targeted species was checked and based on the unique voucher IDs (assumed with different collection locality), 165 database sequences were retrieved from GenBank to make a combined dataset. Both generated and database sequences were aligned through ClustalX software (Thompson et al. Citation1997) and the genetic divergences were calculated using MEGAX (Kumar et al. Citation2018). The best fit model was calculated using Mr. MODELTEST v2 with lowest BIC (Bayesian Information Criterion) score (Nylander Citation2004). The Bayesian (BA) tree was built in Mr. Bayes 3.1.233 by selecting nst = 6 for GTR + G+I model with four (one cold and three hot) metropolis-coupled Markov Chain Monte Carlo (MCMC) and run for 1,000,000 generations with 25% burn in with trees saving at each 100 generations (Ronquist and Huelsenbeck Citation2003). The MCMC analysis was used to generate the convergence metrics, until the standard deviation (SD) of split frequencies reached 0.01 and the potential scale reduction factor (PSRF) for all parameters bordered on 1.0. The generated BA tree was represented by the web-based iTOL tool (https://itol.embl.de/) (Letunic and Bork Citation2007). The other tree building methods, neighbor-joining (NJ), maximum parsimony (MP), and maximum likelihood (ML) were also checked to test the cluster pattern in MEGA program. The database sequence of Apristurus ampliceps (order Carcharhiniformes) was used as an outgroup in the present study. To estimate the Molecular Operational Taxonomic Unit (MOTU) and below species level delimitation, Automatic Barcode Gap Discovery (ABGD) was performed on the web server (www.abi.snv.jussieu.fr/public/abgd/) with the K80 parameter with relative gap width 1.5 (Puillandre et al. Citation2012). The haplotype data were generated using DnaSP5.10 (Librado and Rozas Citation2009).
3. Results and discussion
The Terai and Dooars region of West Bengal in India is the sub-mountain region of the Himalaya covering with dense forest on the northern side (He et al. Citation2001). The area is crisscrossed by many inland water systems, originating from Bhutan, Sikkim, Tibet, and entering Bangladesh (Patra Citation2011). The topology of this region is similar to the Eastern Himalayan biodiversity hotspot and the riverine systems flowing through this region are swamped during the rainy season which dries up in winter. Among all riverine systems which originated or pass through Bhutan, the Jaldhaka is one of the significant transboundary rivers in this region. This river system originating from the Bitang Lake in Sikkim flows through Bhutan, West Bengal, and Bangladesh covers a stretch of 192 kilometers. Although the ichthyofaunal diversity was estimated randomly from different riverine systems of this region through traditional taxonomy (Sarkar and Pal Citation2018), the extant diversity has been overlooked through molecular data. Hence, the present study contributed 40 DNA barcode sequences of 16 freshwater fishes from the transboundary river of India and Bhutan. The estimated similarity search results of the generated sequences in GenBank were congruent with the morphology-based species identification. Most of the database sequences are generated from different riverine systems from India, however, the collection information of few sequences was missing. The topology patterns are almost alike in all the tree building methods (NJ, MP, ML, and BA) examined for the studied dataset (). The widely accepted BA tree topology pattern was further discussed to reveal the possible cryptic diversity. The BA tree resulted more than one clade in Pethia ticto (2 clades), Crossocheilus latius (3 clades), Neolissochilus hexagonolepis (3 clades), Garra annandalei (2 clades), Garra kempi (2 clades), Garra gotyla (4 clades), Pseudecheneis sulcata (2 clades), Psilorhynchus balitora (3 clades), Rasbora daniconius (3 clades), Barilius bendelisis (3 clades), Acanthocobitis botia (2 clades), Badis badis (4 clades), Channa quinquefasciata (2 clades), and Channa punctata (2 clades). Further, as the sequences divergence sometimes ensued to be a poor indicator for species boundaries, the estimated ABGD analysis revealed total 31 MOTUs within the studied barcode data in the dataset. The six species (B. badis, Danio dangila, G. annandalei, G. kempi, P. ticto, and R. daniconius) showed congruence results in ABGD analysis and BA tree topology. However, the other nine species depicted incongruous result in ABGD analysis (A. botia, B. bendelisis, C. latius, C. punctata, C. quinquefasciata, N. hexagonolepis, and P. sulcata with 1 MOTU; G. gotyla and P. balitora with 3 and 2 MOTUs, respectively). Due to the revision in taxonomic nomenclature and ambiguous naming in the database sequences barcode data of both Barilius barna and Opsarius barna were not discussed through ABGD and BA analysis. Hence, based on the BA tree topology and ABGD species delimitation method, the study assumed the presence of cryptic diversity in seven species (B. badis, G. annandalei, G. gotyla, G. kempi, P. balitora, R. daniconius, and P. ticto) which further was discussed through genetic divergence. In P. ticto, the mean genetic distance between Clade-1/MOTU1 and Clade-2/MOTU2 was 19%. Garra annandalei showed two polyphyletic clades in the BA tree with 10.7% mean genetic distance between Clade-1/MOTU1 and Clade-2/MOTU2. Garra kempi also represents two polyphyletic clades with 9.6% mean genetic distance between Clade-1/MOTU1 and Clade-2/MOTU2. Garra gotyla showed four clades in the BA tree and three MOTUs in ABGD analysis. The mean genetic distance between MOTU1/(Clade-1 + Clade-2), MOTU2/Clade-3 and MOTU4/Clade-4 was ranging from 8.7 to 8.9% in the dataset. Psilorhynchus balitora resulted three clades in the BA tree and two MOTUs in BA tree. The mean genetic distance between MOTU1/Clade-1 and MOTU2/(Clade-2 + Clade-3) was 22.8% in the studied dataset. The mean genetic distance between the three possible cryptic species of R. daniconius, Clade-1/MOTU1, Clade-2/MOTU2, and Clade-3/MOTU3 was ranging from 9.4 to 12.4%. The mean genetic distance between the four possible cryptic species of B. badis, Clade-1/MOTU1, Clade-2/MOTU2, Clade-3/MOTU3, and Clade-4/MOTU4 were ranging from 5.1 to 16.6%. Further, the haplotype analysis revealed total 128 haplotypes in the dataset with 0.99 diversity. Out of the 16 species, 10 species (A. botia, B. bendelisis, C. latius, C. punctata, C. quinquefasciata, G. gotyla, G. kempi, O. barna, P. balitora, and P. sulcata) showed 14 unique haplotypes from the studied locality.
The present barcode based analysis of the freshwater fishes of different riverine systems within and outside of India suggested possible cryptic diversity. Despite the encompassing benefits of DNA barcoding in biodiversity inventorization, the erroneous identification of voucher specimens and their accessible sequences in global database often flunked to test the generated sequences through similarity search (Collins and Cruickshank Citation2013). Thus, the improvements of both taxonomic studies and annotation of the generated barcode data are mandatory for more reliable and accurate results. Nevertheless, to understand the accurate diversity of this cryptic diversity, more specimens are required from different localities, a comparative study with their type specimens from different museums and generation of more molecular markers (Hebert et al. Citation2004; Bickford et al. Citation2007; Bergsten et al. Citation2012).
In addition, we recommend reexamining the specimens incorporated in the studied dataset stored in different museums and personal collections for accurate identification or possible new species discovery. The present study will be helpful to fortify the global database with barcode sequences of accurately identified fishes from India. In addition, the aimed study also helps to re-evaluate the ichthyofauna checklist from India and Bhutan. The climatic condition, pollution, and habitat degradation have largely affected and possess an extinction risk to the inhabiting freshwater biodiversity. Hence, the present integrated study of freshwater fishes would be supportive to recognize the extant diversity and helpful for the conceptualization of schemes for sustainable conservation and management. The aimed genetic assessment also helps to promote the ‘Nagoya protocol’ on access to genetic resources and the equitable sharing of benefits originating from their usage to the Convention on Biological Diversity (CBD).
Acknowledgements
We thank the Director, Zoological Survey of India, Ministry of Environment, Forest and Climate Change (MoEF&CC) for providing necessary working facilities. We acknowledge the financial support for this work from the ‘NMHS large grant, Conservation of Threatened Vertebrate Fauna in Indian Himalayan Region through Long-Term Monitoring and Capacity Building’ to K.C., S.K. and ZSI core funding to all authors. We are also thankful to the West Bengal Biodiversity Board for their financial support for Survey and Fish tissue collection from the Indo-Bhutan transboundary river. The funders had no role in study design, data collection and analysis or preparation of the manuscript.
Disclosure statement
No potential conflict of interest was reported by the authors.
Additional information
Funding
Related Research Data
References
- Arjoon D, Tilmant A, Herrmann M. 2016. Sharing water and benefits in transboundary river basins. Hydrol Earth Syst Sci. 20:2135–2150.
- Bandyopadhyay J. 2003. Water management in the Ganges-Brahmaputra basin. In: Chatterjee M, editor. 2003 Conflict management in water resources. Burlington, VT, USA: Ashgate Publishing Company; p. 179–218.
- Barat S, Dey A, Nur R, Sarkar D. 2015. Ichthyofauna diversity of river Kaljani in Cooch Behar district of West Bengal, India. Int J Pure App Biosci. 3:247–256.
- Barman AS, Singh M, Singh SK, Saha H, Singh YJ, Laishram M, Pandey PK. 2018. DNA barcoding of freshwater fishes of Indo-Myanmar biodiversity hotspot. Sci Rep. 8:8579.
- Bergsten J, Bilton DT, Fujisawa T, Elliott M, Monaghan MT, Balke M, Hendrich L, Geijer J, Herrmann J, Foster GN, et al. 2012. The effect of geographical scale of sampling on DNA barcoding. Syst Biol. 61:851–869.
- Bickford D, Lohman DJ, Sodhi NS, Ng PKL, Meier R, Winker K, Ingram KK, Das I. 2007. Cryptic species as a window on diversity and conservation. Trends Ecol Evol (Amst.). 22:148–155.
- Carrizo SF, Jähnig SC, Bremerich V, Freyhof J, Harrison I, He F, Langhans SD, Tockner K, Zarfl C, Darwall W, et al. 2017. Freshwater megafauna: flagships for freshwater biodiversity under threat. BioScience. 67:919–927.
- Chakraborty R, Serageldin I. 2004. Sharing of river waters among India and its neighbors in the 21st century: war or peace? Water Int. 29:201–208.
- Collins RA, Armstrong KF, Meier R, Yi Y, Brown SDJ, Cruickshank RH, Keeling S, Johnston C. 2012. Barcoding and border biosecurity: identifying Cyprinid fishes in the aquarium trade. PLOS One. 7:e28381.
- Collins RA, Cruickshank RH. 2013. The seven deadly sins of DNA barcoding. Mol Ecol Resour. 13:969–975.
- Crow B, Lindquist A, Wilson D. 1995. Sharing the Ganges: the politics and technology of river development. New Delhi: Sage Publications.
- Das D. 2015. Ichthyofaunal diversity of River Torsa and its tributaries at Terai region of West Bengal, India. Int J Sci Nat. 6:256–263.
- Ebach MC, Holdrege C. 2005. DNA barcoding is no substitute for taxonomy. Nature. 434:697.
- Eschmeyer WN. Catalog of fishes. California Academy of Sciences; 2012. [Accessed 2019 Apr 5] http://research.calacademy.org/research/ichthyology/catalog/fishcatmain.asp.
- Hajibabaei M, Singer GA, Hebert PD, Hickey DA. 2007. DNA barcoding: how it complements taxonomy, molecular phylogenetics and population genetics. Trends Genet. 23:167–172.
- He SP, Cao WX, Chen YY. 2001. The uplift of Qinghai-Xizang (Tibet) Plateau and the vicariance speciation of glyptosternoid fishes (Siluriformes: Sisoridae). Sci China C Life Sci. 44:644–651.
- Hebert PD, Cywinska A, Ball SL, deWaard JR. 2003. Biological identifications through DNA barcodes. Proc Royal Soc B Biol Sci. 270:313–321.
- Hebert PDN, Penton EH, Burns JM, Janzen DH, Hallwachs W. 2004. Ten species in one: DNA barcoding reveals cryptic species in the neotropical skipper butterfly Astraptes fulgerator. Proc Natl Acad Sci USA. 101:14812–14817.
- Jayaram KC, Singh KP. 1977. On the collection of fish from North Bengal. Rec Zool Surv Ind. 72:243–275.
- Khedkar GD, Jamdade R, Naik S, David L, Haymer D. 2014. DNA barcodes for the fishes of the Narmada, one of India's longest rivers. PLOS One. 9:e101460.
- Kumar S, Stecher G, Li M, Knyaz C, Tamura K. 2018. MEGAX: molecular evolutionary genetics analysis across computing platforms. Mol Biol Evol. 35:1547–1549.
- Kundu S, Rath S, Laishram K, Pakrashi A, Das U, Tyagi K, Kumar V, Chandra K. 2019. DNA barcoding identified selected ornamental fishes in Murti river of East India. Mitochondr DNA B Res. 4:594–598.
- Lakra WS, Singh M, Goswami M, Gopalakrishnan A, Lal KK, Mohindra V, Sarkar UK, Punia PP, Singh KV, Bhatt JP, et al. 2016. DNA barcoding Indian freshwater fishes. Mitochondr DNA A DNA Mapp Seq Anal. 27:4510–4517.
- Laskar BA, Kumar V, Kundu S, Tyagi K, Chandra K. 2018. Taxonomic quest: validating two Mahseer fishes (Actinopterygii: Cyprinidae) through molecular and morphological data from biodiversity hotspots in India. Hydrobiologia. 815:113–124.
- Letunic I, Bork P. 2007. Interactive Tree Of Life (iTOL): an online tool for phylogenetic tree display and annotation. Bioinformatics. 23:127–128.
- Librado P, Rozas J. 2009. DnaSP v5: a software for comprehensive analysis of DNA polymorphism data. Bioinformatics. 25:1451–1452.
- Nylander JAA. 2004. MrModeltest v2. Program distributed by the author. Sweden: Evolutionary Biology Centre, Uppsala University.
- Patra AK. 2011. Catfish (Teleostei: Siluriformes) diversity in Karala River of Jalpaiguri District, West Bengal, India. J Threat Taxa. 3:1610–1614.
- Puillandre N, Lambert A, Brouillet S, Achaz G. 2012. ABGD, automatic barcode gap discovery for primary species delimitation. Mol Ecol. 21:1864–1877.
- Ronquist F, Huelsenbeck JP. 2003. MrBayes 3: Bayesian phylogenetic inference under mixed models. Bioinformatics. 19:1572–1574.
- Sarkar T, Pal J. 2018. Diversity and conservation status of Ichthyofauna in the river Jaldhaka, West Bengal. Int J Fish Aquat Stud. 6:339–345.
- Sarkar T. 2018. Small indigenous fish species (SIS) diversity in the River Teesta, Jaldhaka and Torsa, West Bengal, India. Int J Fish Aquat Res. 3:01–05.
- Sen TK. 1992. Fresh water fish. In State Fauna Series Pub. Kolkata, West Bengal: Zoological Survey of India.
- Shaw GE, Shebbeare EO. 1937. The fishes of Northern Bengal. J Royal Asiat Soc Bengal (Science). 3:1–137.
- Thompson JD, Gibson TJ, Plewniak F, Jeanmougin F, Higgins DG. 1997. The CLUSTAL_X windows interface: flexible strategies for multiple sequence alignment aided by quality analysis tools. Nucleic Acids Res. 25:4876–4882.
- UNEP-DHI and UNEP. 2016. Transboundary river basins: status and trends, summary for policy makers. Nairobi: United Nations Environment Programme (UNEP).
- Vishwanath W, Nebeshwar K, Lokeshwar Y, Shangningam BD, Rameshori Y. 2014. Freshwater fish taxonomy and a manual for identification of fishes of North-east India. Imphal, Manipur, India: Manipur University and National Bureau of Fish Genetic Resources.
- Ward RD, Zemlak TS, Innes BH, Last PR, Hebert P. 2005. DNA barcoding Australia's fish species. Philos Trans R Soc Lond B Biol Sci. 360:1847–1857.
- Zawahri N. 2009. India, Pakistan and cooperation along the Indus River system. Water Policy. 11:1–20.