
Abstract
Bos gaurus gaurus commonly called as gaur is a wild bovid species inhabiting South and Southeast Asia and attained vulnerable status in India. In this study, we typed 62 extant free-ranging wild gaur individuals for mitochondrial partial displacement loop (D-loop) and cytochrome b gene (Cyt b) from the Melghat Tiger Reserve (MTR). Two historical DNA samples originating from museums and two Tectona grandis bark fibers samples browsed by wild gaur were also used as a source of environmental DNA. Both D-loop and Cyt b loci show the occurrence of a single haplotype in the contemporary wild gaur population. While D-loop fragment sequencing of two historical museum samples reveals two unique haplotypes, virtually absent in the present wild gaur population of MTR. Amplifications of the similar haplotypes in gaur DNA samples obtained through chewed T. grandis bark fibers have proved the efficacy of eDNA. Bayesian Skyline Plot (BSP) analysis using extant and historical D-loop sequences illustrate population decline starting from upper Mesolithic. Also, the BSP graph indicates accelerated effective population size decline (Ne), a time period coinciding with the different phases of the ∼5000 years old Indus civilization. The plot shows an overall declining trend in the wild gaur population, a probable outcome of ever-shrinking habitat in the central Indian landscape caused by prehistoric, medieval and colonial hunting practices.
Introduction
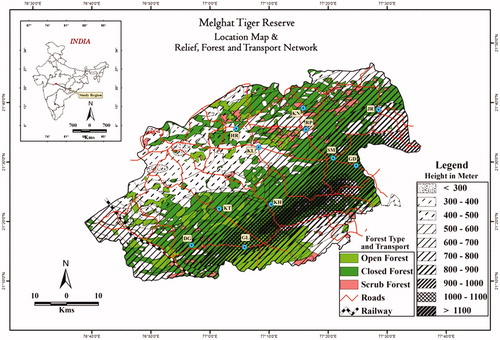
Currently, wildlife is facing extinction threats because of two main reasons, global climate change, and ever-increasing anthropogenic activities in their continuously shrinking habitats (Fardila et al. Citation2017; Sonwa et al. Citation2017; Matata and Adan Citation2018; Barlow et al. Citation2018). Wild gaur is a member of family Bovidae; mainly confined to the deciduous and semi-deciduous forest of Asian countries like India, China, Thailand, Myanmar, Vietnam, Cambodia, Malaysia, and Nepal. In India, wild gaur population distribution ranges from tropical wet, semi-wet evergreen and bamboo forest to tropical dry deciduous forests in central India (Karanth and Kumar Citation2005). The distribution also extends to Shola forests and tropical throne forests on the eastern inclines of the Western Ghats. In all distribution ranges, the status of wild gaur ranges between vulnerable to endangered, while in countries like Bangladesh, they are probably extinct (www.iucn.org). Due to insufficient data, the exact number of wild gaur is far from accurate (Ahrestani and Karanth Citation2014, IUCN). But the largest population has been reported in Nagarahole National Park (probably over 3,000; 5.1 per 100 km2; Ahrestani and Karanth Citation2014, IUCN). In India, wild gaur is notified under schedule-I of the Indian Wildlife Protection Act (1972) as well as in appendix-I in CITES (2003). Wild gaur plays a crucial ecological role in the ecosystems of dry deciduous forests, maintaining the physical structure of habitat (Gordon et al. Citation2004). Gaur is the key component of the food chain in tiger occupied landscapes such as MTR. Wild gaurs are the modifiers of ecosystem structure and function, as they trigger the trophic cascades in habitat (McNaughton Citation1979; Mattson Citation1997). Despite the important and largest herbivore species of many protected reserves in India, no study has been undertaken to investigate the genetic diversity of this massive wild bovid. Amongst South Asia, India bears the distinction of harboring the largest population of wild gaur. The MTR is one of the first nine tiger reserve notified in India after the implementation of Indian wildlife protection act in 1972. MTR also bears the distinction of one of the four wild gaur conservation landscapes identified in India. Forest of MTR is tropical dry and deciduous type, located at 21°26′45″N 77°11′50″E in the Amravati district of central India and covers an area of 1677 km2 (). According to 2014 census, an estimate of 500 wild gaurs has been reported from MTR (Ahrestani and Karanth Citation2014, IUCN). The MTR reported having the lowest ungulate prey density when compared with other reserves in central India (Karanth and Kumar Citation2005). Besides, a critical tiger conservation habitat in central India, MTR also recognized as one of the wild gaur conservation areas. In this study, we employed noninvasive, historical DNA and environmental DNA approach to underscore the first-ever genetic study attempted on free-ranging wild gaur population to unravel their population genetic structure using mitochondrial DNA markers.
Figure 1. Map showing sampling location of the wild gaur from the Melghat Tiger Reserve of Central India.
Materials and methods
We collected 60 dung and 2 environmental DNA samples of free-ranging wild gaur from MTR. Additionally, two historical samples originating from museums from central India were also typed. Historical DNA provides information about extant and extinct effective population sizes over time (Payne and Sorenson Citation2002; Kearney and Stuart Citation2004; Asher and Hofreiter Citation2006). Of 60 dung samples, all 60 samples were sequenced for D-loop while 24 for Cyt b. Dung samples were collected randomly from the reserve, with the prior permission of the Chief Conservator of Forest (CCF) and Field Director of MTR (Letter No. Desk-3/MTR/Res/1956/2014-15) (). A 60-year-old skull trophy and a 150 year’s old stuffed specimen of gaur housed in the zoological museum, Amravati was used as a source of historical DNA (Voucher No. VMVMu-12 and VMVMu-13), respectively. Two peel-off teak bark samples (Tectona grandis) browsed by gaur to be used as a source of eDNA were also collected from the Semadoh, region of MTR. DNA from dung samples was extracted using a DNA extraction protocol described by Costa et al. (Citation2016). Genomic DNA was also extracted from the pinna of a sole dead wild gaur obtained from the Koha region in MTR to be used as a positive control using Genetix Miniprep Kit (Genetix, Rome, GA). Genomic DNA from the museum trophy was extracted in a separate facility away from the noninvasive extraction facility to avoid cross-contamination according to the procedure described by Loreille et al. (Citation2007). Similarly, genomic DNA from stuffed wild gaur specimen was extracted using Genetix Miniprep Kit, Genetix, Rome, GA, using a modified lysis buffer. Environmental DNA (eDNA) extraction was carried out in a separate facility using both noninvasive modified spin column method and tissue DNA extraction kit (GENETIX Miniprep Kit, GENETIX, Rome, GA). Total 64 D-loop (from 60 dung, 2 museums, 2 eDNA samples) and 24 Cyt b sequences were generated using newly designed gaur-specific primers. The primers were designed using the Primer3 program (Koressaar and Remm Citation2007; Untergasser et al. Citation2012). For D-loop, forward: 5′-AGT TCC ACA AAC GCA AAG AGC-3′ and reverse: 5′-GTT GCT GGT TTC ACG CGG-3′ was used. While a forward: 5′-CAA ATC CTC ACA GGC CTA TTC CTA-3′ and reverse: 5′-AGG ATT ACT CCA ATG TTT CA-3′ was used to amplify Cyt b gene. The historical museum samples amplified and sequenced twice with negative as well as a positive control to confirm the genetic variation from the modern sequences. DNA extracted from the pinna of the wild gaur was used as a positive control. ABI trace files were edited and eye aligned using Geneious 8.0.5 (Applied Biosystems, Waltham, MA). Haplotypes were identified using DnaSP v 05.l (Librado and Rozas Citation2009), and newly generated sequences were deposited in the GenBank (). Bayesian Skyline Plot (BSP) was constructed using extant and historical control region sequences to compare the present and past demography using BEAST v. 1.8 (Drummond et al. Citation2012). Detail information related to PCR and the use of priors and model specifications used to construct BSP is provided in the supplemental material.
Table 1. D–loop and Cyt b dataset submitted to GenBank.
Result
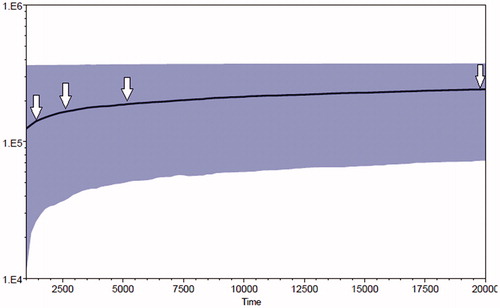
Sequences obtained at both D-loop and Cyt b loci, using a noninvasive method in dung and eDNA samples revealed a single haplotype, which is corroborated by the similar haplotype found in the positive control tissue sample collected from the dead wild gaur from the Koha region in MTR. However, the successful generation of D-loop sequences in two historical museum samples revealed a significant genetic variation. Comparison of total of 209 bp of D-loop haplotype sequenced from dung samples with those generated from the historical museum trophy sample, confirm a single base transition of Guanine to Adenine at 187th base pair position (). While two transitions (33rd and 41st base) and two transversions (3rd and 8th base) were identified in 209 bp D-loop haplotype sequenced in genomic DNA obtained from historical stuffed museum wild gaur specimen (). Bayesian Skyline Plot generated using a dataset of 64 mitochondrial D-loop sequences including 2 historical DNA sequences depict past population decline commencing ∼20,000 years ago (). The graph shows an accelerated effective population size (Ne) decline around ∼5000 and ∼2500 years ago. Both standard tissue DNA extraction and noninvasive methods of DNA extraction protocols from the peeled-off bark fibers resulted in the amplification success of the mitochondrial D-loop and Cyt b loci. Single D-loop and Cyt b haplotype found in both eDNA samples were identical to the haplotype found in dung samples amplified using noninvasive sampling.
Figure 2. Mitochondrial D-loop sequence variation comparison in extant and historical wild gaur DNA samples.
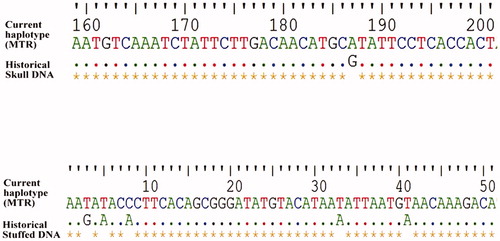
Figure 3. The Bayesian Skyline Plot (BSP) showing past and present population dynamics of wild gaur. Numbers on the X-axis show time in thousand years and those on the Y-axis show effective population size (Ne). Note the distinct decline in effective population size around 5 kya onwards.
Discussion
The Occurrence of single haplotype in extant wild gaur exhibits low mitochondrial DNA diversity thus confirming a single population with the virtual absence of gene flow between population inhabiting different protected reserves in central India outside of the MTR. Greater sequence variation found in two historical DNA sequences further confirms the loss diversity no longer found in the present-day wild gaur population of MTR. Lack of mitochondrial DNA variation in the current wild gaur population points toward the presence of a single, small population of wild gaur with less number of founder females in MTR (Md-Zain et al. Citation2018). Considering the single locus and contribution of mtDNA to the whole genome, low diversity at the maternal level is justified and reported in several species (Cadahía et al. Citation2007; Rosli et al. Citation2011; Tsangaras et al. Citation2012; Khaire et al. Citation2016). Human-induced disturbances including the conversion of wild habitat into agricultural land by native tribes are also responsible for the severe habitat destruction in central India including MTR. Some significant studies published previously justified the effect of habitat fragmentation on the genetic diversity and differentiation in spatially separated tiger populations of central India (Mondol et al. Citation2009; Sharma et al. Citation2013). The Mesolithic population declines ∼20,000 years ago inferred using BSP roughly coincide with the hunting practices of native Austro-Asiatic tribes of central India. Further accelerated declines in effective population sizes illustrated in BSP graph around ∼5000 and ∼2500 years ago is incongruent with the archeology of Indus valley. Markedly, Indus civilization is associated with three phases: the early (∼3.5 to ∼2.6 kya), the mature (∼2.6 to 2.0 kya) and the late (2.0 kya to ∼1.6 kya), (Allchin and Allchin Citation1997). Also, several anthropological and archeological studies on endogamous tribal populations of India show evidence of hunting practices amongst Austro-Asiatic tribes of central India (Majumder Citation2001; Basu et al. Citation2003; Kumar et al. Citation2008). The “slash and burns” practices of Korku and Baigas tribes is well documented (Gautam Citation2011). We argue that most probably, the beginning of human-wildlife conflicts after the advent of agriculture in central India was mainly responsible for the habitat destruction, causing wild gaur population decline in the MTR (Chaubey et al. Citation2007). Moreover, the rise of the mature phase of Indus civilization ∼2500 years ago as well as the independent origin of agriculture and urbanization in central India (Fuller Citation2007) probably resulted in the population decline of wild gaur in central India. Population decline might have been further aggravated with the hunting practices of the medieval Monarch followed by British rule ∼250 years ago. Rangarajan (Citation2006) and Mondol et al. (Citation2009) describes a greater decline in the tiger population during the same period. Thus, the low mitochondrial diversity in the contemporary wild gaur population of MTR is the outcome of catastrophic events starting from Mesolithic to recent hunting practices leading to extreme habitat loss. Further, amplification success with eDNA obtained from chewed teak barks fibers using noninvasive as well as by standard tissue DNA extraction method highlight the need to look for an alternate sources of DNA in protected reserves. Earlier, similar kind of studies were attempted where eDNA obtained from saliva has been used to recognize ungulates species (Nichols et al. Citation2012, Citation2015a, Citation2015b). In the future, inclusion of samples from other protected reserves of India, and the use of next-generation sequencing methods would provide more comprehensive genetic diversity and phylogeography of the largest wild bovid species of South Asia.
Supplemental Material
Download Zip (1.1 MB)Disclosure statement
No potential conflict of interest was reported by the author(s).
Additional information
Funding
Related Research Data
References
- Ahrestani FS, Karanth KU. 2014. Gaur Bos gaurus. In: Melletti M, Burton J, editors. Ecology, evolution and behaviour of wild cattle: implications for conservation. Cambridge: Cambridge University Press; p. 174–193.
- Allchin B, Allchin FR. 1997. Origins of a civilization: the prehistory and early archaeology of South Asia. New York: Viking.
- Asher RJ, Hofreiter M. 2006. Tenrec phylogeny and the noninvasive extraction of nuclear DNA. Syst Biol. 55(2):181–194.
- Barlow J, França F, Gardner TA, Hicks CC, Lennox GD, Berenguer E, Castello L, Economo EP, Ferreira J, Guénard B, et al. 2018. The future of hyperdiverse tropical ecosystems. Nature. 559(7715):517–526.
- Basu A, Mukherjee N, Roy S, Sengupta S, Banerjee S, Chakraborty M, Dey B, Roy M, Roy B, Bhattacharyya NP, et al. 2003. Ethnic India: a genomic view, with special reference to peopling and structure. Genome Res. 13(10):2277–2290.
- Cadahía L, Negro JJ, Urios V. 2007. Low mitochondrial DNA diversity in the endangered Bonelli’s Eagle (Hieraaetus fasciatus) from SW Europe (Iberia) and NW Africa. J Ornithol. 148:99.
- Chaubey G, Metspalu M, Kivisild T, Villems R. 2007. Peopling of South Asia: investigating the caste-tribe continuum in India. Bioessays. 29(1):91–100.
- Costa V, Rosenbom S, Monteiro R, Rourke SMO, Pereira A. 2016. Improving DNA quality extracted from fecal samples—a method to improve DNA yield. Eur J Wildl Res. 63:3.
- Drummond AJ, Suchard MA, Xie D, Rambaut A. 2012. Bayesian phylogenetics with BEAUti and the BEAST 1.7. MolBiolEvol. 29:1969–1973.
- Fardila D, Kelly LT, Moore JL, McCarth MA. 2017. A systematic review reveals changes in where and how we have studied habitat loss and fragmentation over 20 years. Biol Conserv. 212:130–138.
- Fuller DQ. 2007. Non-human genetics, agricultural origins and historical linguistics in South Asia. In: Petraglia MD, Allchin B, editors. The evolution and history of human populations in South Asia. New York: Springer; p. 393–443.
- Gautam R. 2011. Baigas: the hunter gatherers of central India. New Delhi (India): Readworthy Publications (P) Ltd.
- Gordon IJ, Hester AJ, Bianchet FM. 2004. The management of wild large herbivores to meet economic, conservation and environmental objectives. J Appl Ecol. 41(6):1021–1031.
- Karanth KU, Kumar NS. 2005. Distribution and dynamics of tiger and prey populations in Maharashtra, India. Final technical report. Bangalore (India): Centre for Wildlife Studies.
- Kearney M, Stuart BL. 2004. Repeated evolution of limblessness and digging heads in worm lizards revealed by DNA from old bones. Proc R Soc Lond B. 271(1549):1677–1683.
- Khaire D, Atkulwar A, Farah S, Baig M. 2016. Mitochondrial DNA analyses revealed low genetic diversity in the endangered Indian wild ass Equus hemionus khur. Mitochondrial DNA A. 12:1–6.
- Koressaar T, Remm M. 2007. Enhancements and modifications of primer design program Primer3. Bioinformatics. 23(10):1289–1291.
- Kumar S, Padmanabham PB, Ravuri RR, Uttaravalli K, Koneru P, Mukherjee PA, Das B, Kotal M, Xaviour D, Saheb SY, et al. 2008. The earliest settler’s antiquity and evolutionary history of Indian populations: evidence from M2 mtDNA lineage. BMC Evol Biol. 8(1):230.
- Librado P, Rozas J. 2009. DnaSP v5: A software for comprehensive analysis of DNA polymorphism data. Bioinformatics. 25(11):1451–1452.
- Loreille OM, Diegoli TM, Irwin JA, Coble MD, Parsons TJ. 2007. High efficiency DNA extraction from bone by total demineralization. Forensic Sci Int Genet. 1(2):191–195.
- Majumder PP. 2001. Ethnic populations of India as seen from an evolutionary perspective. J Biosci. 26(4):533–545.
- Matata AC, Adan A. 2018. Causes of climate change and its impact in the multi-sectoral areas in Africa-need for enhanced adaptation policies. CJAST. 27(3):1–10.
- Mattson DJ. 1997. Use of ungulates by Yellowstone grizzly bears Ursus arctos. Biol Conserv. 81(1–2):161–177.
- McNaughton SJ. 1979. Grazing as an optimization process grass ungulate relationships in the Serengeti. Am Nat. 113(5):691–703.
- Md-Zain BM, Abdul-Aziz A, Aifat NR, Mohd-Yusof NS, Norsyamimi R, Rovie-Ryan JJ, Karuppannan KV, Zulkifli NA YS. 2018. Sequence variation of captive Malayan gaur (Bos gaurus hubbacki) based on mitochondrial D-loop region DNA sequences. Biodiversitas. 19(5):1601–1606.
- Mondol S, Karanth KU, Ramakrishnan U. 2009. Why the Indian subcontinent holds the key to Global Tiger Recovery. PLOS Genet. 5(8):e1000585.
- Nichols RV, Cromsigt JGM, Spong G. 2015a. Using eDNA to experimentally test ungulate browsing preferences. Springerplus. 4:489.
- Nichols RV, Cromsigt JGM, Spong G. 2015b. DNA left on browsed twigs uncovers bite-scale resource use patterns in European ungulates. Oecologia. 178(1):275–284.
- Nichols RV, Königsson H, Danell K, Spong G. 2012. Browsed twig environmental DNA: diagnostic PCR to identify ungulate species. MolEcol Res. 12:983–989.
- Payne RB, Sorenson MD. 2002. Museum collections as sources of genetic data. Bonner ZoologischeBeiträge. 51:97–104.
- Rangarajan M. 2006. India’s wildlife history: an introduction. Bangalore: Orient Longman.
- Rosli MKA, Zakaria SS, Syed-Shabthar SMF, Zainal ZZ, Shukor MN, Mahani MC, Abas-Mazni O, Md-Zain BM. 2011. Phylogenetic relationships of Malayan gaur with other species of the genus Bos based on cytochrome b gene DNA sequences. Genet Mol Res. 10(1):482–493.
- Sharma S, Dutta T, Maldonado JE, Wood TC, Panwar HS, Seidensticker J. 2013. Spatial genetic analysis reveals high connectivity of tiger (Panthera tigris) populations in the Satpura-Maikal landscape of Central India. Ecol Evol. 3(1):48–60.
- Sonwa DJ, Dieye A, Mzouri EH, Majule A, Mugabe FT, Omolo N, Wouapi H, Obando J, Brooks N. 2017. Drivers of Climate Risk in African Agriculture. Climate Dev. 9(5):383–398.
- Tsangaras K, Ávila-Arcos MC, Ishida Y, Helgen KM, Roca AL, Greenwood AD. 2012. Historically low mitochondrial DNA diversity in koalas (Phascolarctos cinereus). BMC Genet . 13(1):92.
- Untergasser A, Cutcutache I, Koressaar T, Ye J, Faircloth BC, Remm M, Rozen SG. 2012. Primer3 - new capabilities and interfaces. Nucleic Acids Res. 40(15):e115–e115.