
Abstract
Ophichthidae is the most ecologically diverse family of the order Anguilliformes; however, high morphological similarity and a long larval stage make precise identification difficult. The aim of the present study was to examine the potential for barcoding of ophichthid fishes. A total of 81 mitochondrial cytochrome C oxidase subunit I (COI) barcode sequences were obtained from 23 species and 12 genera of ophichthid fishes collected in the Taiwan Strait. The average Kimura two-parameter distances within species, genera, and families were 0.48%, 18.25%, and 18.79%, respectively; thus, the mean interspecific distance was 31-fold higher than the mean intraspecific distance, which demonstrates good efficiency in DNA barcoding. The sequence divergence among species also varied substantially from 4.60% to 25.90%. This evaluation demonstrates the high efficiency of DNA barcoding for species identification to facilitate research on the diversity and conservation of ophichthid fishes.
Introduction
Ophichthidae is the most diverse family in the order Anguilliformes comprising 260 species in over 50 genera (McCosker Citation2010). Asian seas are highly enriched with these ophichthid fishes, including 23 genera and 59 species in East Asia and 13 genera and 33 species in China (Tang and Zhang Citation2004). In particular, the Taiwan Strait, as the passage between the East China Sea and South China Sea, is a subtropical, shallow continental shelf that has abundant fishery resources and also serves as an important habitat for ophichthid fishes. However, there is minimal taxonomic information on this population owing to the difficulty in identification, especially the larvae and eggs.
Ophichthid fishes are morphologically characterized by a slender body, round front section, and slightly flat tail, but lack typical fish structures such as scales, pelvic fins, and caudal fins (Ji et al. Citation2012). In contrast to other fishes, the Ophichthidae leptocephalus larvae are transparent and laterally compressed, making identification difficult, and the larval stage is relatively prolonged, ranging from months to years (Kimura et al. Citation2004; Choi et al. Citation2018). Morphological identification is also a challenge for adult fishes, owing to the few distinguishing morphological differences among species (Tang and Zhang Citation2004; McCosker Citation2010; Ji et al. Citation2012). The traits of different ophichthid genera can also be highly similar and overlap. For example, Scolecenchelys and Ophichthus both have overlapping branchiostegal rays (Tang and Zhang Citation2004). Thus, the classification and phylogenetic relationships of Ophichthidae have been a challenge, especially at the species level (Tang and Zhang Citation2004; Peninal et al. Citation2017; Choi et al. Citation2018).
Advances in molecular technology have improved species identification for all taxa, facilitating research and industrial applications, including the aquaculture industry. DNA barcoding uses short DNA sequences, typically a small segment of the mitochondrial cytochrome c oxidase subunit I (COI) gene, to identify species (P.D. Hebert et al. Citation2003; Savolainen et al. Citation2005). DNA barcoding has proven to be effective for the identification of fishes and the discovery of provisional cryptic diversity (Hubert et al. Citation2012). However, the DNA barcodes of ophichthid fishes have not yet been explored to date.
Therefore, with the goal of improving the molecular taxonomy of the Ophichthidae in the Taiwan Strait to best exploit this diverse resource, we evaluated the feasibility of DNA barcoding using a fragment of the mitochondrial COI for species identification. The generated DNA barcode records will provide a valuable research tool to improve the monitoring and conservation of fish diversity in this region.
Materials and methods
Sample collection
All fish specimens were captured with a trawl net at nine locations in the Taiwan Strait (). Specimens were identified, photographed, and measured by taxonomists, who mainly followed the identification keys of Min et al. (Citation2013). Two to four specimens of each fish species caught were used for DNA barcoding (). The voucher specimens were deposited in the Marine Biological Sample Museum at the Third Institute of Oceanography, Ministry of Natural Resources (Xiamen, China). A cube of lateral muscle from the right side of each fish sample was excised and stored in 95% ethanol at –20 °C.
Figure 1. Distribution of the sampling localities for the specimens collected in this study.
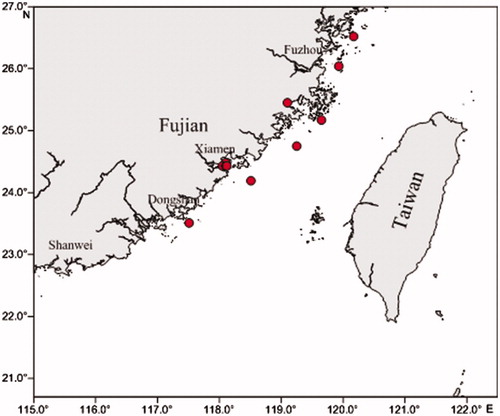
Table 1. Ophichthid species included in COI sequence analysis and accession numbers.
DNA extraction, amplification of mitochondrial COI, and sequencing
Genomic DNA was extracted from ethanol-preserved tissue samples according to the standard DNA barcoding methods for fish (Ward et al. Citation2005). The 5′ region of the mitochondrial COI gene was amplified by polymerase chain reaction (PCR) targeting a 655-bp fragment with the following primers (Ward et al. Citation2005):
FishF1-5′TCAACCAACCACAAAGACATTGGCAC3′;
FishF2-5′TCGACTAATCATAAAGATATCGGCAC3′;
FishR1-5′TAGACTTCTGGGTGGCCAAAGAATCA3′;
FishR2-5′ACTTCAGGGTGACCGAAGAATCAGAA3′.
The amplification reaction was performed in a total volume of 25 μl, including 16.25 μl ultrapure water, 2.25 μl 10× PCR buffer, 0.5 μl MgCl2 (25 mM), 1 μl each primer (10 mM), 2 μl each dNTP (0.2 mM), 1.25 U Taq DNA polymerase, and 1 μl DNA template. The PCR conditions were as follows: initial denaturation at 94 °C for 2 min; 35 cycles of denaturation at 94 °C for 30 s, annealing at 54 °C for 35 s, and elongation at 72 °C for 1 min; a final elongation step at 72 °C for 10 min; and holding at 4 °C. The PCR-amplified products were examined on 1% agarose gels. Sequencing in both directions was performed by Sangon Biotech (Shanghai).
Data analysis
SeqMan of DNAStar software was used to splice the forward and reverse sequencing results of each sample. The sequences were aligned by ClustalW in MEGA6.0 software. The Kimura-2-parameter (K2P) model (Kimura Citation1980) was used to calculate the intraspecific, interspecific, and intergeneric genetic divergences, and the phylogenetic tree was constructed using the neighbor-joining (NJ) method. The reliability of the branching tree was tested by bootstrap analysis using 1000 replicates.
Results
The COI gene fragment sequences were obtained from a total of 34 muscle samples from 10 species belonging to 7 genera in the order Ophichthidae collected from Taiwan Strait, and deposited in the GenBank (). After alignment, a 655-bp-long sequence was obtained at the 5′ end of the COI gene. Twenty haplotypes in the 34 COI sequences were identified (). The sequences of the samples and 47 sequences of Ophichthid fishes (sequence length ≥ 650 bp) from NCBI database were analyzed by MEGA6.0 software. All the COI sequences belonged to 23 species of 12 genera. The intraspecific, interspecific, and intergeneric genetic divergences were calculated and analyzed (, ); a larger genetic divergence indicates separation at higher taxonomic levels and a slower rate of increase in genetic divergence. The intraspecific genetic divergence of the COI sequences in all samples was 0.48%, with a maximum of 3.35% for Callechelys marmorata, followed by 1.09% for Callechelys muraena, 1.04 for Pisodonophis cancrivorus, and was below 1% for the other species. By contrast, the overall interspecific divergence was 18.25%.
Figure 2. Genetic distances among haplotypes within species, among species within genera, and among genera within families.
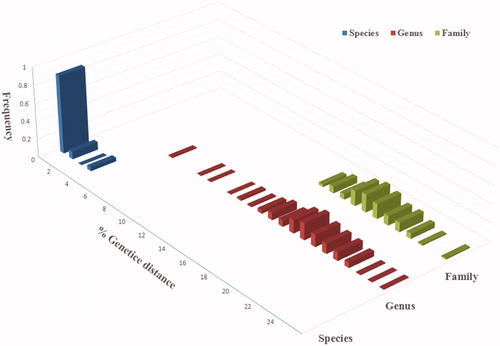
Table 2. Genetic divergence (% K2P distance) within various taxonomic levels.
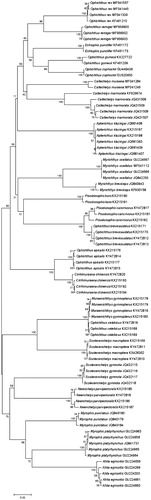
The NJ tree () showed that the 23 species clearly divided into 23 groups. All sequences of the same species converged together, consistent with the morphological analysis. However, the NJ tree for higher taxonomic levels (genus and above) was inconsistent with the morphological phylogenetic tree; samples of the same genus did not converge and there were intersecting lineages.
Figure 3. Neighbor-joining tree based on COI sequences using K2P distances.
Discussion
The efficiency of species identification by DNA barcoding is judged by the levels of intraspecific homogeneity and interspecific heterogeneity displayed by the targeted barcode gene (Peninal et al. Citation2017). In this study, the majority of intraspecific divergence levels were less than 1%, with very few around 2%, demonstrating good species identification capacity of the COI gene for identifying Ophichthidae fishes at the species level (Radulovici et al. Citation2010; de Brito et al. Citation2015). The interspecific genetic divergence was 38.02 times greater than the intraspecific genetic divergence, which is similar to the 26.2-fold difference observed in Canadian marine fishes (Kenchington et al. Citation2017) and the 25-fold difference observed in Australian marine fishes (Ward et al. Citation2005). This result further corresponds to the DNA barcoding principle that interspecific divergence must sufficiently outscore intraspecific divergence (Bingpeng et al. Citation2018), demonstrating the feasibility of DNA barcoding to identify the ophichthid fishes in Taiwan Strait.
There is one interesting case that merits further discussion. Some samples assigned to the species C. marmorata did not exhibit cohesive clustering in the phylogenetic tree, indicating deep divergence. One of these samples was from Baie Ternay (4.639 S 55.374 E, KF929674) and four were from Happiti Channel (17.589S 149.85 W, JQ431506- JQ431509) (Hubert et al. Citation2012), which fell into two groups with an average K2P genetic distance of 3.30%. This discrepancy might be because the two groups are closely related species or the genetically divergent populations of the same species. Morphological characteristics of closely related species are similar, resulting in easy misidentification that will change the outcome of NJ tree. Indeed, morphological misidentification of voucher specimens, DNA contamination, and incomplete knowledge of the taxonomic literature can all contribute to ambiguous barcoding results (Tautz et al. Citation2003; Radulovici et al. Citation2010). Therefore, morphological characteristics are also necessary for species identification.
Alternatively, higher divergence within a species often reflects geographical isolation due to episodes of gene pool fragmentation (P.D. N. Hebert et al. Citation2003). In general, gene flow directly affects the population genetic structure (Lee et al. Citation2017). Gene flow among breeding colonies prevents the genetic differentiation between populations, whereas physical and ecological barriers such as those separating Australia, New Zealand, and Southeast Asian countries prevent gene flow between populations. Thus, isolation by distance is likely an important biological factor shaping the current pattern of population structure for C. marmorata, which may reflect the divergent oceanographic features between the Indian Ocean and Pacific Ocean.
In this study, the NJ phylogenetic tree was consistent with the morphological analysis at the species level, demonstrating the examined species could be authenticated by the barcode approach and the feasibility for the low-order phylogenetic analysis using COI sequences in the identification of ophichthid fishes. However, samples of the same genus did not converge into the same branch of the phylogenetic NJ tree, and there was also overlap between samples of different families and genera, indicating inconsistency with the morphological phylogenetic tree that significantly reduces the reliability of this approach. This discrepancy is likely due to the higher variability of the COI gene sequence at the genus level and above. The obtained sequence was only a 655-bp fragment of the 5′ end of the COI gene with a relatively small number of informative sites. Since base substitutions among higher taxonomic levels tend to be saturated, this reduces the resolution at the phylogenetic level. Therefore, our findings demonstrate that the COI gene sequence is unsuitable as a molecular marker for the phylogenetic analysis of ophichthid fishes above the species level, such as at the genus and family levels.
Disclosure statement
No potential conflict of interest was reported by the author(s).
Data availability statement
The data that support the findings of this study are openly available in [NCBI] at https://www.ncbi.nlm.nih.gov/, reference number [KX215170 KX215171 KY472812 KY472813 KX215176 KX215177 KY472814 KY472815 KX215188 KX215189 KY472819 KX215169 KX426302 KY472810 KY472811 KX215178 KX215179 KX215180 KY472816 KX215181 KX215182 KY472817 KX215190 KX215191 KX215185 KX215186 KX215187 KY472818 KX215192 KX215193 KX215194 KY472820 KX215197 KX215198].
References
- Bingpeng X, Heshan L, Zhilan Z, Chunguang W, Yanguo W, Jianjun W. 2018. DNA barcoding for identification of fish species in the Taiwan Strait. PLOS One. 13(6):e0198109.
- Choi HY, Oh J, Kim S. 2018. Genetic identification of eggs from four species of Ophichthidae and Congridae (Anguilliformes) in the northern East China Sea. PLOS One. 13(4):e0195382.
- De Brito MA, Schneider H, Sampaio I, Santos S. 2015. DNA barcoding reveals high substitution rate and mislabeling in croaker fillets (Sciaenidae) marketed in Brazil: the case of “pescada branca” (Cynoscion leiarchus and Plagiosdon squamosissimus). Food Res Int. 70:40–46.
- Hebert PD, Cywinska A, Ball SL, deWaard JR. 2003. Biological identifications through DNA barcodes. Proc R Soc Lond B. 270(1512):313–321.
- Hebert PDN, Ratnasingham S, de Waard JR. 2003. Barcoding animal life: cytochrome c oxidase subunit 1 divergences among closely related species. Proc R Soc Biol Sci B. 270:S96–S99.
- Hubert N, Meyer CP, Bruggemann HJ, Guerin F, Komeno RJ, Espiau B, Causse R, Williams JT, Planes S. 2012. Cryptic diversity in Indo-Pacific coral-reef fishes revealed by DNA-barcoding provides new support to the centre-of-overlap hypothesis. PLOS One. 7(3):e28987.
- Ji HS, Lee HW, Hong BK, Kim JK. 2012. Four newly reported ophichthid leptocephali species revealed by mitochondrial 12S rDNA, with implications of their occurrence in Korea. Anim Cell Syst. 16(5):415–424.
- Kenchington EL, Baillie SM, Kenchington TJ, Bentzen P. 2017. Barcoding Atlantic Canada’s mesopelagic and upper bathypelagic marine fishes. PLOS One. 12(9):e0185173.
- Kimura M. 1980. A simple method for estimating evolutionary rates of base substitutions through comparative studies of nucleotide sequences. J Mol Evol. 16(2):111–120. doi:10.1007/BF01731581.
- Kimura Y, Ishikawa S, Tokai T, Nishida M, Tsukamoto K. 2004. Early life history characteristics and genetic homogeneity of Conger myriaster leptocephali along the east coast of central Japan. Fish Res. 70(1):61–69.
- Lee MY, Kwon IK, Lee K, Choi SK, Jeon HS, Lee JY, Eo KY, Kim HJ, Kim JH, Johnson WE, Yoo JC, et al. 2017. Genetic diversity and population structure of the Black-faced Spoonbill (Platalea minor) among its breeding sites in South Korea: implication for conservation. Biochem Syst Ecol. 71:106–113.
- McCosker JE. 2010. Deepwater Indo-Pacific species of the snake-eel genus Ophichthus (Anguilliformes: Ophichthidae), with the description of nine new species. Zootaxa. 2505(1):1–39.
- Min L, Xiao C, Shengyun Y. Marine fishes of Southern Fujian, China. Beijing, China: Oceanpress, 2013.
- Peninal S, Subramanian J, Elavarasi A, Kalaiselvam M. 2017. Genetic identification of marine eels through DNA barcoding from Parangipettai coastal waters. Genom Data. 11:81–84.
- Radulovici AE, Archambault P, Dufresne F. 2010. DNA barcodes for marine biodiversity: moving fast forward?. Diversity. 2(4):450–472.
- Savolainen V, Cowan RS, Vogler AP, Roderick GK, Lane R. 2005. Towards writing the encyclopaedia of life: an introduction to DNA barcoding. Phil Trans R Soc B. 360(1462):1805–1811.
- Tang WQ, Zhang CG. 2004. A taxonomic study on snake eel family Ophichthidae in China with the review of Ophichthidae (Pisces, Anguiliformes). J Shanghai Fish Univ. 13:16–22.
- Tautz D, Arctander P, Minelli A, Thomas RH, Vogler AP. 2003. A plea for DNA taxonomy. Trends Ecol Evol. 18(2):70–74.
- Ward RD, Zemlak TS, Innes BH, Last PR, Hebert PD. 2005. DNA barcoding Australia’s fish species. Phil Trans R Soc B. 360(1462):1847–1857.