
Abstract
The DNA barcode data of venomous cobra species (Naja naja and Naja kaouthia) are limited in the global database, especially from India and Bangladesh. Owing to the rapid success of DNA barcoding for discriminating a variety of species around the world, the present study aimed to generate the mitochondrial cytochrome c oxidase subunit I (COI) gene information of two morphologically identified deadly elapid species from the Mizoram state in northeast India and Rangpur in northern Bangladesh. The multiple species delimitation methods: Automatic Barcode Gap Discovery (ABGD), General Mixed Yule-Coalescent (GMYC), and Poisson-Tree-Processes (bPTP) revealed 14, 16, and 18 molecular operational taxonomic units (MOTUs) for 12 Naja species. The binocellate cobra, N. naja showed monophyletic clustering in both maximum-likelihood (ML) and Bayesian (BA) trees, single MOTU in ABGD and GMYC, and negligible intra-species genetic distance (0.2%) with two haplotypes. However, the monocellate cobra, N. kaouthia showed paraphyletic and polytomy in ML and BA phylogenies respectively; more than one MOTUs in ABGD, GMYC, and bPTP analyses; and sufficient intra-species genetic distances (0.6–2.3%) with five haplotypes related to the diverse geographical locations in Bangladesh, China, India, and Thailand. By superimposing the executed species delimitation criteria, the present molecular-based investigation concludes the presence of cryptic diversity of N. kaouthia in Indo-Bangladesh, China, and Thailand.
Introduction
Cobras are a group of venomous elapid snakes distributed in Africa and Asia (Wallach et al. Citation2014). They can spread their neck ribs to form a flattened, widened hood in a characteristic threat display, making them a favorite of snake charmers because of the dramatic effect. Due to unique hood-spreading behavior and deadly toxicity, they have also fascinated worldwide. Further, the defensive innovation and significant increase of cytotoxicity in cobra species is evidenced to be linked with the evolution with hooding and their aposematic marking, and spitting (Panagides et al. Citation2017; Ashraf et al. Citation2019). A total of 11 oviparous species are considered under the subgenus Naja (Wüster et al. Citation2007). Among them, Naja naja occurs in Afghanistan, Bangladesh, Bhutan, India, Myanmar, Nepal, Pakistan, and Sri Lanka; and Naja kaouthia ranges from Southwestern China and South to Southeastern Asia (Ashraf et al. Citation2019). Naja kaouthia is categorized as a least concern species; however, the status of N. naja is still unknown in the International Union for Conservation of Nature (IUCN) Red List (IUCN Citation2020). However, due to habitat loss, illegal wildlife crime, and killing by the general mass due to fear; these reptiles population is dramatically declining in India and Bangladesh.
These elapid species are venomous and cause high mortality and disability in both India and Bangladesh (Alirol et al. Citation2010; Williams et al. Citation2019). It is reported that the yearly incidence of snakebite caused by venomous snakes are 46,000 deaths with 140,000 disabilities in India and 623.4 to 789.2 per 100,000 persons with 6041 deaths in Bangladesh (Rahman et al. Citation2010; Mohapatra et al. Citation2011; Dandona et al. Citation2018; Laxme et al. Citation2019). Due to the significant risk of human health; the World Health Organization (WHO) considered the venomous snakebite as a neglected tropical disease and plunged the snakebite envenoming guidelines with the aim of diminishing the number of casualties before 2030 (Gutiérrez et al. Citation2006; WHO Citation2019). In India, a polyvalent antivenom is routinely used for the treatment of envenomations from the so-called ‘big four’ snakes (N. naja, Bungarus caeruleus, Daboia russelii, and Echis carinatus) and other venomous snakes species (Laxme et al. Citation2019) and Bangladesh is mostly dependent on India for importing the antivenom (Deka et al. Citation2019). As a result, the antivenom is often non-effective to the victim due to a lack of precise venom profiling among widespread snake species. It is evident that the significant compositional variation was found in the venom proteins of N. naja within the Indian sub-continent (Dutta et al. Citation2017). Diverse ecological factors and diet may lead to alteration of nucleotide composition, protein function, and subsequently to the enzymatic modifications within the same or different species of snakes (Daltry et al. Citation1996; Barlow et al. Citation2009).
The DNA sequences are enormously used as a supplementary tool for biodiversity assessment and systematics studies (Slowinski and Lawson Citation2002; Nagy et al. Citation2012; Pyron et al. Citation2013; Chambers and Hebert Citation2016; Figueroa et al. Citation2016). Besides evolutionary relationship, both morphology and DNA data effectively detect the cryptic diversity and species complexes of Naja species from different geographical areas (Wüster and Thorpe Citation1989; Wüster et al. Citation1995; Wüster et al. Citation2007; Lin, Li, et al. Citation2008; Lin, Zhao, et al. Citation2008; Lin et al. Citation2014; Ratnarathorn et al. Citation2019). Especially, the DNA barcoding is one of the most fruitful molecular techniques in biodiversity research and has been extensively applied in different faunal groups throughout the globe (Hebert et al. Citation2003; Laskar et al. Citation2018). Besides rapid species identification, this approach is also performed to detect the Molecular Taxonomic Units (MOTUs) (Tyagi et al. Citation2017, Citation2019). Further, this molecular tool is also successfully evident in forensic science by naming the unknown snakes from their venoms (Sharma et al. Citation2016; Smith et al. Citation2018). The earlier study suggested significant genetic divergence was observed in the different population of two deadly snakes in India and other adjacent countries (Ophiophagus hannah and Bungarus fasciatus) (Kundu et al. Citation2020). However, the population genetic diversity of N. naja and N. kaouthia is yet to be explored especially from Indo-Bangladesh region. Hence, in this present study, we sampled two Naja species from Mizoram state in northeast India and Bangladesh. We used phylogenetic analysis, estimation of genetic divergence, and haplotype networks to ascertain the population genetic diversity of these two deadly snakes in India and Bangladesh.
Materials and methods
Two specimens each of N. naja and N. kaouthia were collected from Rangpur district, Bangladesh (Table S1, ). Further, six live specimens of N. kaouthia were collected from different localities in Mizoram state from northeast India (Table S1, ). Both N. naja and N. kaouthia were identified based on the morphological characters following previous literature and field guide books (Smith Citation1943; Wüster Citation1998; Whitaker and Captain Citation2004). The sampling permission was obtained from the Chief Wildlife Warden of Environment, Forests and Climate Change, Govt. of Mizoram, India. The muscle tissue was collected from each dead specimen and preserved in 70% ethanol until molecular investigation. The whole body specimens were kept as vouchers in the Department of Zoology, Mizoram University, India, and the Department of Zoology, University of Chittagong, Bangladesh.
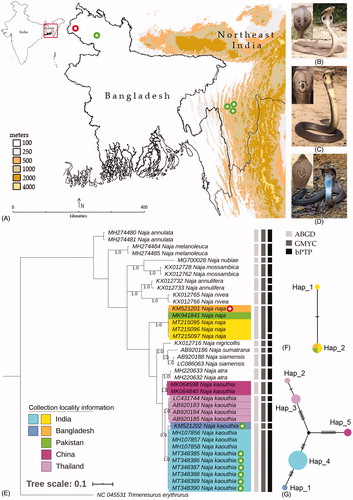
Figure 1. (A) Collection locality map of N. naja and N. kaouthia from Indo-Bangladesh region. (B–D) Live photographs of N. naja and N. kaouthia collected from Indo-Bangladesh region, (E) Bayesian analysis based on partial mtCOI gene inferred phylogenetic relationship of Naja species. The clades of N. naja and N. kaouthia are marked by different colors as per their collection locality information. The generated sequences are marked by different color dots as used in collection locality map. Gray shades color bars beside the tree species delimitation methods indicate delineated MOTUs by different species delimitation methods (ABGD, GMYC, and bPTP), (F–G) TCS networks showed distinct haplotype of N. naja and N. kaouthia collected from Indo-Bangladesh region. The estimated haplotypes are shown in different colors as represent by collection localities marked in the phylogeny.
The genomic DNA was extracted by using QIAamp DNA Mini Kit (Qiagen, Valencia, CA) as per the manufacturer’s protocols. The genomic DNA was stored at −30 °C in the Center for DNA Taxonomy laboratory, Molecular Systematics Division, Zoological Survey of India, Kolkata. The published degenerative primer pair (Nagy et al. Citation2012): RepCOI-F: 5′-TNTTMTCAACNAACCACAAAGA-3′ and RepCOI-R: 5′-ACTTCTGGRTGKCCAAARAAT CA-3′ was used to amplify the partial mitochondrial cytochrome c oxidase subunit I (COI) gene on a Veriti® Thermal Cycler (Applied Biosystems, Foster City, CA). The 30 µl PCR mixture contains 10 pmol of each primer, 100 ng of DNA template, 1 × PCR buffer, 1.0–1.5 mM of MgCl2, 0.25 mM of each dNTPs, and 1 U of Taq polymerase (Takara Bio Inc., Japan). The thermal profile was set as 94 °C for 3 min; 40 cycles of 94 °C for 40 s, 48.5 °C for 30 s and 72 °C for 60 s; 72 °C for 7 min, and subsequent hold at 4 °C. The PCR amplified products were checked in 1% agarose gel containing Ethidium bromide (10 mg/ml). The PCR products were purified using QIAquickR Gel extraction Kit (Qiagen, Valencia, CA) according to the manufacturer’s protocols. The cycle sequencing of the purified PCR products (15 ng) was performed with BigDye® Terminator ver. 3.1 Cycle Sequencing Kit (Applied Biosystems, Foster City, CA) by using 3.2 Picomoles of PCR primer pair. The thermal profile of the Cycle Sequencing was set as: 96 °C for 1 min, followed by 25 cycles of 96 °C for 10 s, 50 °C for 5 s and a final extension at 60 °C for 1 min 15 s on a Veriti® Thermal Cycler. The cycle sequencing products were further cleaned by using BigDye X-terminator kit (Applied Biosystems, Foster City, CA) and Sanger sequencing was performed on 48 capillary ABI 3730 Genetic analyzer.
To diminish the low-quality sequence reads and gaps, the generated contigs were assured through SeqScanner V1.0 (Applied Biosystems Inc., Foster City, CA), nucleotide BLAST (https://blast.ncbi.nlm.nih.gov/), and ORF finder (https://www.ncbi.nlm.nih.gov/orffinder/). The generated sequences were submitted to the global GenBank database to acquire the accession numbers. To calculate the genetic distance, phylogenetic analysis, and haplotyping networks, 30 publicly available sequences were downloaded from GenBank. To build a studied dataset, both generated and database sequences were aligned together by using ClustalX (Thompson et al. Citation1997). The Kimura 2 parameter (K2P) genetic distances and Maximum Likelihood (ML) topology were estimated by MEGAX (Kumar et al. Citation2018). The best model for Bayesian analysis (BA) was calculated through Mr.Modeltest v2 with the lowest BIC value (Nylander Citation2004). The BA phylogeny was built in Mr. Bayes 3.1.2 by selecting nst = 6 and rates = invgamma for GTR + G + I model. The MCMC (one cold and three hot chains) was run for 10,000,000 generations with 25% burn-in and trees saving at every 100 generations (Ronquist and Huelsenbeck Citation2003). The BA phylogeny was further adorned in the web-based iTOL tool (https://itol.embl.de/) (Letunic and Bork Citation2007). The GenBank sequence of Trimeresurus erythrurus (Accession No. NC_045531) under family Viperidae was used as an out-group. To recognize the genealogical connections, the haplotype networks were constructed within the different populations of N. naja and N. kaouthia. The numbers of haplotypes were generated by using DnaSP v6 (Rozas et al. Citation2017). The haplotype diversity (Hd) and the number of polymorphic sites, for a diverse population of both the species, were also estimated through DnaSP v6. The haplotype networks were constructed by PopART (http://popart.otago.ac.nz) (Leigh and Bryant Citation2015) with standard Templeton, Crandall, and Sing (TCS) method (Clement et al. Citation2000). Further, to estimate the below species-level diversity; three species delimitation methods: Automatic Barcode Gap Discovery (ABGD) (Puillandre et al. Citation2012), the General Mixed Yule-coalescent (GMYC; Fujisawa and Barraclough Citation2013), and Poisson-Tree-Processes (bPTP) (Zhang et al. Citation2013) were executed to discern the molecular operational taxonomic units (MOTUs). The ABGD analysis was carried out on the web interface (www.abi.snv.jussieu.fr/public/abgd/) with Jukes-Cantor (JC69) and p-distance with relative gap width (X = 1.5). The ultrametric tree was generated by BEAST (Drummond and Rambaut Citation2007) with GTR + I+G model and run for 10 million generations, with a sampling frequency of every 100 generations. The Tree Annotator was used for visualizing the output tree with the following settings: 10% burn-in, 0.5 posterior probability limits. For GMYC analysis, both single and multiple thresholds were carried out in RStudio (https://www.r-project.org/) using packages like ‘ape’ and ‘splits’ (Paradis et al. Citation2004; Ezard et al. Citation2009). The ML tree was further constructed in RAxML (Stamatakis Citation2006) with GTR + I+G model to execute the bPTP analysis on the web interface (http://species.h-its.org/ptp/).
Results and discussion
The South and Southeast Asia encompasses 13 biodiversity hotspots and shared about 20 percent of the global plant, animal and marine species. Among them, the Indo-Burma is one of the most significant biodiversity hotspots which covers the political boundaries of many countries begins in eastern Bangladesh and then extends across north-eastern India, Myanmar, part of southern and western Yunnan Province in China, Lao People’s Democratic Republic, Cambodia and Vietnam, majority of Thailand and part of Peninsular Malaysia. The five Indian states (Assam, Manipur, Meghalaya, Mizoram, and Nagaland) and Chittagong Hill Tract of Bangladesh are situated in between this hotspot region. The diverse topography and climatic condition, and patterns of seasonal rainfall along with long geological history triggered the diversity and endemism of floral and faunal composition in this region (Ali and Aitchison Citation2008). The Indo-Burma hotspot harbors more than 400 mammals, 1200 birds, 500 reptiles, and 300 amphibians (Tordoff et al. Citation2011).
The morphological characters are promptly identifying the cobra species, but their body size asymmetry and coloration frequently induce confusion in identification (Wüster Citation1996; Ratnarathorn et al. Citation2019). The use of molecular tools effectively add-on to overcome the taxonomic challenges by accurate species or below species identification and also adjudicating to conceive the evolutionary trends of organisms linked with the paleogeographic events (Raxworthy et al. Citation2002; Burbrink and Lawson Citation2007). Owing to the success of the mitochondrial gene for ascertaining boundaries between snake species (Slowinski and Keogh Citation2000; Nagy et al. Citation2012; Chambers and Hebert Citation2016; Laopichienpong et al. Citation2016), the present study was aimed to generate the DNA barcode sequence information of two morphologically identified cobra species. Based on the collection locality information, the database sequences were further merged into the dataset of 12 Naja species to estimate the genetic divergence, phylogenetic, and haplotype analysis. Altogether, the Naja species showed overall mean K2P genetic distance of the studied dataset was 9.4%. Excluding the singleton species, the intra-species mean genetic distance within the studied Naja species was 0–1.3%. The inter-species K2P genetic distance was ranging from 3.5% (N. kaouthia and Naja atra) to 17.5% (N. kaouthia and Naja nubiae). Both N. naja and N. kaouthia also showed an 8.7% genetic distance between each other. The ML and BA analyses yielded similar topologies in the present dataset (Figure S1, ). Most of the studied species showed monophyletic clustering except for N. kaouthia. The DNA barcodes of N. kaouthia generated from China showed paraphyletic clustering in ML tree and polytomy in BA analysis. The monocellate cobra (N. kaouthia) showed a sister relationship with N. atra, while the binocellate cobra (N. naja) shared ancestral linkages with five cobra species (N. nigricollis, N. sumatrana, N. siamensis, N. atra and N. kaouthia). The multiple species delimitation methods: ABGD, GMYC, and bPTP yielded 14 (Tables S2 and S3), 16 (Table S4, Figure S2), and 18 (Table S5, Figure S3) MOTUs, respectively.
The DNA barcode sequences of N. naja are almost identical and showed negligible genetic distances (0–0.2%) collected from the wide geographical region from Pakistan, India, and Bangladesh. The DNA data of N. naja showed a single MOTU in both ABGD and GMYC analyses, however, it yielded two MOTUs in bPTP analysis. The DNA sequences of N. naja revealed two haplotypes with a single polymorphic site, haplotype diversity = 1.00. The TCS network showed a single haplotype of N. naja collected from Pakistan, India, Bangladesh, and the other haplotype represent by a single sequence generated from India (). Further, the sequences of N. kaouthia yielded three MOTUs in ABGD analysis, however, five MOTUs in both GMYC and bPTP analyses. The intra-species K2P genetic distance of N. kaouthia was ranging from 0.6 to 3.0% based on different collection localities. The Indian specimens showed 0.6% genetic distances from the Bangladesh specimen, 1.8% from the Thailand specimens, and 2.3% from the Chinese specimens. The DNA sequences of N. kaouthia also revealed five haplotypes with 26 polymorphic sites and haplotype diversity = 0.66 (Table S6). The TCS network showed a distinct haplotype of N. kaouthia sequences collected from Mizoram state in northeast India. The sequence generated from India, Bangladesh, and China yielded a single haplotype; however, the sequences generated from Thailand showed two different haplotypes in the present dataset (). Therefore, by superimposing the multiple species delimitation methods, reciprocal monophyly criteria, and genetic distance; the present molecular-based investigation of N. kaouthia, elucidates the presence of cryptic diversity in Indo-Bangladesh, China, and Thailand as corroborated in the earlier study (Ratnarathorn et al. Citation2019). Although, the phylogenetic study does not illustrate venom composition, but contributes to the resolution of the systematics of medically important snakes as well as provides a framework for the elucidation of the patterns and causes of the evolution of venom composition (Thorpe et al. Citation2007). Thus, the present population genetic diversity is not only elucidated the below species-level information of Naja species, but also encouraged other biological, ecological, and biochemical studies of these two deadly cobra species to improve medical avenues in India and Bangladesh.
tmdn_a_1778552_sm4424.docx
Download MS Word (739.5 KB)Acknowledgments
We are thankful to the Director of Zoological Survey of India (ZSI), Ministry of Environment, Forest and Climate Change (MoEF&CC), Govt. of India for providing necessary molecular facilities and support for the study. We are grateful to Michael Lalrinsangi, Lalrinsanga, David Rosangliana, Michael V.L., Chhuana, and Zonunsanga, Mr. Abu Saeed, Tarik Kabir, Manirul Islam, and Mrs. Simoon Nahar for their assistance during the field visit. The first author (SK) acknowledges the fellowship grant received from the Council of Scientific and Industrial Research (CSIR) Senior Research Associateship (Scientists’ Pool Scheme) Pool No. 9072-A. The second author (HTL) would like to express his sincere thanks to the Chief Wildlife Warden, Department of Environment, Forest and Climate Change, Govt. of Mizoram for the collection permission and the DST (SERB), New Delhi for financial support.
Disclosure statement
No potential conflict of interest was reported by the author(s).
Data availability statement
The data that support the findings of this study are openly available in NCBI GenBank database (https://www.ncbi.nlm.nih.gov) with the accession numbers (KM521201, KM521202, and MT348385-MT348390) which permits unrestricted use, distribution, and reproduction in any medium, provided the original work is properly cited.
Additional information
Funding
References
- Ali JR, Aitchison JC. 2008. Gondwana to Asia: plate tectonics, paleogeography and the biological connectivity of the Indian subcontinent from the Middle Jurassic through latest Eocene (166-35 Ma). Eart Sci Rev. 88(3–4):145–166.
- Alirol E, Sharma SK, Bawaskar HS, Kuch U, Chappuis F. 2010. Snake bite in South Asia: a review. PLoS Negl Trop Dis. 4(1):e603.
- Ashraf MR, Nadeem A, Smith EN, Javed M, Smart U, Yaqub T, Hashmi AS. 2019. Molecular phylogenetics of Black Cobra (Naja naja) in Pakistan. Electron J Biotechn. 42:23–29.
- Barlow A, Pook CE, Harrison RA, Wüster W. 2009. Coevolution of diet and prey-specific venom activity supports the role of selection in snake venom evolution. Proc Biol Sci. 276(1666):2443–2449.
- Burbrink FT, Lawson R. 2007. How and when did old world ratsnakes disperse into the new world? Mol Phylogenet Evol. 43(1):173–189.
- Chambers EA, Hebert PD. 2016. Assessing DNA barcodes for species identifcation in North American reptiles and amphibians in natural history collections. PLoS One. 11(4):e0154363.
- Clement M, Snell Q, Walker P, Posada D, Crandall K. 2000. TCS: a computer program to estimate gene genealogies. Mol Ecol. 9(10):1657–1659.
- Daltry JC, Wüster W, Thorpe RS. 1996. Diet and snake venom evolution. Nature. 379(6565):537–540.
- Dandona R, Kumar GA, Kharyal A, George S, Akbar M, Dandona L. 2018. Mortality due to snakebite and other venomous animals in the Indian state of Bihar: findings from a representative mortality study. PLoS One. 13(6):e0198900.
- Deka A, Reza MA, Hoque KMF, Deka K, Saha S, Doley R. 2019. Comparative analysis of Naja kaouthia venom from North-East India and Bangladesh and its cross reactivity with Indian polyvalent antivenoms. Toxicon. 164:31–43.
- Drummond AJ, Rambaut A. 2007. BEAST: Bayesian evolutionary analysis by sampling trees. BMC Evol Biol. 7:214.
- Dutta S, Chanda A, Kalita B, Islam T, Patra A, Mukherjee AK. 2017. Proteomic analysis to unravel the complex venom proteome of eastern India Naja naja: correlation of venom composition with its biochemical and pharmacological properties. J Proteomics. 156:29–39.
- Ezard T, Fujisawa T, Barraclough TG. 2009. Splits: SPecies’ LImits by Threshold Statistics. R Package Version 1.0-14/r31. http://R-Forge.R-project.org/projects/splits/
- Figueroa A, McKelvy AD, Grismer LL, Bell CD, Lailvaux SP. 2016. A species-level phylogeny of extant snakes with description of a new colubrid subfamily and genus. PLoS One. 11(9):e0161070.
- Fujisawa T, Barraclough TG. 2013. Delimiting species using single-locus data and the Generalized Mixed Yule Coalescent approach: a revised method and evaluation on simulated data sets. Syst Biol. 62(5):707–724.
- Gutiérrez JM, Theakston RDG, Warrell DA. 2006. Confronting the neglected problem of snake bite envenoming: the need for a global partnership. PLoS Med. 3(6):e150.
- Hebert PDN, Cywinska A, Ball SL, deWaard JR. 2003. Biological identifications through DNA barcodes. Proc Biol Sci. 270(1512):313–321.
- IUCN. 2020. The IUCN Red List of Threatened Species. Version 2020.1. [Accessed 1 May 2020]. https://www.iucnredlist.org
- Kumar S, Stecher G, Li M, Knyaz C, Tamura K. 2018. MEGA X: Molecular Evolutionary Genetics Analysis across computing platforms. Mol Biol Evol. 35(6):1547–1549.
- Kundu S, Lalremsanga HT, Tyagi K, Biakzuala L, Kumar V, Chandra K. 2020. Mitochondrial DNA discriminates distinct population of two deadly snakes (Reptilia: Elapidae) in Northeast India. Mitochondrial DNA Part B. 5(2):1530–1534.
- Laopichienpong N, Muangmai N, Supikamolseni A, Twilprawat P, Chanhome L, Suntrarachun S, Peyachoknagul S, Srikulnath K. 2016. Assessment of snake DNA barcodes based on mitochondrial COI and Cytb genes revealed multiple putative cryptic species in Thailand. Gene. 594(2):238–247.
- Laskar BA, Kumar V, Kundu S, Tyagi K, Chandra K. 2018. Taxonomic quest: validating two mahseer fishes (Actinopterygii: Cyprinidae) through molecular and morphological data from biodiversity hotspots in India. Hydrobiologia. 815(1):113–124.
- Laxme SRR, Khochare S, de Souza HF, Ahuja B, Suranse V, Martin G, Whitaker R, Sunagar K. 2019. Beyond the ‘big four’: venom profiling of the medically important yet neglected Indian snakes reveals disturbing antivenom deficiencies. PLoS Negl Trop Dis. 13(12):e0007899.
- Leigh JW, Bryant D. 2015. POPART: full-feature software for haplotype network construction. Methods Ecol Evol. 6(9):1110–1116.
- Letunic I, Bork P. 2007. Interactive Tree Of Life (iTOL): an online tool for phylogenetic tree display and annotation. Bioinformatics. 23(1):127–128.
- Lin H-C, Li S-H, Fong J, Lin S-M. 2008. Ventral coloration differentiation and mitochondrial sequences of the Chinese cobra (Naja atra) in Taiwan. Conserv Genet. 9(5):1089–1097.
- Lin L-H, Hua L, Qu Y-F, Gao J-F, Ji X. 2014. The phylogeographical pattern and conservation of the Chinese cobra (Naja atra) across its range based on mitochondrial control region sequences. PLoS One. 9(9):e106944.
- Lin L-H, Zhao Q, Ji X. 2008. Conservation genetics of the Chinese cobra (Naja atra) investigated with mitochondrial DNA sequences. Zool Sci. 25(9):888–893.
- Mohapatra B, Warrell DA, Suraweera W, Bhatia P, Dhingra N, Jotkar RM, Rodriguez PS, Mishra K, Whitaker R, Jha P. 2011. Snakebite mortality in India: a nationally representative mortality survey. PLoS Negl Trop Dis. 5(4):e1018.
- Nagy ZT, Sonet G, Glaw F, Vences M. 2012. First large-scale DNA barcoding assessment of reptiles in the biodiversity hotspot of Madagascar, based on newly designed COI primers. PLoS One. 7(3):e34506.
- Nylander J. 2004. Mr.Modeltest v2, program distributed by the author. Uppsala (Sweden): Evolutionary Biology Centre, Uppsala University.
- Panagides N, Jackson TN, Ikonomopoulou MP, Arbuckle K, Pretzler R, Yang DC, Ali SA, Koludarov I, Dobson J, Sanker B, et al. 2017. How the cobra got its flesh-eating venom: cytotoxicity as a defensive innovation and its co-evolution with hooding, aposematic marking, and spitting. Toxins. 9(3):103.
- Paradis E, Claude J, Strimmer K. 2004. APE: Analyses of Phylogenetics and Evolution in R language. Bioinformatics. 20(2):289–290.
- Puillandre N, Lambert A, Brouillet S, Achaz G. 2012. ABGD, Automatic Barcode Gap Discovery for primary species delimitation. Mol Ecol. 21(8):1864–1877.
- Pyron RA, Burbrink FT, Wiens JJ. 2013. A phylogeny and revised classification of Squamata, including 4161 species of lizards and snakes. BMC Evol Biol. 13:93.
- Rahman R, Faiz MA, Selim S, Rahman B, Basher A, Jones A, d’Este C, Hossain M, Islam Z, Ahmed H, et al. 2010. Annual incidence of snake bite in rural Bangladesh. PLoS Negl Trop Dis. 4(10):e860.
- Ratnarathorn N, Harnyuttanakorn P, Chanhome L, Evans SE, Day JJ. 2019. Geographical differentiation and cryptic diversity in the monocled cobra, Naja kaouthia (Elapidae), from Thailand. Zool Scr. 48(6):711–726.
- Raxworthy CJ, Forstner MRJ, Nussbaum RA. 2002. Chameleon radiation by oceanic dispersal. Nature. 415(6873):784–787.
- Ronquist F, Huelsenbeck JP. 2003. MrBayes 3: Bayesian phylogenetic inference under mixed models. Bioinformatics. 19(12):1572–1574.
- Rozas J, Ferrer-Mata A, Sanchez-DelBarrio J, Guirao-Rico S, Librado P, Ramos-Onsins S, Sanchez-Gracia A. 2017. DnaSP 6: DNA sequence polymorphism analysis of large data sets. Mol Biol Evol. 34(12):3299–3302.
- Sharma SK, Kuch U, Höde P, Bruhse L, Pandey DP, Ghimire A, Chappuis F, Alirol E. 2016. Use of molecular diagnostic tools for the identification of species responsible for snakebite in Nepal: a pilot study. PLoS Negl Trop Dis. 10(4):e0004620.
- Slowinski JB, Keogh JS. 2000. Phylogenetic relationships of elapid snakes based on cytochrome b mtDNA sequences. Mol Phylogenet Evol. 15(1):157–164.
- Slowinski JB, Lawson R. 2002. Snake phylogeny: evidence from nuclear and mitochondrial genes. Mol Phylogenet Evol. 24(2):194–202.
- Smith CF, McGlaughlin ME, Mackessy SP. 2018. DNA barcodes from snake venom: a broadly applicable method for extraction of DNA from snake venoms. BioTechniques. 65(6):339–345.
- Smith MA. 1943. Fauna of British India, Ceylon and Burma. In: Reptilia and amphibia. Vol. 3: Serpentes. London (UK): Tailor and Francis Ltd.
- Stamatakis A, 2006. RAxML-VI-HPC: maximum likelihood-based phylogenetic analyses with thousands of taxa and mixed models. Bioinformatics. 22(21):2688–2690.
- Thompson JD, Gibson TJ, Plewniak F, Jeanmougin F, Higgins DG. 1997. The CLUSTAL_X windows interface: flexible strategies for multiple sequence alignment aided by quality analysis tools. Nucleic Acids Res. 25(24):4876–4882.
- Thorpe RS, Pook CE, Malhotra A. 2007. Phylogeography of the Russell’s viper (Daboia russelii) complex in relation to variation in the colour pattern and symptoms of envenoming. Herpetol J. 17:209–218.
- Tordoff AW, Bezuijen MR, Duckworth JW, Fellowes JR, Koenig K, Pollard EHB, Royo AG. 2011. Ecosystem profile: Indo-Burma biodiversity hotspot, 2011 Update. Critical Ecosystem Partnership Fund. Washington, DC. p. 381.
- Tyagi K, Kumar V, Kundu S, Pakrashi A, Prasad P, Caleb JTD, Chandra K. 2019. Identification of Indian Spiders through DNA barcoding: cryptic species and species complex. Sci Rep. 9(1):14033.
- Tyagi K, Kumar V, Singha D, Chandra K, Laskar BA, Kundu S, Chakraborty R, Chatterjee S. 2017. DNA barcoding studies on thrips in India: cryptic species and species complexes. Sci Rep. 7(1):4898.
- Wallach V, Williams KL, Boundy J. 2014. Snakes of the world: a catalogue of living and extinct species. Boca Raton (FL): CRC Press.
- Whitaker R, Captain A. 2004. Snakes of India- the field guide. Chennai (India): Draco Books.
- WHO. 2019. Snakebite envenoming: a strategy for prevention and control. Geneva (Switzerland): World Health Organization. Licence: CC BY-NC-SA 3.0 IGO.
- Williams DJ, Faiz MA, Abela-Ridder B, Ainsworth S, Bulfone TC, Nickerson AD, Habib AG, Junghanss T, Fan HW, Turner M, et al. 2019. Strategy for a globally coordinated response to a priority neglected tropical disease: snakebite envenoming. PLoS Negl Trop Dis. 13(2):e0007059.
- Wüster W. 1996. Taxonomic changes and toxinology: systematic revisions of the Asiatic cobras (Naja naja species complex). Toxicon. 34(4):399–406.
- Wüster W. 1998. The Cobras of the genus Naja in India. Hamadryad. 23:15–32.
- Wüster W, Crookes S, Ineich I, Mané Y, Pook CE, Trape J-F, Broadley DG. 2007. The phylogeny of cobras inferred from mitochondrial DNA sequences: evolution of venom spitting and the phylogeography of the African spitting cobras (Serpentes: Elapidae: Naja nigricollis complex). Mol Phylogenet Evol. 45(2):437–453.
- Wüster W, Thorpe RS. 1989. Population affinities of the Asiatic cobra (Naja naja) species complex in south-east Asia: reliability and random resampling. Biol J Linn Soc. 36(4):391–409.
- Wüster W, Thorpe RS, Cox MJ, Jintakune P, Nabhitabhata J. 1995. Population systematics of the snake genus Naja (Reptilia: Serpentes: Elapidae) in Indochina: multivariate morphometrics and comparative mitochondrial DNA sequencing (cytochrome oxidase I). J Evolution Biol. 8(4):493–510.
- Zhang J, Kapli P, Pavlidis P, Stamatakis AA. 2013. A general species delimitation method with applications to phylogenetic placements. Bioinformatics. 29(22):2869–2876.