
 ?Mathematical formulae have been encoded as MathML and are displayed in this HTML version using MathJax in order to improve their display. Uncheck the box to turn MathJax off. This feature requires Javascript. Click on a formula to zoom.
Abstract
Gossypium hirsutum and G. barbadense mitochondrial genomes were analyzed to understand the factors shaping codon usage. While most analyses of codon usage suggest minimal to no bias, nucleotide composition, specifically GC content, was significantly correlated with codon usage. In general, both mitochondrial genomes favor codons that end in A or U, with a secondary preference for pyrimidine rich codons. These observations are similar to previous reports of codon usage in cotton nuclear genomes, possibly suggestive of a general bias spanning genomic compartment. Although evidence for codon usage bias is weak for most genes, we identified six genes (i.e. atp8, atp9, sdh3, sdh4, mttB and rpl2) with significant nonrandom codon usage. In general, we find multiple factors that influence cotton mitochondrial genome codon usage, which may include selection in a subset of genes.
Introduction
Codon usage bias is a common phenomenon in most prokaryotic and eukaryotic species. Biased codon usage can arise as a result of neutral mutations (Osawa et al. Citation1988; Kano et al. Citation1991; Liu et al. Citation2015) or selective constraints (Akashi Citation1994), and may be different among species or genes within species (Uddin et al. Citation2018; Bhattacharyya et al. Citation2019).
Trends in codon usage biases within and among species can provide insight into the different evolutionary pressures that affect genes and species. While there are two main theories at present (i.e. the neutral mutation theory and the selection-mutation-drift theory (Bulmer Citation1991)), studies have shown that biased codon usage is not determined by a single factor, but may be influenced by factors such as synonymous substitution rates (Sharp and Li Citation1987; Shi et al. Citation2006), tRNA abundance (Ikemura Citation1985; Wei et al. Citation2019), accuracy of translation (Marais and Duret Citation2001; Frumkin et al. Citation2018; Yang et al. Citation2019), DNA replication sites (Sharp Citation1991; Sirihongthong et al. Citation2019), gene length (Moriyama and Powell Citation1998; Ingvarsson Citation2007) and expression level (Duret and Mouchiroud Citation1999; Victor et al. Citation2019; Liu et al. Citation2020). In plants, research on codon usage bias has largely focused on nuclear genes, generally finding associations between codon usage and gene function (Chiapello et al. Citation1998; Liu et al. Citation2005), some codon usages among species were broadly conserved (Kawabe and Miyashita Citation2003); however, few studies have characterized codon usage among genes with organelles, such as the mitochondria (Liu et al. Citation2004; Zhang et al. Citation2007; Zhou and Li Citation2009).
Because evolution affects organelles differently, trends in codon usage may be different and/or exaggerated as compared to the nuclear genome (Smith et al. Citation2012). Genetic drift is usually higher and mutational load tends to be particularly high in the mitochondrial (versus nuclear) genome (Xiao et al. Citation2017), where more frequent replication and an oxidative environment (due to the reactions that occur within the organelle) can lead to more frequent mutations (Muftuoglu et al. Citation2014), although this is not broadly observed in angiosperms (Drouin et al. Citation2008). Studies have shown that mitochondrial, chloroplast, and nuclear genes can exhibit differences in codon usage and evolutionary constraints, as observed in Triticum aestivum (Zhang et al. Citation2007), and natural selection might also play a major role in shaping codon usage bias in plant mitochondrial genomes (Zhou and Li Citation2009).
Here we report a detailed comparative analysis of codon usage bias in two Gossypium mitochondrial genomes using multivariate statistical analysis and correlation analysis to better understand codon usage and evolution in the mitochondrion. We explore the key factors in shaping codon choice in the cotton mitochondrial genomes and provide evidence for translationally optimal codons.
Materials and methods
Dataset
The complete mitochondrial genome sequences of Gossypium hirsutum and G. barbadense were stored in the NCBI database under Genbank Accession Numbers JX065074 and KP898249 (Liu et al. Citation2013; Tang et al. Citation2015). 72 CDS sequences, which contained the correct initiation and termination codons from both mitochondrial genomes were used in the analysis. ATG and TGG are unique codons for methionine and tryptophan, which cannot be biased and are excluded.
Measures of synonymous codon usage bias
‘Relative synonymous codon usage’ (RSCU) (Sharp and Li Citation1986; Sharp et al. Citation1986) was calculated for each gene, which is an index to normalize codon usage. RSCU is equivalent to the actual proportional usage of a given codon divided by the expected proportional usage, if all available codons are used equally. If RSCU = 1, codon usage is unbiased. If RSCU > 1, the ith codon is used more frequently than other synonymous codons; if RSCU < 1, the ith codon is used less frequently.
Neutrality plot analysis
We quantified the GC content at GC12 (mean content for GC1 and GC2) and GC3 for all codons of an amino acid sequence (excluding Met, Trp, and stop codons), and an a mean GC content for each entire gene. Neutrality plots generated in R.3.2 (https://www.R-project.org/) (R code for all analyses is provided in Supplementary Table S1).
ENC-plot
The ‘Effective Number of Codons’ (ENC) value can be plotted against the bias in GC to generate an ENC-plot. The expected ENC under the null hypothesis (i.e. no selection) was calculated for each gene from the GC3 values, as in Wright (Citation1990):
The ENC ratio, which excludes the effects of different GC content due to neutral mutation, is then estimated as (ENCexp-ENCobs)/ENCexp (Kawabe and Miyashita Citation2003). The ENC-plots were generated in R.3.2 (https://www.R-project.org/) (R code in Supplementary Table S1).
Correspondence analysis
Correspondence analysis provides a method for graphically displaying of exploring the relationship between variables in one contingency table. The computational details and rationale of correspondence analysis (CA) were adapted from Greenacre (Citation1993, Citation2010). Because codon usage patterns and biases can vary among genes, describing codon usage bias for an entire genomic compartment is a multivariate problem. CodonW version 1.4 has an integrated codon bias and correspondence analysis (COA) program designed to evaluate codon usage bias through multivariate statistical analysis (Neron et al. Citation2009), concomitantly analyzing codon usage across many genes. Here we used CodonW to evaluate the 72 mitochondrial genes (i.e. 36 each in G. hirsutum and G. barbadense) for evidence of codon usage bias using default parameters. (R code is listed in Supplementary Table S1).
Determination of optimal codons
Optimal codons were defined as those codons which occurred more often (relative to their synonyms) in highly expressed genes than in lowly expressed genes (Ikemura Citation1985). The number of genes in each group was 10% of the total number of genes in the dataset. The codon bias of the total codon usage from both sets of genes was estimated using ENC and the set of genes with the lower ENC (more highly biased) was putatively identified as the more highly expressed (Huang et al. Citation2019). Significance was assessed by a two way chi-squared contingency test with the criterion of 0.01.
PR2-bias plot analysis
An extension of the base-pair rule (BPR) is the ‘intrastrand parity rule 2’ (PR2), which assumes that the proportion of A = T and G = C should be equivalent within strand if there are no biases in mutation, selection, or codon usage to distort these ratios (Sueoka Citation1995). We calculated PR2-bias plots to evaluate codon usage bias using only third codon positions in those amino acids with four possible codons (Sueoka Citation1999), i.e. threonine, proline, arginine, leucine, alanine, glycine, valine, and serine. In the present study, ‘A3/(A3 + T3)|4’ and ‘G3/(G3 + C3)|4’ were plotted as the ordinate and abscissa, respectively. A vector from the center represents the extent and direction of the PR2-bias. The PR2-bias plots were plotted in R.3.2 (https://www.R-project.org/) (R code listed in Supplementary Table S1).
Results
Analyses reveal unequal nucleotide composition suggestive of codon usage bias
Codon usage biases can be revealed by several different measures, including by comparing the GC content of third codon positions to the first two. Here, we analyzed GC content for different codon positions in G. hirsutum and G. barbadense mitochondrial genes (Supplementary Table S2). Differences in GC content were greatest at the third codon position, which is typically considered neutral with respect to mutations. We generated GC12 vs GC3 neutrality plots for both G. hirsutum () and G. barbadense () using the mitochondrial genes. Notably, most genes are not distributed along the diagonal, reflecting the wide range of GC3 (24.73%–57.10%) and the comparatively relatively narrow range in GC12 distributions (34.27%–54.38%; Supplementary Table S2) and possibly indicating biased codon usage. The correlation coefficient between GC12 and GC3 was 0.0079 in G. hirsutum and 0.0088 in G. barbadense, respectively, neither of which were significant. Likewise, the slope of the regression curve was –0.0638 in G. hirsutum and –0.0674 in G. barbadense, indicating that the correlation between GC12 and GC3 was very weak in both. These results suggest an uneven distribution in mutation between GC12 and GC3 that may suggest a role for selection in generating codon usage bias for these genes.
Figure 1. Analysis of codon usage between G. hirsutum and G. barbadense mitochondrial genes. Neutrality plot analysis (GC3 vs. GC12) of G. hirsutum (A) and G. barbadense (B). PR2-bias plot of the third codon position for fourfold degenerate amino acids in G. hirsutum (C) and G. barbadense (D). Each dot in the figure indicates one gene. ENC-plot of the G. hirsutum (E) and G. barbadense (F) mitochondrial genes. Dots indicate the position of individual genes, and the standard curve represents the expected ENC under random codon usage. Visualization of the first two axes from the correspondence analysis based on RSCU values for G. hirsutum (G) and G. barbadense (H) mitochondrial genes.
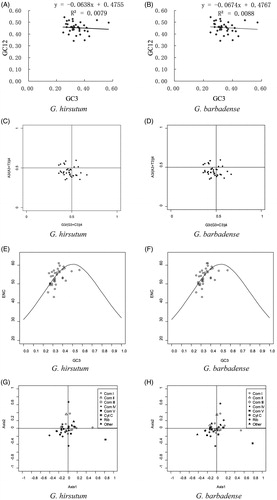
The intrastrand parity rule 2 (PR2) can further dissect nucleotide biases by plotting the association between purines (A and G) and pyrimidines (C and T) in fourfold (third) degenerate codon positions. We evaluated the G. hirsutum and G. barbadense genomes for biases in nucleotide usage (). Most of the mitochondrial genes (20/36 in G. hirsutum and 18/36 in G. barbadense) were distributed in the third quadrant of the plot, indicating that pyrimidines (C and T) were used more frequently than purines (A and G) at the third codon position, further suggesting a bias in nucleotide usage in cotton mitochondrial genes that potentially reflects non-neutral evolution. Given the general A/T bias in the mitochondrial genes and the slight bias toward pyrimidines, there may exist a slight bias toward codons which end in T for cotton mitochondrial genes.
Measures of codon usage bias
The idea of ‘Effective Number of Codons,’ or ENC, is a measure of codon usage bias introduced by Wright (Citation1990) to quantify the actual number of codons used by a given gene. The value of ENC, which ranges from 20 to 61, therefore reflects the strength of codon usage bias (complete bias to no bias). The ENC values of the 72 genes in G. hirsutum and G. barbadense mitochondrial genomes were similar between species, ranging from approximately 43 (atp9) to 61 (atp4 and rps7), the latter of which suggests a complete lack of bias. In general, the cotton genes surveyed exhibited higher ENC values (approaching 61; Supplementary Table S2). Because ENC > 35 is not considered strongly biased (Wright Citation1990; Jiang et al. Citation2008), the ENC analysis does not suggest strong preferential codon usage for any genes in either cotton species; however, several genes (i.e. atp9, nad4L, sdh3, cox2, atp6, ccmC) exhibit ENC < 50, which may be weakly biased.
Because ENC can be influenced by amino acid composition, Wright (Citation1990) outlined a method to calculate the expected ENC values (under purely neutral mutation) which is plotted against GC3 to form a standard curve. Genes whose ENC-GC3 values are distributed along or adjacent to the standard curve may be considered neutrally evolving, whereas those that fall far below the standard curve may be subject to selection (Kawabe and Miyashita Citation2003). shows compares the observed values of ENC-GC3 (dots) for cotton mitochondrial genes relative to the expected relationship between ENC and GC3 under H0 (no selection; solid line). As expected from the above analyses, both G. hirsutum () and G. barbadense () exhibit nearly identical distributions, many of which were on or near to the standard curve (indicating neutral evolution). Some genes (atp8, atp9, sdh3, sdh4, mttB and rpl2) exhibited ENC values lower than expected, which may be suggestive of other processes influencing nucleotide composition/codon usage, including selection (Kawabe and Miyashita Citation2003). These results are reiterated in the frequency plots for both species using the ENC ratio ((ENCexp–ENCobs)/ENCexp; Supplementary Figure S1), whereby most genes fall in the ENC ratio bin of 0.0–0.05 (nearly neutral), although the ENC ratio ranges from –0.15 to 0.2, suggesting some genes have an ENC far outside of what is expected, potentially due to non-neutral processes.
A second measure of codon usage bias, i.e. ‘relative synonymous codon usage’ (RSCU), was also used to evaluate codon usage in a normalized fashion. RSCU is an index that is normalized with respect to amino acid composition, thereby permitting a more even comparison among genes or species. The total codon numbers and average RSCU values were listed in . Seven codons including UUU (Phe), AUU (Ile), UAU (Tyr), GAU(Asp), GAA(Glu), GCU (Ala) and GGU(Gly) were determined as the ‘optimal codons’ (p < .01). Among them, the codon GGU(Gly), its usage was significantly more often in highly than in lowly biased genes. Although not considered as the optimal codons, other six codons including UUA (Leu), CAU (His), AAU (Asn), AAA(Lys), CCA (Pro) and CGU (Arg) were used more frequently in the highly expressed dataset at 0.01 < p < .05. We found that all of these 13 codons were A/U ended. Congruent with the composition analyses, most of the preferred codons have A- or U- in the third codon position. Although, all the preferred codons ended with A/U, codons with U in the third position were detected more frequently, indicating a general preference for these codons in both cotton mitochondrial genomes.
Table 1. Codon usage of high/low expressed gene groups in G. hirsutum and G. barbadense mitochondrial genomes.
We further evaluated the RSCU patterns using correspondence analysis (). The first two axes explain relatively small amounts of the overall variance in codon usage, i.e. 10.16% (G. hirsutum) and 10.39% (G. barbadense) for Axis 1, and 3.14% (G. hirsutum) and 1.97% (G. barbadense) for Axis 2, which indicates no strong trends in the data. These results indicate that the interplay between several factors (e.g. neutral mutation, selection, etc) is likely responsible for shaping codon usage in Gossypium mitochondrial genome genes. When we further divide the analysis based on the mitochondrial complexes (), most genes are centrally clustered, others (e.g. ATP synthase from Complex V) are somewhat more dispersed, potentially indicating differences in codon usage within that complex.
Discussion
The evolutionary significance and mechanisms that underlie biased codon usage have been debated for decades. Although the redundancy in the genetic code suggests complete interchangeability among synonymous codons, biases in codon usage are frequent (Ikemura Citation1985; Hershberg and Petrov Citation2008), although not ubiquitous (Duret Citation2002), and may be consistent (Chen et al. Citation2004) or variable (Ikemura Citation1985; Sharp et al. Citation1988) among genes within a genome. A number of processes can influence codon usage, including neutral mutations, genetic drift, variability in GC content, and selection, among others (Liu et al. Citation2015; Song et al. Citation2017; Xiao et al. Citation2017). Weak patterns of codon usage bias have been reported for cotton nuclear genes (Wang et al. Citation2018), exhibiting slight preferences for codons that end in A or T and/or pyrimidine rich codons associated with nucleotide composition. Because the mitochondria genome is subject to a related yet unique evolutionary history influenced by different evolutionary factors (Chen et al. Citation2017), we evaluated the mitochondrial genomes of G. hirsutum and G. barbadense for evidence of codon usage biases.
Similar to cotton nuclear genes (Wang et al. Citation2018), codon usage bias in the mitochondrial genome was weak. In general, the codon usage biases suggested here were similarly associated with nucleotide composition. Like cotton nuclear genes, cotton mitochondrial genes tend to be GC-poor in the third codon position, which leads to a slight bias toward codons that end in either A or T. RSCU analyses generally agreed with these results, revealing that the more frequently used codons typically ended with either A or T in the third codon position. Notably, two of the highly preferred codons we detected here (GCU and GGU) were also among the seven and twelve preferred codons detected in the G. hirsutum chloroplast (Shang et al. Citation2011) and nuclear (Wang et al. Citation2018) genomes, suggesting a general preference for these codons in cotton.
In addition, the results of the codon usage patterns between Gossypium hirsutum and G. barbadense mitochondrial genomes are basically the same. These findings suggested that the codon usage patterns of Gossypium mitochondrial genomes were highly conserved, which indicated that the dominant selection pressure for codon usage appears to be purifying selection and suggested that similar genome-changing mechanisms operated in the long-term evolution of cotton (Guan et al. Citation2019).
Our results suggested that biased usage toward preferred codons promote the efficiency of transcription and translation, which is an indicator of combined efforts of evolutionary forces (Chaney and Clark Citation2015; Shah et al. Citation2015). Based on this view, the codon usage bias observed in cotton could have lower biological functional significance than expected, only to show that they have experienced strong purifying selection (Hershberg and Petrov Citation2008; Jia and Higgs Citation2008; James et al. Citation2016). Thus, to test if the extent of codon usage reflects various biological processes, further studies on transcriptional and translational mechanisms in cotton are required. The expression data of mitochondrial genes between codon usage and expression level in cotton are also required to establish the connection.
tmdn_a_1780969_sm9531.zip
Download Zip (32.7 KB)Disclosure statement
No potential conflict of interest was reported by the author(s).
Data availability statement
The data that support the findings of this study are openly available in the NCBI database under Genbank Accession Numbers JX065074 (https://www.ncbi.nlm.nih.gov/nuccore/JX065074.1/) and KP898249 (https://www.ncbi.nlm.nih.gov/nuccore/KP898249).
References
- Akashi H. 1994. Synonymous codon usage in drosophila melanogaster: natural selection and translational accuracy. Genetics. 136:927–935.
- Bhattacharyya D, Uddin A, Das S, Chakraborty S. 2019. Mutation pressure and natural selection on codon usage in chloroplast genes of two species in pisum l. (Fabaceae: Faboideae). Mitochondrial DNA A DNA Mapp Seq Anal. 30(4):664–673.
- Bulmer M. 1991. The selection-mutation-drift theory of synonymous codon usage. Genetics. 129(3):897–907.
- Chaney JL, Clark PL. 2015. Roles for synonymous codon usage in protein biogenesis. Annu Rev Biophys. 44:143–166.
- Chen SL, Lee W, Hottes AK, Shapiro L, Mcadams HH. 2004. Codon usage between genomes is constrained by genome-wide mutational processes. Proc Natl Acad Sci USA. 101(10):3480–3485.
- Chen ZW, Nie HS, Wang YM, Pei HL, Li SS, Zhang LD, Hua JP. 2017. Rapid evolutionary divergence of diploid and allotetraploid Gossypium mitochondrial genomes. BMC Genomics. 18:876.
- Chiapello H, Lisacek F, Caboche M, Henaut A. 1998. Codon usage and gene function are related in sequences of Arabidopsis thaliana. Gene. 209(1–-2):GC1–GC38.
- Drouin G, Daoud H, Xia J. 2008. Relative rates of synonymous substitutions in the mitochondrial, chloroplast and nuclear genomes of seed plants. Mol Phylogenet Evol. 49(3):827–831.
- Duret L. 2002. Evolution of synonymous codon usage in metazoans. Curr Opin Genet Dev. 12(6):640–649.
- Duret L, Mouchiroud D. 1999. Expression pattern and, surprisingly, gene length shape codon usage in Caenorhabditis, Drosophila, and Arabidopsis. Proc Natl Acad Sci USA. 96(8):4482–4487.
- Frumkin I, Lajoie MJ, Gregg CJ, Hornung G, Church GM, Pilpel Y. 2018. Codon usage of highly expressed genes affects proteome-wide translation efficiency. Proc Natl Acad Sci USA. 115(21):E4940–E4949.
- Greenacre MJ. 1993. Correspondence analysis in practice. London: Academic Press.
- Greenacre M. 2010. Correspondence analysis of raw data. Ecology. 91(4):958–963.
- Guan DL, Qian ZQ, Ma LB, Bai Y, Xu SQ. 2019. Different mitogenomic codon usage patterns between damselflies and dragonflies and nine complete mitogenomes for odonates. Sci Rep. 9:678.
- Hershberg R, Petrov DA. 2008. Selection on codon bias. Annu Rev Genet. 42:287–299.
- Huang M, Zhong Y, Ma X, Hu Q, Fu M, Han Y. 2019. Analysis of codon usage in the mitochondrion genome of Spirodela polyrhiza. Aquat Bot. 156:65–72.
- Ikemura T. 1985. Codon usage and tRNA content in unicellular and multicellular organisms. Mol Biol Evol. 2(1):13–34.
- Ingvarsson PK. 2007. Gene expression and protein length influence codon usage and rates of sequence evolution in Populus tremula. Mol Biol Evol. 24(3):836–844.
- James JE, Piganeau G, Eyre-Walker A. 2016. The rate of adaptive evolution in animal mitochondria. Mol Ecol. 25(1):67–78.
- Jia W, Higgs PG. 2008. Codon usage in mitochondrial genomes: distinguishing context-dependent mutation from translational selection. Mol Biol Evol. 25(2):339–351.
- Jiang Y, Deng F, Wang H, Hu Z. 2008. An extensive analysis on the global codon usage pattern of baculoviruses. Arch Virol. 153(12):2273–2282.
- Kano A, Andachi Y, Ohama T, Osawa S. 1991. Novel anticodon composition of transfer RNAs in micrococcus luteus, a bacterium with a high genomic G + C content. Correlation with codon usage. J Mol Biol. 221(2):387–401.
- Kawabe A, Miyashita NT. 2003. Patterns of codon usage bias in three dicot and four monocot plant species. Genes Genet Syst. 78(5):343–352.
- Liu G, Cao D, Li S, Su A, Geng J, Grover CE, Hu S, Hua J. 2013. The complete mitochondrial genome of Gossypium hirsutum and evolutionary analysis of higher plant mitochondrial genomes. PLoS One. 8(8):e69476.
- Liu Q, Dou S, Ji Z, Xue Q. 2005. Synonymous codon usage and gene function are strongly related in Oryza sativa. BioSystems. 80(2):123–131.
- Liu Q, Feng Y, Xue Q. 2004. Analysis of factors shaping codon usage in the mitochondrion genome of Oryza sativa. Mitochondrion. Mitochondrion. 4(4):313–320.
- Liu Q, Hu H, Wang H. 2015. Mutational bias is the driving force for shaping the synonymous codon usage pattern of alternatively spliced genes in rice (Oryza sativa L.). Mol Genet Genomics. 290(2):649–660.
- Liu XY, Li Y, Ji KK, Zhu J, Ling P, Zhou T, Fan LY, Xie SQ. 2020. Genome-wide codon usage pattern analysis reveals the correlation between codon usage bias and gene expression in Cuscuta australis. Genomics. 112(4):2695–2702.
- Marais G, Duret L. 2001. Synonymous codon usage, accuracy of translation, and gene length in Caenorhabditis elegans. J Mol Evol. 52(3):275–280.
- Moriyama EN, Powell JR. 1998. Gene length and codon usage bias in Drosophila melanogaster, Saccharomyces cerevisiae and Escherichia coli. Nucleic Acids Res. 26(13):3188–3193.
- Muftuoglu M, Mori MP, Souza-Pinto N. 2014. Formation and repair of oxidative damage in the mitochondrial DNA. Mitochondrion. 17:164–181.
- Neron B, Menager H, Maufrais C, Joly N, Maupetit J, Letort S, Carrere S, Tuffery P, Letondal C. 2009. Mobyle: a new full web bioinformatics framework. Bioinformatics. 25(22):3005–3011.
- Osawa S, Ohama T, Yamao F, Muto A, Jukes TH, Ozeki H, Umesono K. 1988. Directional mutation pressure and transfer RNA in choice of the third nucleotide of synonymous two-codon sets. Proc Natl Acad Sci USA. 85(4):1124–1128.
- Shah K, Cheng Y, Hahn B, Bridges R, Bradbury NA, Mueller DM. 2015. Synonymous codon usage affects the expression of wild type and F508del CFTR. J Mol Biol. 427(6 Pt B):1464–1479.
- Shang MZ, Liu F, Hua JP, Wang KB. 2011. Analysis on codon usage of chloroplast genome of Gossypium hirsutum. Scientia Agricultura Sinica. 044:245–253.
- Sharp PM. 1991. Determinants of DNA sequence divergence between Escherichia coli and Salmonella typhimurium: codon usage, map position, and concerted evolution. J Mol Evol. 33(1):23–33.
- Sharp PM, Cowe E, Higgins DG, Shields DC, Wolfe KH, Wright F. 1988. Codon usage patterns in Escherichia coli, Bacillus subtilis, Saccharomyces cerevisiae, Schizosaccharomyces pombe, Drosophila melanogaster and Homo sapiens; a review of the considerable within-species diversity. Nucleic Acids Res. 16(17):8207–8211.
- Sharp PM, Li WH. 1986. An evolutionary perspective on synonymous codon usage in unicellular organisms. J Mol Evol. 24(1–2):28–38.
- Sharp PM, Li WH. 1987. The rate of synonymous substitution in enterobacterial genes is inversely related to codon usage bias. Mol Biol Evol. 4:222–230.
- Sharp PM, Tuohy TM, Mosurski KR. 1986. Codon usage in yeast: cluster analysis clearly differentiates highly and lowly expressed genes. Nucleic Acids Res. 14(13):5125–5143.
- Shi X, Wang X, Li Z, Zhu Q, Tang W, Ge S, Luo J. 2006. Nucleotide substitution pattern in rice paralogues: implication for negative correlation between the synonymous substitution rate and codon usage bias. Gene. 376(2):199–206.
- Sirihongthong T, Jitobaom K, Phakaratsakul S, Boonarkart C, Suptawiwat O, Auewarakul P. 2019. The relationship of codon usage to the replication strategy of parvoviruses. Arch Virol. 164(10):2479–2491.
- Smith DR, Hua JM, Lee RW, Keeling PJ. 2012. Relative rates of evolution among the three genetic compartments of the red alga porphyra differ from those of green plants and do not correlate with genome architecture. Mol Phylogenet Evol. 65(1):339–344.
- Song H, Gao H, Liu J, Tian P, Nan Z. 2017. Comprehensive analysis of correlations among codon usage bias, gene expression, and substitution rate in Arachis duranensis and Arachis ipaënsis orthologs. Sci Rep. 7(1):14853.
- Sueoka N. 1995. Intrastrand parity rules of DNA base composition and usage biases of synonymous codons. J Mol Evol. 40(3):318–325.
- Sueoka N. 1999. Translation-coupled violation of parity rule 2 in human genes is not the cause of heterogeneity of the DNA G + C content of third codon position. Gene. 238(1):53–58.
- Tang M, Chen Z, Grover CE, Wang Y, Li S, Liu G, Ma Z, Wendel JF, Hua J. 2015. Rapid evolutionary divergence of Gossypium barbadense and G. hirsutum mitochondrial genomes. BMC Genomics. 16:770.
- Uddin A, Choudhury MN, Chakraborty S. 2018. Codon usage bias and phylogenetic analysis of mitochondrial Nd1 gene in pisces, aves, and mammals. Mitochondrial DNA A DNA Mapp Seq Anal. 29(1):36–48.
- Victor MP, Acharya D, Begum T, Ghosh TC. 2019. The optimization of mRNA expression level by its intrinsic properties-insights from codon usage pattern and structural stability of mRNA. Genomics. 111(6):1292–1297.
- Wang L, Xing H, Yuan Y, Wang X, Saeed M, Tao J, Feng W, Zhang G, Song X, Sun X. 2018. Genome-wide analysis of codon usage bias in four sequenced cotton species. PLoS One. 13(3):e0194372
- Wei Y, Silke JR, Xia X. 2019. An improved estimation of tRNA expression to better elucidate the coevolution between tRNA abundance and codon usage in bacteria. Sci Rep. 9(1):3184.
- Wright F. 1990. The ‘effective number of codons’ used in a gene. Gene. 87(1):23–29.
- Xiao S, Nguyen DT, Wu B, Hao W. 2017. Genetic drift and indel mutation in the evolution of yeast mitochondrial genome size. Genome Biol Evol. 9(11):3088–3099.
- Yang Q, Yu CH, Zhao F, Dang Y, Wu C, Xie P, Sachs MS, Liu Y. 2019. Erf1 mediates codon usage effects on mRNA translation efficiency through premature termination at rare codons. Nucleic Acids Res. 47(17):9243–9258.
- Zhang WJ, Zhou J, Li ZF, Wang L, Gu X, Zhong Y. 2007. Comparative analysis of codon usage patterns among mitochondrion, chloroplast and nuclear genes in Triticum aestivum L. J Integrative Plant Biology. 49(2):246–254.
- Zhou M, Li X. 2009. Analysis of synonymous codon usage patterns in different plant mitochondrial genomes. Mol Biol Rep. 36(8):2039–2046.