
Abstract
The fish diversity of Chuuk Micronesia is currently under threat due to rapid changes in the coral reef ecosystem. Thus, accurate fish identification using DNA barcodes is fundamental for exploring species biodiversity and resource protection. In this study, we analyzed 162 fish mitochondrial DNA cytochrome c oxidase I (COI) barcodes from Chuuk Micronesia. Consequently, we identified 95 species from 53 genera in 26 families and seven orders. The average Kimura 2-parameter genetic distances within species, genera, families, and orders were calculated as 0.17%, 11.78%, 15.63%, and 21.90%, respectively. Also, we have utilized DNA barcodes to perform genetic divergence and phylogenetic analysis of families recognized as dominant groups in Chuuk State. Our findings confirm that DNA barcodes using COI are an effective approach in identifying coral reef fish species. We anticipate that the results of this study will provide baseline data for the protection of coral reef fish biodiversity at Chuuk Micronesia.
Introduction
Micronesia, which is located in the Western Pacific Ocean, consists of four states (Yap, Chuuk, Pohnpei, and Kosrae) that collectively have a coral reef area exceeding 6000 km2 (Andréfouët et al. Citation2006). As growth and spawning grounds for a wide range of marine organisms, coral reefs are often characterized by their high biodiversity (Reaka-Kudla Citation1997). The reefs of Micronesia have served as a habitat for many species of corals, fishes, and invertebrates. Chuuk State consists of 18 major volcanic islands, many smaller and uninhabited islands, and a diversity of tropical marine reefs, ranging in size from 0.4 to 4.6 km2. Recently, population expansion, economic growth, and indiscriminate fishing have threatened the biodiversity of the region (Edward Citation2002). Further, global climate change is causing ocean acidification, rising sea levels, and rising water temperatures, changes that have been considered detrimental to the coral reef ecosystems and thus creating a crisis of marine biodiversity (Hoegh-Guldberg et al. Citation2007; Baker et al. Citation2008; Thompson and Van Woesik Citation2009).
Effective conservation and management of fish biodiversity require reliable baseline estimates of fish species diversity based on accurate species identification. Identification of fish species is traditionally based on morphology (Dayrat Citation2005; Triantafyllidis et al. Citation2011). However, morphological identification requires considerable expertise, given that the morphology of fish varies and often changes concomitantly with developmental stage (Leis and Carson-Ewart Citation2000; Wang et al. Citation2018). These issues can be addressed by DNA barcoding, which is based on pattern analysis of standardized gene regions. This approach has been identified to be more reliable for species identification (Hebert et al. Citation2003; Hebert and Gregory Citation2005). A 655-bp fragment of the mitochondrial COI gene is widely used for species-level identifications. Mitochondrial DNA shows a high mutation rate and large copy numbers. Organisms with small effective population sizes often provide genomes that are useful for analyses of evolutionary patterns and processes (Brown et al. Citation1979; Birky et al. Citation1989). Numerous previous studies around the world, including studies in Taiwan (Bingpeng et al. Citation2018), Pacific Canada (Steinke et al. Citation2009), Australia (Ward et al. Citation2005), the Philippines (Abdulmalik-Labe and Quilang Citation2019), China (Wang et al. Citation2018), India (Lakra et al. Citation2011), Turkey (Keskin and Atar Citation2013), and Japan (Zhang and Hanner Citation2011), have demonstrated the utility of COI barcodes in fish species identification.
We used mitochondrial DNA COI barcodes to identify some coral reef fish species from Chuuk State, Micronesia. These species can be difficult to identify by morphological identification.
Materials and methods
Sample collection
The research area is along the northeastern coast of Weno Island in Chuuk State (7°27′N, 151°51′E), where coral reefs are well developed. Fishes were collected by diving and netting or were purchased from a local market in 2006, 2007, 2008, and 2011.
DNA isolation
Genomic DNA was extracted from tissue pieces using a Qiagen DNeasy Blood & Tissue Kits (QIAGEN, Valencia, CA, USA), following the manufacturer’s protocol. All gDNAs extracted from whole samples were stored at −20 °C at the Marine Ecosystem Research Center, Korea Institute of Ocean Science and Technology, Busan, Korea. The quality and quantity of extracted DNA were measured using a NanoDrop® ND-1000 spectrophotometer (NanoDrop Technologies, Wilmington, USA).
Amplification and sequencing
PCR amplification was performed using combinations of primers for fish 655-bp COI barcoding region (Ward et al. Citation2005). Thermal amplification reactions were performed in 25 μL reaction mixtures, which contained 1× PCR buffer, 2 mM MgCl2, 10 pmol of each primer, 0.25 mM of each dNTP, 0.25 U of Taq polymerase, and 100 ng of DNA template. The thermocycling program consisted of an initial step of 94 °C for 1 min; followed by 35 cycles of 94 °C for 30 s, 50 °C for 40 s, and 72 °C for 1 min; a final extension at 72 °C for 10 min; and a final hold at 4 °C. PCR products were then checked using 2% agarose gel electrophoresis. PCR products were purified using a QIAquick PCR Purification Kit (QIAGEN, Valencia, CA, USA), following the manufacturer’s protocol. Sequencing reactions were performed in an MJ Research PTC-225 Peltier Thermal Cycler using ABI PRISM BigDye™ Terminator Cycle Sequencing Kits with AmpliTaq DNA polymerase (FS enzyme) (Applied Biosystems), following the protocols provided by the manufacturer.
Sequence analysis
All sequences were aligned and integrated using MEGA X (Kumar et al. Citation2018). Obtained sequences were then compared with sequences from NCBI GenBank databases. Samples with similarity indices greater than 97% compared with available database sequences were considered to be the same species. Nucleotide composition, transition(si)/transversion(sv) pair ratios, and K2P genetic distances, including intra- and interspecific divergences, were calculated using MEGA X. Neighbor-joining (NJ) phylogenetic tree (Saitou and Nei Citation1987) was constructed based on K2P genetic distance using MEGA X with bootstrap tests of 1000 replications were generated to verify the robustness of the tree. The K2P can be rapidly calculated, which in turn can provide consistent results for many species that show required differences between intra- and interspecies variability (Kimura Citation1980; Shen et al. Citation2016). The K2P model is commonly used in DNA barcoding (Zhang and Hanner Citation2011; Keskin and Atar Citation2013; Bingpeng et al. Citation2018; Wang et al. Citation2018).
Results and discussions
Analysis of 162 COI DNA barcodes was able to identify 95 species, 53 genera, 26 families, and seven orders (Anguilliformes, Beloniformes, Beryciformes, Mugiliformes, Ophidiiformes, Perciformes, and Tetraodontiformes) among fishes from Chuuk State. We then obtained the NCBI accession numbers for all the specimens (). The COI barcode used in the analyses comprised 655 nucleotide base pairs per taxon, and no contamination, insertions, deletions, or stop codons were determined in any obtained sequence. Average K2P genetic distances within species, genera, families, and orders were determined to be 0.17%, 11.78%, 15.63%, and 21.90%, respectively. The average interspecific genetic distance increased concomitant with an increase in genetic variation at progressively higher taxonomic levels. DNA barcoding efficiency is then verified by intraspecific and interspecific distances (Lievens et al. Citation2001). Average intraspecific genetic distance is 0.3% in BOLD (Barcode of Life Data System) fish databases, and congeneric distance is at least 30-fold higher than conspecific distances (Zhang and Hanner Citation2011). Intraspecific distance and congeneric distance were determined to be 69-fold higher than conspecific distance in the current study. Our study confirmed that DNA barcodes are useful in identifying coral reef fish species. Moreover, we found that intraspecific genetic distances determined in this present study are less than the previously reported distances; in contrast, interspecific genetic distance was found to be greater.
Table 1. List of species analyzed for DNA barcodes and sequence information.
Average nucleotide composition of the 162 DNA barcodes was T = 29.08%, C = 28.39%, A = 24.18%, and G = 18.35%. The average GC and AT contents were 46.74% and 53.26%, respectively. The highest (52.76%) and lowest (38.51%) GC values were detected in COI barcodes of Fibramia thermalis and Zenarchopterus dispar. Further, the average ratio (si/sv) of all specimens has been determined to be 1.38. Divergence time among specimens was analyzed in terms of transition(si)/transversion(sv) ratio and genetic distance. The former is considered a general property of DNA sequence evolution. This ratio provides a reliable estimate of sequence distance and can be further used in phylogeny reconstruction. A high si/sv ratio is indicative of a small genetic distance, and vice versa (Yang and Yoder Citation1999). We were able to analyze the divergence times among families, for example, Acanthuridae, Labridae, Scaridae, and Serranidae, which are dominant in Chuuk Micronesia using DNA barcodes of the fish collected in this study. Average si/sv ratios for these families were 2.10, 1.56, 3.5, and 1.8, respectively. Further, the mean genetic distances among species within families were 16.08%, 20.25%, 11.15%, and 18.80%, respectively. Scaridae family displays the highest si/sv ratio (3.5) and the lowest genetic distance among species within families (11.15%). Scaridae appears to be a recently diverged group and is youngest among dominant families in Chuuk State, Micronesia. Moreover, compared with other families with similar divergence times, we collected a larger number of species in the Scaridae. It is predicted that Scaridae is well adapted to the rich coral reef found at Chuuk State. In contrast, the Labridae family has showed the highest genetic distance (20.25%) and lowest si/sv ratio (1.74) among major groups. This result may reflect an early divergence of species in the Labridae.
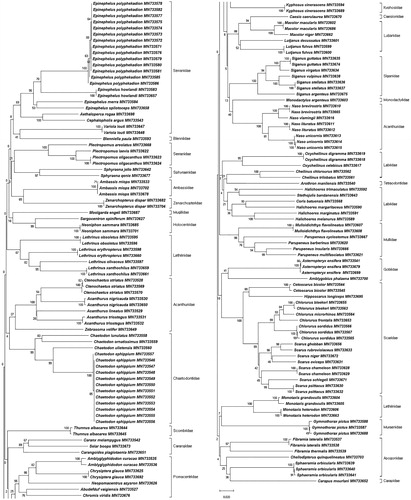
The NJ tree from 162 specimens was constructed based on K2P distances (). We used this tree to confirm that all species were clustered monophyletic. Thus, DNA barcode analysis is effective in identifying species known to be similar based on morphological observation. Confamilial species are then classified and grouped as independent clades in general phylogenetic analysis. However, some families in this study (Acanthuridae, Serranidae, and Labridae) were not grouped together. Mitochondrial DNA evolves faster than nuclear DNA and is characterized by larger numbers of variable and informative sites. Rapid substitution rates of mitochondrial DNA also make it useful for analyses at species and genus levels. However, deeper branching may then reduce saturation, which can result in homoplasy, as the phylogenetic signal has been reduced (Caterino et al. Citation2001; Rubinoff and Sperling Citation2002; Rubinoff and Holland Citation2005). A previous study (Ward et al. Citation2005) suggests that phylogenetic analysis using single mitochondrial DNA is suitable for simpler studies, not for deep phylogenetic analysis. Therefore, we confirmed that mitochondrial DNA COI barcodes are effective for identification of coral reef fish species and analysis of phylogenetic relationships at the species and genus level.
Figure 1. Neighbor-joining (NJ) tree of 162 COI barcodes using K2P distances.
This study, to the best of our knowledge, is the first in which mitochondrial DNA COI barcodes have been used in analyzing coral reef fishes in Chuuk, Micronesia. We identified 95 species, 53 genera, 26 families, and seven orders based on DNA barcoding of 162 fish specimens. Furthermore, we have analyzed divergence time and phylogenetic relationships of fish families that are dominant groups in Chuuk State. Our results confirm that the mitochondrial COI DNA barcodes are an effective tool for the identification of coral reef fish. We predict that similar analyses using larger sample sizes would yield more accurate results given the high marine biodiversity of the study area. We thus anticipate that DNA barcode information obtained in this study will provide baseline data for the protection of coral reef fish biodiversity in Chuuk State, Micronesia.
Disclosure statement
No potential conflict of interest was reported by the author(s).
Data availability statement
The data that support the findings of this study are openly available in NCBI at https://www.ncbi.nlm.nih.gov/, all reference numbers in .
Additional information
Funding
References
- Abdulmalik-Labe OP, Quilang JP. 2019. DNA barcoding of fishes from Lake Lanao, Philippines. Mitochondrial DNA B. 4(1):1890–1894.
- Andréfouët S, Muller-Karger FE, Robinson JA, Kranenburg CJ, Torres-Pulliza D, Spraggins SA, Murch B. 2006. Global assessment of modern coral reef extent and diversity for regional science and management applications: a view from space. In Proceedings of the 10th International Coral Reef Symposium, Japanese Coral Reef Society Okinawa, Japan, Vol. 2, p. 1732–1745.
- Baker AC, Glynn PW, Riegl B. 2008. Climate change and coral reef bleaching: an ecological assessment of long-term impacts, recovery trends and future outlook. Estuarine Coastal Shelf Sci. 80(4):435–471.
- Bingpeng X, Heshan L, Zhilan Z, Chunguang W, Yanguo W, Jianjun W. 2018. DNA barcoding for identification of fish species in the Taiwan Strait. PLoS One. 13(6):e0198109.
- Birky CW, Fuerst P, Maruyama T. 1989. Organelle gene diversity under migration, mutation, and drift: equilibrium expectations, approach to equilibrium, effects of heteroplasmic cells, and comparison to nuclear genes. Genetics. 121(3):613–627.
- Brown WM, George M, Wilson AC. 1979. Rapid evolution of animal mitochondrial DNA. Proc Natl Acad Sci USA. 76(4):1967–1971.
- Caterino MS, Reed RD, Kuo MM, Sperling FA. 2001. A partitioned likelihood analysis of swallowtail butterfly phylogeny (Lepidoptera: Papilionidae). Syst Biol. 50(1):106–127.
- Dayrat B. 2005. Towards integrative taxonomy. Biol J Linn Soc. 85(3):407–417.
- Edward A. 2002. Marine biodiversity of the Federated States of Micronesia. Report of the Global Environmental Facility, FSM National Biodiversity Strategy and Action Plan Project. Department of Economic Affairs. Federated States of Micronesia, Palikir, 1–20.
- Hebert PD, Gregory TR. 2005. The promise of DNA barcoding for taxonomy. Syst Biol. 54(5):852–859.
- Hebert PDN, Cywinska A, Ball SL, DeWaard JR. 2003. Biological identifications through DNA barcodes. Proc R Soc Lond B. 270(1512):313–321.
- Hoegh-Guldberg O, Mumby PJ, Hooten AJ, Steneck RS, Greenfield P, Gomez E, Harvell CD, Sale PF, Edwards AJ, Caldeira K, et al. 2007. Coral reefs under rapid climate change and ocean acidification. Science. 318(5857):1737–1742.
- Keskİn E, Atar HH. 2013. DNA barcoding commercially important fish species of Turkey. Mol Ecol Resour. 13(5):788–797.
- Kimura M. 1980. A simple method for estimating evolutionary rates of base substitutions through comparative studies of nucleotide sequences. J Mol Evol. 16(2):111–120.
- Kumar S, Stecher G, Li M, Knyaz C, Tamura K. 2018. MEGA X: molecular evolutionary genetics analysis across computing platforms. Mol Biol Evol. 35(6):1547–1549.
- Lakra WS, Verma MS, Goswami M, Lal KK, Mohindra V, Punia P, Gopalakrishnan A, Singh KV, Ward RD, Hebert P. 2011. DNA barcoding Indian marine fishes. Mol Ecol Resour. 11(1):60–71.
- Leis JM, Carson-Ewart BM, editors. 2000. The larvae of Indo-Pacific coastal fishes: an identification guide to marine fish larvae. Leiden; Boston: Brill.
- Lievens S, Goormachtig S, Holsters M. 2001. A critical evaluation of differential display as a tool to identify genes involved in legume nodulation: looking back and looking forward. Nucleic Acids Res. 29(17):3459–3468.
- Reaka-Kudla ML. 1997. The global biodiversity of coral reefs: a comparison with rain forests. In: Reaka-Kudla ML, Wilson DE, Wilson EO, editors. Biodiversity II: understanding and protecting our biological resources. Vol. 2. Washington (DC): Joseph Henry Press; p. 551.
- Rubinoff D, Holland BS. 2005. Between two extremes: mitochondrial DNA is neither the panacea nor the nemesis of phylogenetic and taxonomic inference. Syst Biol. 54(6):952–961.
- Rubinoff D, Sperling FA. 2002. Evolution of ecological traits and wing morphology in Hemileuca (Saturniidae) based on a two-gene phylogeny. Mol Phylogenet Evol. 25(1):70–86.
- Saitou N, Nei M. 1987. The neighbor-joining method: a new method for reconstructing phylogenetic trees. Mol Biol Evol. 4(4):406–425.
- Shen Y, Guan L, Wang D, Gan X. 2016. DNA barcoding and evaluation of genetic diversity in Cyprinidae fish in the midstream of the Yangtze River. Ecol Evol. 6(9):2702–2713.
- Steinke D, Zemlak TS, Boutillier JA, Hebert PD. 2009. DNA barcoding of Pacific Canada’s fishes. Mar Biol. 156(12):2641–2647.
- Thompson DM, Van Woesik R. 2009. Corals escape bleaching in regions that recently and historically experienced frequent thermal stress. Proc Biol Sci. 276(1669):2893–2901.
- Triantafyllidis A, Bobori D, Koliamitra C, Gbandi E, Mpanti M, Petriki O, Karaiskou N. 2011. DNA barcoding analysis of fish species diversity in four north Greek lakes. Mitochondrial DNA. 22(Suppl 1):37–42.
- Wang L, Wu Z, Liu M, Liu W, Zhao W, Liu H, You F. 2018. DNA barcoding of marine fish species from Rongcheng Bay, China. PeerJ. 6:e5013.
- Ward RD, Zemlak TS, Innes BH, Last PR, Hebert PD. 2005. DNA barcoding Australia's fish species. Philos Trans R Soc Lond B Biol Sci. 360(1462):1847–1857.
- Yang Z, Yoder AD. 1999. Estimation of the transition/transversion rate bias and species sampling. J Mol Evol. 48(3):274–283.
- Zhang JB, Hanner R. 2011. DNA barcoding is a useful tool for the identification of marine fishes from Japan. Biochem Syst Ecol. 39(1):31–42.