
Abstract
The spiny frog Quasipaa robertingeri is endemic to a narrow region of southwest China and its taxonomic validation is still controversial. Based on COI gene sequences of 110 individuals from seven populations of Q. robertingeri and its related species, we investigated the phylogenetic position and population genetic structure of the species. Phylogenetic analyses indicated that Q. robertingeri was deeply genetically separated from its closely related species Q. boulengeri, indicating the validation of the species. All samples of Q. robertingeri were clustered into two divergent lineages. Haplotype network, AMOVA, and genetic distance estimations also supported the separations of the two groups. Neutrality tests indicated that one lineage has been likely independently experienced a recent population expansion, leading to a secondary contact area between the two lineages.
Introduction
The spiny frog Quasipaa robertingeri belongs to the family Dicroglossidae (Amphibia, Anura; Frost Citation2020), and is commonly found in the mountain streams at elevations ca. 400–2000 m in a narrow region, bordering Sichuan and Guizhou provinces and Chongqing City in southwest China (Fei et al. Citation2009, Citation2012). The validation of the species is still on debates. Some molecular phylogenetic studies suggested that it should be synonym with Q. boulengeri, which is broadly sympatric with Q. robertingeri (Che et al. Citation2009; Zhang et al. Citation2018). But Fei et al. (Citation2009, Citation2012) still recognized Q. robertingeri as a valid species based on morphology. Whatever, there has been no work with comprehensive sampling on the population level of the species and its related species to resolve the systematic problems.
In recent years, a variety of human-caused threats especially excessive captures and habitat destructions lead to the dramatic decline of Q. robertingeri (Jiang et al. Citation2016). In view of the serious threats and their high sensitivity to environmental factors, this species was listed as the VU (vulnerable) species in the red list of China’s vertebrates (Jiang et al. Citation2016). However, knowledges especially on the population diversification of this species remains scarce, and it is obligatory for us to put strategies to resolve the status of the species. Investigations on population diversification of the VU species would promote conservation of its endemic germplasm resources and genetic diversity.
In light of its rapid rate of evolution and maternal inheritance (Sun et al. Citation2012), mitochondrial DNA markers have been often used to evaluate genetic diversity, detect phylogenetic relationships, and recognize phylogeographic clusters (Weiss et al. Citation2011; Liu et al. Citation2015; Wang et al. Citation2017). In this study, the mitochondrial cytochrome oxidase subunit I (COI) gene was used to investigate phylogenetic position of Q. robertingeri and its population genetic diversity.
Materials and methods
A total of 110 specimens of Q. robertingeri were collected from seven localities (P1–P7) scattered in the boundary of Sichuan and Guizhou provinces and Chongqing City, China (; ). In addition, 10 specimens of Q. boulengeri were also collected in six same places together with Q. robertingeri (). Tissues were collected and stored separately in 95% ethanol before specimen fixation. Specimens were preserved in the Chengdu Institute of Biology, Chinese Academy of Sciences (CIB, CAS). Total DNA was extracted from the tissues using a standard phenol–chloroform extraction procedure (Sambrook et al. Citation1989). COI primers and PCR protocols follow Che et al. (Citation2012). Sequencing was conducted in both directions using the same primers as used in the PCR using ABI3730 sequencer in Shanghai Generay Biotech Co. Ltd. (Shanghai, China). The new sequences were deposited in the GenBank with accession numbers MW143300–MW143315 and MW143325–MW143334. For phylogenetic comparisons, corresponding sequences of two ‘Q. robertingeri,’ five Q. boulengeri, one Q. jiulongensis, one Q. exilispinosa, one Q. spinosa, one Q. shini, one Q. verrucospinosa, one Q. yei, and one Nanorana parkeri were downloaded from GenBank (GenBank accession nos.: JN700886, KY441640, KC686711, KF199152, KX233867, KX233868, KX645665, KF199149, MH938690, MG820454, MK093237, KR087899, KJ700855, and KP317482).
Figure 1. Sampling localities in this study and phylogenetic relationships of Quasipaa robertingeri. (A) Sampling localities in this study, showing sympatric distributions of Q. robertingeri and Q. boulengeri. (B) Maximum-likelihood tree based on COI gene sequences of Q. robertingeri and its congeners. Bootstrap support values were denoted near nodes. (C) Sampling localities in this study, showing distributions of lineages of Q. robertingeri. (D) Phylogenetic relationships of haplotypes of Q. robertingeri. (E) Haplotype network of Q. robertingeri. The circle size is proportional to the number of samples. One black dot means one mutation.
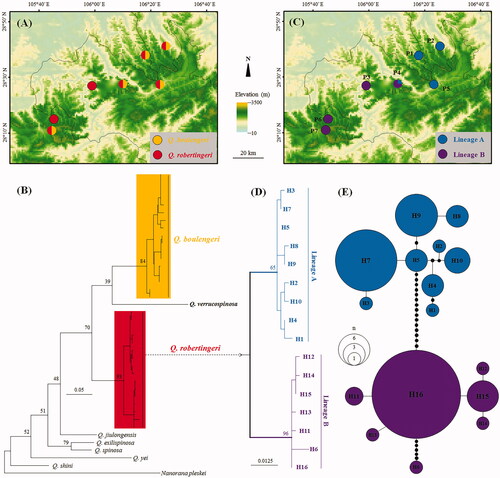
Table 1. Genetic diversity and neutrality tests of Quasipaa robertingeri.
Sequences were assembled and aligned using BioEdit 7.0.9.0 (Hall Citation1999) with default settings. Haplotypes were recognized using DnaSP 5 (Librado and Rozas Citation2009). Phylogenetic relationships of haplotypes of Q. robertingeri and its related species were reconstructed using maximum likelihood (ML), as implemented in the program PHYML 3.0 (Guindon et al. Citation2010). Nanorana parkeri was used as outgroup according to Che et al. (Citation2009). For ML analyses, the best-fitting nucleotide substitution model was selected under the corrected Akaike information criterion (AICc) using JMODELTEST 2.1.7 (Guindon and Gascuel Citation2003; Darriba et al. Citation2012). The optimal nucleotide substitution model (GTR + I+G) was selected for the analyses. Non-parametric bootstrapping with heuristic searches of 1000 replicates was used to assess confidences of branches in ML trees. Pairwise uncorrected p-distances between clades and populations were estimated using MEGA 6 (Tamura et al. Citation2013). In addition, a haplotype network of Q. robertingeri was constructed using maximum parsimony method in TCS 1.21 (Clement et al. Citation2000).
Haplotype diversity (h) and nucleotide diversity (π) were estimated using DnaSP. Genetic signals of departure from neutrality or potential population expansion were estimated for populations using Tajima’s D (Tajima Citation1989) and Fu’ Fs (Fu Citation1997) statistics, estimated in DnaSP.
Results
Alignment resulted in 504 base pair long sequences. Sixteen haplotypes were recognized from 110 individuals from seven populations of Q. robertingeri (). Phylogenetic analyses clustered the 16 haplotypes of Q. robertingeri into a clade (). Ten specimens of Q. boulengeri collected in this study were nested with five Q. boulengeri sequences and two sequences named as ‘Q. robertingeri’ downloaded from GenBank in a clade (). The Q. robertingeri clade, the Q. boulengeri clade, and one Q. verrucospinosa were clustered into a big clade (bootstrap support = 70%) separating from other congeners () though the relationships of the three species in this clade were not resolved. The Q. robertingeri clade contains two divergent lineages, lineages A and B. Lineage A contained nine haplotypes (Haps 1–9), and lineage B contained seven haplotypes (Haps 10–16) (). Lineage A contained samples from populations P1, P2, P4, and P5, and lineage B contained samples from populations P3, P5, P6, and P7 ().
The least mean genetic distance between Q. robertingeri and its congeners was 11.5% (vs. Q. boulengeri). Genetic distance between lineages A and B of Q. robertingeri was 3.4%. Genetic distances between populations fall in the range of 0.0–4.8%, with an overall average at 2.3%.
Haplotype diversity (h) and nucleotide diversity (π) are presented in . The total haplotype diversity of Q. robertingeri was 0.755. Lineage A had higher haplotype diversity (0.736) than B (0.354). In populations, the population P4 showed the highest haplotype diversity (0.670), followed by the P1 population (0.667) and P2 (0.518), and other populations showed low haplotype diversity (h < 0.5). The total nucleotide diversity was 0.01771, but two major lineages have low nucleotide diversity (π < 0.045). The population P4 showed the highest nucleotide diversity (0.01259) and other populations exhibited low nucleotide diversity (π < 0.0039). In the total population and lineage A, Tajima’s D, and Fu’s Fs tests all resulted in no-significant positive values (p>.05), and as well, all populations had no significant negative values (p>.05; ), suggesting that there was no recent population expansion in these groups. As note, in lineage B, Tajima’s D was significant negative (p<.05; ), indicating a signal for a recent expansion on population size of this lineage.
Discussion
In this study, we explored the phylogenetic status and diversification of the mountain frog Q. robertingeri through sampling populations across its narrow distributional range in southwestern China (). Che et al. (Citation2009) and Zhang et al. (Citation2018) all based on sequences of a very little number of samples of ‘Q. robertingeri’ proposed that ‘Q. robertingeri’ was invalid. However, in our tree based on mitochondrial COI gene sequences showed that the samples recognized as ‘Q. robertingeri’ in Che et al. (Citation2012) and Zhang et al. (Citation2018) were nested into the Q. boulengeri clade, but the true Q. robertingeri samples was divergent from its closely related species Q. boulengeri and Q. verrucospinosa (). Moreover, the smallest genetic distance on COI gene was 11.5% between Q. robertingeri and Q. boulengeri, being much higher and near four times of 3% as interspecific genetic distance proposed by Zhang et al. (Citation2018) and Vences et al. (Citation2005). Hence, all COI sequences recognized as ‘Q. robertingeri’ on GenBank were misidentified, and Q. robertingeri should be a valid species. Obviously, Q. robertingeri and Q. boulengeri are sympatric in the distributional range of Q. robertingeri (), easily preventing the classifications of the two species also with the reason on the superficially morphological similarity of them. Our result indicated that to evaluate the validity of a species should first take a comprehensive sampling on population level of it and its closely related species.
All 110 samples of Q. robertingeri were clustered into two major divergent lineages (). They should represent long-time evolutionary units of biodiversity with mean genetic distance of 3.4%. But within each lineage, the divergence between haplotypes was shallow indicating that populations in each lineage were probably young. Neutrality tests suggested that lineage B has been experienced a recent population expansion. Accordingly, the locality for the population P4 located between the distributional ranges of lineages A and B might be the secondary contact area. Based on the results of this study, we at least need to protect each independent lineage of the endemic species as soon as possible to avoid losing important genetic diversity.
Acknowledgements
We would like to express our gratitude to editors and the anonymous reviewers for their critical comments on the manuscript.
Disclosure statement
No potential conflict of interest was reported by the author(s).
Data availability statement
The data of this study are openly available in figshare at https://doi.org/10.6084/m9.figshare.13153115.v1.
Additional information
Funding
References
- Che J, Chen HM, Yang JX, Jin JQ, Jiang KE, Yuan ZY, Murphy RW, Zhang YP. 2012. Universal COI primers for DNA barcoding amphibians. Mol Ecol Resour. 12(2):247–258.
- Che J, Hu J, Zhou W, Murphy RW, Papenfuss TJ, Chen M, Rao D, Li P, Zhang YP. 2009. Phylogeny of the Asian spiny frog tribe Paini (family Dicroglossidae) sensu Dubois. Mol Phylogenet Evol. 50(1):59–73.
- Clement M, Posada D, Crandall K. 2000. TCS: a computer program to estimate gene genealogies. Mol Ecol. 9(10):1657–1660.
- Darriba D, Taboada GL, Doallo R, Posada D. 2012. jModelTest 2: more models, new heuristics and parallel computing. Nat Methods. 9(8):772.
- Fei L, Hu SQ, Ye CY, Huang YZ. 2009. Fauna Sinica, Amphibia, volume 3, Anura Ranidae. Beijing: Science Press.
- Fei L, Ye CY, Jiang JP. 2012. Colored atlas of Chinese Amphibians and their distributions. Chengdu: Sichuan Publishing House of Science and Technology.
- Frost DR. 2020. Amphibian species of the world version 6.0. New York: American Museum of Natural History; [accessed 2020 Oct 21]. http://research.amnh.org/vz/herpetology/amphibia/.
- Fu YX. 1997. Statistical test of neutrality of mutations against population growth, hitchhiking and background selection. Genetics. 147(2):915–925.
- Guindon S, Dufayard JF, Lefort V, Anisimova M, Hordijk W, Gascuel O. 2010. New algorithms and methods to estimate maximum-likelihood phylogenies: assessing the performance of PhyML 3.0. Syst Biol. 59(3):307–321.
- Guindon S, Gascuel O. 2003. A simple, fast, and accurate algorithm to estimate large phylogenies by maximum likelihood. Syst Biol. 52(5):696–704.
- Hall TA. 1999. BIOEDIT: a user-friendly biological sequence alignment editor and analysis program for Windows 95/98/NT. Nucleic Acids Symp Ser. 41(41):95–98.
- Jiang ZG, Jiang JP, Wang YZ, Zhang E, Zhang YY, Li LL, Xie F, Cai B, Cao L, Zheng GM, et al. 2016. Red list of China’s vertebrates. Biodivers Sci. 24 (5):500–551.
- Librado P, Rozas J. 2009. DnaSP v5: a software for comprehensive analysis of DNA polymorphism data. Bioinformatics. 25(11):1451–1452.
- Liu HX, Li Y, Liu XL, Xiong DM, Wang LX, Zou GW, Wei QW. 2015. Phylogeographic structure of Brachymystax lenok tsinlingensis (Salmonidae) populations in the Qinling Mountains, Shaanxi, based on mtDNA control region. Mitochondrial DNA. 26(4):532–537.
- Sambrook J, Fritsch EF, Maniatis T. 1989. Molecular cloning: a laboratory manual. New York: Cold Spring Harbor Laboratory Press.
- Sun P, Shi Z, Yin F, Peng S. 2012. Genetic variation analysis of Mugil cephalus in China sea based on mitochondrial COI gene sequences. Biochem Genet. 50(3–4):180–191.
- Tajima F. 1989. Statistical method for testing the neutral mutation hypothesis by DNA polymorphism. Genetics. 123(3):585–595.
- Tamura K, Stecher G, Peterson D, Filipski A, Kumar S. 2013. MEGA6: molecular evolutionary genetics analysis using evolutionary distance. Mol Biol Evol. 30(12):2725–2729.
- Vences M, Thomas M, Van der Meijden A, Chiari Y, Vieites DR. 2005. Comparative performance of the 16S rRNA gene in DNA barcoding of amphibians. Front Zool. 2(1):5.
- Wang B, Xie F, Li JN, Wang G, Li C, Jiang JP. 2017. Phylogeographic investigation and ecological niche modelling of the endemic frog species Nanorana pleskei revealed multiple refugia in the eastern Tibetan Plateau. PeerJ. 5:e3770.
- Weiss S, Marić S, Snoj A. 2011. Regional structure despite limited mtDNA sequence diversity found in the endangered Huchen, Hucho hucho (Linnaeus, 1758). Hydrobiologia. 658(1):103–110.
- Zhang JY, Zhang LP, Yu DN, Storey KB, Zheng RQ. 2018. Complete mitochondrial genomes of Nanorana taihangnica and N. yunnanensis (Anura: Dicroglossidae) with novel gene arrangements and phylogenetic relationship of Dicroglossidae. BMC Evol Biol. 18(1):26.