
Abstract
Southern bluefin tuna (Thunnus maccoyii Castelnau, 1872) is distributed across most of the southern temperate ocean and migrates extensively between 30°S and 50°S. Since T. maccoyii has been continually and heavily exploited, it is necessary to investigate the genetic diversity, population structure and demographic history of T. maccoyii for effective management and conservation. Thirty-seven gonad tissues of T. maccoyii were sampled from two locations, which were in the eastern Indian Ocean and the eastern Atlantic Ocean, by scientific observers onboard Korean T. maccoyii longline vessels in 2015. We compared 1240-bp sequences of combined mitochondrial DNA (mtDNA) from the cytochrome c oxidase subunit I (COI, 504-bp) and control region (CR, 736-bp) sequences. The pairwise fixation index (FST) and maximum-likelihood tree showed that two clades (A and B) were formed regardless of locations. Clade A occurred more commonly than clade B in both localities: the occurrence ratio of clade A was 69% in the Indian Ocean, and 79% in the Atlantic Ocean, respectively. Our findings suggest that a historic differentiation event may have occurred in T. maccoyii, but recently the connectivity between the two oceans may be possible in T. maccoyii populations.
Introduction
Southern bluefin tuna (Thunnus maccoyii Castelnau, 1872) is a large, long-lived, and highly migratory fish found throughout most southern temperate oceans except the more easterly regions of the southern Pacific (Polacheck Citation2012). This species is slow-growing and late-maturing relative to other tunas (Caton et al. Citation2000), and shifts among several habitats during ontogenetic growth (Patterson et al. Citation2018). The T. maccoyii stock has been exploited for more than 50 years and remains below 20% of the initial spawning stock biomass and the level estimated to produce maximum sustainable yield (CCSBT Citation2018).
When fisheries management is not based on the population structure, any changes may occur in the biological attributes, productivity, and genetic diversity of the exploited species (Ricker Citation1981). Therefore, a multidisciplinary approach is needed to define population or species boundary, and genetic studies can contribute valuable information in this regard (Pawson and Jennings Citation1996; Waldman Citation1999). Phylogeny and population genetic studies have been conducted for effective management of Thunnus species (Bartlett and Davidson Citation1991; Chow and Inoue Citation1993; Chow and Kishino Citation1995; Alvarado Bremer et al. Citation1997; Antoniou et al. Citation2017; Suda et al. Citation2019). Among genetic markers, the less variable portion of the cytochrome c oxidase subunit I (COI) and hypervariable portion of the control region (CR) have been broadly used to identify fish species, including tunas, and to clarify population structure (Ward et al. Citation2005; Paine et al. Citation2007; Kunal et al. Citation2013). Therefore, the present study compared the genetic diversity, population structure and demography of T. maccoyii between two main fishing areas of the Indian Ocean and the Atlantic Ocean.
Materials and methods
Sampling
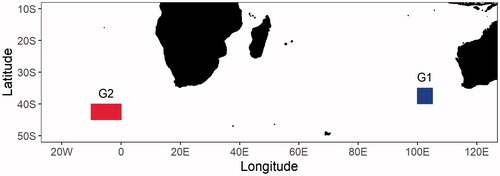
A total of thirty-seven T. maccoyii gonad tissue samples were collected by scientific observers on board Korean tuna longline vessels, which were sampled in the eastern Indian Ocean (G1) and in the eastern Atlantic Ocean (G2) from April to September 2015 (). The tissues sampled were preserved in 99% ethanol until DNA extraction. The sequences of all samples used in this study have been deposited in GenBank under accession numbers MZ222168-MZ222241.
Figure 1. Sampling locations of Thunnus maccoyii, which G1 and G2 indicate samples from the eastern Indian Ocean and the eastern Atlantic Ocean, respectively.
DNA extraction, PCR and sequencing
Genomic DNA was extracted using 10% Chelex 100 Resin (Bio-Rad, Hercules, CA, USA) from the gonadal tissues. The 736-bp fragment of the CR was amplified using the primers JEGY-F (5′-ACC GGA CGT CGG AGG TTAAA-3′) and JEGY-R (5′-TGG GCC ATA AAA TAC CCC ACTC-3′) that were newly designed to suit T. maccoyii in the present study. The reaction mixture for amplification of the CR had a final volume of 20 μL, including 12.3 μL of distilled water, 2 μL of 10× PCR buffer, 1.6 μL of 2.5 mM dNTPs, 1 μL of each primer, and 0.1 μL of Ex-Taq polymerase (Takara Shuzo, Japan). The thermal regime consisted of an initial denaturation at 94 °C for 5 min; 34 cycles of denaturation at 94 °C for 40 s, annealing at 51 °C for 45 s, extension at 72 °C for 1 min; and final denaturation at 72 °C for 5 min; the mixture was then maintained at 4 °C. The ∼650-bp fragment of COI was amplified using the primers VF2_t1 (5′-TCA ACC AAC CAC AAA GAC ATT GGCAC-3′) and FishR2_t1 (5′-ACT TCA GGG TGA CCG AAG AAT CAG AA-3′) (Ivanova et al. Citation2007). The reaction mixture for amplification of COI had a final volume of 20 μL, including 12.3 μL of distilled water, 2 μL of 10× PCR buffer, 1.6 μL of 2.5 mM dNTPs, 1 μL of each primer, and 0.1 μL of Ex-Taq polymerase (Takara Shuzo) with a Bio-Rad T100 Thermal Cycler (Bio-Rad). The thermal regime consisted of an initial denaturation at 95 °C for 5 min; 34 cycles of denaturation at 95 °C for 1 min, annealing at 52 °C for 1 min, extension at 72 °C for 1 min; and final denaturation at 72 °C for 5 min; the mixture was then maintained at 4 °C. The PCR products were purified with ExoSAP-IT (United States Biochemical Corporation USA) and then were sequenced with the ABI PRISM BigDye Terminator v3.1 Ready Reaction Cycle Sequencing Kit on an ABI 3730xl DNA Analyzer (Applied Biosystems Inc., USA).
Data analysis
The generated COI and CR sequences were edited using BioEdit ver. 7.2.5 software (Hall Citation1999), and aligned using Clustal W program (Thompson et al. Citation1994) with previously determined sequences of T. maccoyii deposited at the National Center for Biotechnology Information (NCBI), USA (). DnaSP ver. 5.10.01 software (Librado and Rozas Citation2009) was used to determine mitochondrial DNA (mtDNA) haplotypes. For each specimen, the number of haplotypes, polymorphic sites, transitions, transversions, haplotype diversity (h) (Nei Citation1987) and Nucleotide diversity (π) (Nei and Li Citation1979) were estimated to investigate the genetic diversity using Arlequin ver. 3.5.1.2 software (Excoffier et al. Citation2005). The phylogenetic analyses were performed by the maximum likelihood method using Tamura-Nei model (Tamura and Nei Citation1993) with 1000 bootstrap replications, and MEGA 7 software was used for these analyses. Pairwise fixation index (FST) was calculated to investigate the genetic differentiation between the populations, and using Arlequin. A haplotype network was inferred from the median-joining network constructed using Network ver. 4.6.1.3 software (Fluxus Tech, USA). Evidence of population expansion was tested with Fu's Fs (Fu Citation1997) and neutrality tests for equilibrium in mutational drift were carried out by Tajima's D (Tajima Citation1989) using Arlequin. Past demographic parameters were estimated, including τ which is time since expansion (Li Citation1997) and θ0 and θ1 which mean θ for before and after population expansion (Rogers and Harpending Citation1992). The value for τ was transformed by the equation τ = 2ut to estimate the real time since expansion (Rogers and Harpending Citation1992), where u is the mutation rate for the whole sequence and t is the time since expansion. The mean mutation rate of 3.6% per nucleotide per million years was used, based on Donaldson and Wilson (Citation1999) and Mandal et al. (Citation2012). Furthermore, Harpending's raggedness index (Hri) (Harpending Citation1994) and the sum of squared deviations (SSD) was calculated using Arlequin.
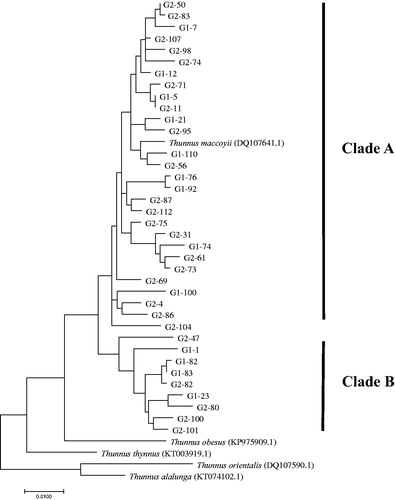
Figure 2. The phylogenetic tree based on the maximum-likelihood (ML) using Tamura-Nei model with 1000 bootstrap replications, for the combined mtDNA gene sequences (1240-bp) for T. maccoyii. G1 and G2 indicate samples from the estern Indian Ocean and the eastern Atlantic Ocean, respectively.
Results and discussion
We obtained 504-bp sequences of the COI region and 736-bp sequences of CR from 37 T. maccoyii individuals. The COI sequences from two localities identified 37 haplotypes, and 13 polymorphic sites were detected, with 12 transitions and one transversion. The CR sequences identified 37 haplotypes, and 217 polymorphic sites were detected, with 187 transitions and 28 transversions. Haplotype diversities (h) were 1.000 in both localities and markers, while nucleotide diversities (π) differed greatly between markers: 0.002 in COI, but 0.033–0.039 in CR. The COI and CR genes showed that the T. maccoyii population had consistent haplotype and nucleotide diversities between two localities, indicated by the high level of haplotypes and the low level of nucleotides. And for the combined gene the h value was 1.000 and the π value ranged from 0.017 to 0.020 (). Therefore, T. maccoyii showed high levels of haplotype diversity in COI, CR and the combined sequences, while the nucleotide diversity was low.
Table 1. mtDNA sequence variability in the cytochrome c oxidase subunit I (COI), control region (CR) and the combined genes for Thunnus maccoyii.
The levels of haplotype and nucleotide diversities for CR sequences in the T. maccoyii were higher than for CR sequences in Atlantic bluefin tuna (T. thynnus) (0.991 and 0.015 (Carlsson et al. Citation2004), and 0.987 and 0.018 (Boustany et al. Citation2008), respectively). On the other hand, the nucleotide diversity of T. maccoyii was lower than that for Atlantic bonito (Sarda sarda) (0.051–0.071, Viñas et al. Citation2004b). Alvarado Bremer et al. (Citation1997) reported a nucleotide diversity of 0.034 for T. maccoyii mtDNA CR, which similar to that of T. maccoyii in the present study. As for the combined mtDNA sequence, T. maccoyii showed lower nucleotide diversity compared to other Thunnus species (0.017–0.072, Alvarado Bremer et al. Citation1997), albacore tuna (T. alalonga) (0.054, Viñas et al. Citation2004a), and little tunny (Euthynnus alletteratus) (0.057, Alvarado Bremer and Ely Citation1999). High genetic diversity may be due to large population size, environmental heterogeneity, and life-history traits that allow rapid population growth (Nei Citation1987).
The pairwise fixation index (FST) between the two localities did not have statistically significant values, so the indices between the two clades (A and B) were observed (). The FST value between the clades was 0.308 (p < 0.001) based on the combined sequences (). The genetic distances of the combined sequences were 1.5–3.3% between the two clades, and 0.0–2.7% and 0.1–2.9% within clade A and B, respectively. Clades A and B appeared in both localities; the occurrence ratios of clade A were 69% in the Indian Ocean and 79% in the Atlantic Ocean, and the ratios of clade B were 31% in the Indian Ocean and 21% in the Atlantic Ocean. Although the haplotype networks showed no geographical structure for T. maccoyii, it was found there is the existence of two distinct clades in T. maccoyii, suggesting that a historic differentiation event may have occurred between clades A and B (). However, recently the connectivity between the two clades may be possible since there are two different mtDNA clades in T. maccoyii, but they are mixed in both the Indian and Atlantic Oceans (). These results can be inferred that, in the past, the two clades separated from each other and formed independent clade through a unique evolutionary history, but recently the barriers between the two clades have disappeared, leading to reconnecting event. However, in order to verify the event, it is necessary to investigate whether reproductive isolation works between these clades by the microsatellite analysis.
Table 2. Analysis of molecular variance (AMOVA) results for the genetic structure of T. maccoyii based on the combined mtDNA sequence.
Tajima's D and Fu's Fs values for the two clades were negative, and for clade A Fu's Fs was significantly negative (p < 0.001) (), which means a sudden expansion in population size. Mismatch analysis showed that Fu's Fs and Tajima's D had a better agreement for clade A than clade B. The mean τ value (20.486) of two clades indicates that the sudden population expansion is estimated to have occurred 229,461 years ago.
Table 3. Summary of the combined mtDNA sequence variability for two clades of T. maccoyii.
Acknowledgments
The authors would like to thank Korean scientific observers who sampled southern bluefin tuna (Thunnus maccoyii) and SE Bae (PKNU) for their assistance in population structure analyses.
Disclosure statement
No potential conflict of interest was reported by the author(s).
Data availability statement
The data that support the findings of this study are openly available in [NCBI] at [https://www.ncbi.nlm.nih.gov/], reference number [MZ222168-MZ222241].
Additional information
Funding
References
- Alvarado Bremer JR, Ely B. 1999. Pronounced levels of genetic differentiation between two trans-Atlantic samples of little tunny (Euthynnus alletteratus). ICCAT Col Vol Sci Pap. 49(4):236–242.
- Alvarado Bremer JR, Naseri I, Ely B. 1997. Orthodox and unorthodox phylogenetic relationships among tunas revealed by the nucleotide sequence analysis of the mitochondrial DNA control region. J Fish Biol. 50:540–554.
- Antoniou A, Kasapidis P, Kotoulas G, Mylonas CC, Magoulas A. 2017. Genetic diversity of Atlantic Bluefin tuna in the Mediterranean Sea: insights from genome-wide SNPs and microsatellites. J Biol Res. 24:3.
- Bartlett SE, Davidson WS. 1991. Identification of Thunnus tuna species by the polymerase chain reaction and direct sequence analysis of their mitochondrial cytochrome b genes. Can J Fish Aquat Sci. 48(2):309–317.
- Boustany AM, Reeb CA, Block BA. 2008. Mitochondrial DNA and electronic tracking reveal population structure of Atlantic bluefin tuna (Thunnus thynnus). Mar Biol. 156(1):13–24.
- Carlsson J, McDowell JR, Diaz-Jaimes P, Carlsson JEL, Boles SB, Gold JR, Graves JE. 2004. Microsatellite and mitochondrial DNA analyses of Atlantic bluefin tuna (Thunnus thynnus thynnus) population structure in the Mediterranean Sea. Mol Ecol. 13(11):3345–3356.
- Caton A, McLoughlin K, Staples D. 2000. Fishery Status Reports 1999: resource assessments of Australian Commonwealth fisheries. Fishery Status Reports. Canberra: Agriculture, Fisheries and Forestry; p. 159–168.
- CCSBT. 2018. Report on biology, stock status and management of southern bluefin tuna: 2018. Report of the Twenty Third Meeting of the Scientific Committee. Commission for the Conservation of Southern Bluefin Tuna. Available from: https://www.ccsbt.org/sites/default/files/userfiles/file/docs_english/meetings/meeting_reports/ccsbt_25/report_of_SC23.pdf.
- Chow S, Inoue S. 1993. Intra and interspecific restriction fragment length polymorphism in mitochondrial genes of Thunnus tuna species. Bull Nat Res Inst Far Seas Fish. 30:207–225.
- Chow S, Kishino H. 1995. Phylogenetic relationships between tuna species of the genus Thunnus (Scombridae: Teleostei): Inconsistent implications from morphology, nuclear and mitochondrial genomes. J Mol Evol. 41(6):741–748.
- Donaldson KA, Wilson RR. 1999. Amphi-Panamic geminates of snook (Percoidei: Centropomidae) provide a calibration of the divergence rate in the mitochondrial DNA control region of fishes. Mol Phylogenet Evol. 13(1):208–213.
- Excoffier L, Laval G, Schneider S. 2005. Arlequin (version 3.0): An integrated software package for population genetics data analysis. Evol Bioinform Online. 1:47–50.
- Fu YX. 1997. Statistical tests of neutrality of mutations against population growth, hitchhiking and background selection. Genetics. 147(2):915–925.
- Hall TA. 1999. BioEdit: a user-friendly biological sequence alignment editor and analysis program for Windows 95/98/NT. Nucleic Acids Symp Ser. 41:95–98.
- Harpending HC. 1994. Signature of ancient population growth in a low-resolution mitochondrial DNA mismatch distribution. Hum Biol. 66(4):591–600.
- Ivanova NV, Zemlak TS, Hanner RH, Hebert PDN. 2007. Universal primer cocktails for fish DNA barcoding. Mol Ecol Notes. 7(4):544–548.
- Kunal SP, Kumar G, Menezes MR, Meena RM. 2013. Mitochondrial DNA analysis reveals three stocks of yellowfin tuna Thunnus albacares (Bonnaterre, 1788) in Indian waters. Conserv Genet. 14(1):205–213.
- Li WH. 1997. Molecular evolution. Sunderland (MA): Sinauer Associates, Inc.; p. 487.
- Librado P, Rozas J. 2009. DnaSP v5: a software for comprehensive analysis of DNA polymorphism data. Bioinformatics. 25(11):1451–1452..
- Mandal A, Mohindra V, Singh RK, Punia P, Singh AK, Lal KK. 2012. Mitochondrial DNA variation in natural populations of endangered Indian Feather-Back Fish, Chitala chitala. Mol Biol Rep. 39(2):1765–1775.
- Nei M. 1987. Molecular evolutionary genetics. New York: Columbia University Press; p. 18–496.
- Nei M, Li WH. 1979. Mathematical model for studying genetic variation in terms of restriction endonucleases. Proc Natl Acad Sci USA. 76(10):5269–5273.
- Paine MA, McDowell JR, Graves JE. 2007. Specific identification of Western Atlantic Ocean scombrids using mitochondrial DNA cytochrome c oxidase subunit I (COI) gene region sequences. Bull Mar Sci. 80(2):353–367.
- Patterson TA, Eveson JP, Hartog JR, Evans K, Cooper S, Lansdell M, Hobday AJ, Davies CR. 2018. Migration dynamics of juvenile southern bluefin tuna. Sci Rep. 8(1):14553.
- Pawson MG, Jennings S. 1996. A critique of methods for stock identification in marine capture fisheries. Fish Res. 25(3-4):203–217.
- Polacheck T. 2012. Assessment of IUU fishing for southern bluefin tuna. Mar Policy. 36(5):1150–1165.
- Ricker WE. 1981. Changes in the average size and average age of Pacific salmon. Can J Fish Aquat Sci. 38(12):1636–1656.
- Rogers AR, Harpending H. 1992. Population growth makes waves in the distribution of pairwise genetic differences. Mol Biol Evol. 9(3):552–569.
- Suda A, Nishiki I, Iwasaki Y, Matsuura A, Akita T, Suzuki N, Fujiwara A. 2019. Improvement of the Pacific bluefin tuna (Thunnus orientalis) reference genome and development of male-specific DNA markers. Sci Rep. 9(1):14450– 14412.
- Tajima F. 1989. Statistical method for testing the neutral mutation hypothesis by DNA polymorphism. Genetics. 123(3):585–595.
- Tamura K, Nei M. 1993. Estimation of the number of nucleotide substitutions in the control region of mitochondrial DNA in humans and chimpanzees. Mol Biol Evol. 10(3):512–526.
- Thompson JD, Higgins DG, Gibson TJ. 1994. CLUSTAL W: improving the sensitivity of progressive multiple sequence alignment through sequence weighting, position-specific gap penalties and weight matrix choice. Nucleic Acids Res. 22(22):4673–4680.
- Viñas J, Bremen JA, Pla C. 2004a. Inter-oceanic genetic differentiation among albacore (Thunnus alalonga) populations. Mar Biol. 145(2):225–232.
- Viñas J, Bremer JA, Pla C. 2004b. Phylogeography of the Atlantic bonito (Sarda sarda) in the northern Mediterranean: the combined effects of historical vicariance, population expansion, secondary invasion, and isolation by distance. Mol Phylogenet Evol. 33(1):32–42.
- Waldman JR. 1999. The importance of comparative studies in stock analysis. Fish Res. 43(1–3):237–246.
- Ward RD, Zemlak TS, Innes BH, Last PR, Hebert PD. 2005. DNA barcoding Australia's fish species. Philos Trans R Soc Lond B Biol Sci. 360(1462):1847–1857.