
Abstract
Chrysolophus amherstiae and Chrysolophus pictus are two related species of Chrysolophus. Understanding the differences in their mitochondrial genome structure is of great significance for studying their phylogenetic relationship. In this study, the full mitochondrial genome of C. amherstiae was sequenced and annotated and analyzed with C. pictus to reveal their structural differences. At the same time, the phylogenetic trees were constructed based on the BI and ML methods with other species of the same family to analyze the phylogenetic relationship of Phasianidae. The results showed that the basic characteristics of mitochondrial genomes of C. amherstiae and C. pictus were similar. By comparing the secondary structures of rRNA and the relative synonymous codon usage of protein-coding genes, the subtle differences of mitochondrial structures between the two were further demonstrated.
1. Introduction
Mitochondria is an organelle existing in most eukaryotic cells. It provides more than 95% of energy for eukaryotic cells by participating in oxidative phosphorylation of the respiratory chain. It has its own genetic material and genetic system, is a semi-autonomous organelle (Boore Citation1999). Due to its advantages of small size, maternal inheritance, rapid evolution, and fewer introns, the mitochondrial genome has been widely used in the study of phylogenetic evolution among related species, maternal evolution, the relationship of geographical distribution, the origin of animals, hybridization–introgression in nature and so on (Gui Citation1990).
The Chrysolophus belongs to Phasianidae of Galliformes, which contains Chrysolophus amherstiae and Chrysolophus pictus. The two species are similar in body shape, but there is huge disparity in the color of their feathers. The C. pictus are mainly golden yellow and dark red, and most of the body of the C. amherstiae is metallic emerald green and white. Through transcriptome sequencing, genes related to pigment synthesis were compared between the two species and the evolutionary mechanism of feather color was explored (Gao Citation2016). There are also differences in the distribution locations of them. The C. pictus is endemic to China, mainly distributed in the south of the Qinling Mountains to the northeast of Yunnan, with an elevation of 800–1600 m. While most of the C. amherstiae are found in Sichuan, western Guizhou, Guangxi, southeastern Xizang and Yunnan, some of them extend from western Yunnan to Myanmar, and are commonly seen at an altitude of 1800–3600 m (Zheng Citation2017). As the distribution ranges of C. amherstiae and C. pictus overlap, and both of them can produce hybrid offspring in cage or natural state (Shi et al. Citation2018), it indicates that the reproductive isolation mechanism between the two species is not perfect and the taxonomic status is controversial. At present, the incomplete mitochondria of them were analyzed by mitochondrial DNA restriction nuclease, found that their genetic distance was only 0.012, and the time of differentiation was about 0.6 million years ago. It was thought that they might be just two subspecies (Zhang et al. Citation1991). But according to the cytochrome b gene, their genetic distance was calculated to be 0.025, they were considered to have diverged at least 1.7 million years ago, suggesting that they were two independent species (Xiangyu et al. Citation2000). Similarly, the genetic distance between them was estimated to be 0.027–0.043 by mitochondrial control region sequences, and the time of divergence was thought to be about 1.75 million years, supporting the fact that the two species were separate (Huang et al. Citation2006). In a word, the appearance and distribution between C. amherstiae and C. pictus were diverse, and the current studies were limited to a single gene or fragment, lack of complete and specific comparative analysis.
In this study, the whole mitochondrial genome of the C. amherstiae was amplified, and its structure was further analyzed, then compared it with C. pictus. The rRNA secondary structures and the relative synonymous codon usage (RSCU) of protein-coding genes (PCGs) in the two species were analyzed in detail for the first time, revealing the evolutionary characteristics and relationships between the two closely related species.
2. Materials and methods
2.1. Sample collection and DNA extraction
The sample of C. amherstiae was collected in Lushan County (102°52′ E, 30°30′ N), Sichuan Province, China in January 2010, and the muscle tissues were stored in the Zoology Laboratory of College of Life Science, Sichuan Agricultural University (no. 000879). The total DNA of C. amherstiae was extracted with TIANamp Genomic DNA Kit (Tiangen Biotech Co., Ltd., Beijing, China) which was detected by 1% AGAR gel electrophoresis and stored at −20 °C.
2.2. Amplification and sequencing of mitochondrial genome
The primers were designed based on C. pictus (MN857545) from GenBank and synthesized by Sangon Biotechnology Company (Shanghai, China). The amplification system was 20 μL, and the upstream and downstream primers were 0.5 μL (10 μmol/L), 0.8 μL for DNA, 10 μL for 2 × Taq Master Mix, and 8.5 μL for ddH2O. The PCR reaction conditions were as follows: pre-denaturation at 94 °C for 5 min; 94 °C denaturation for 30 s, annealing for 30 s, 72 °C extension for 90 s, cycling for 35 times; extended at 72 °C for 10 min. The amplified products were detected by 1% AGAR gel electrophoresis, when the band size and concentration matched, they were sent to Sangon Biological Company (Shanghai, China) for Sanger sequencing.
2.3. Assembly and analysis of mitogenomes sequences
According to the reference sequence on the NCBI, Lasergene was used to assemble the original data to obtain the complete mitochondrial genome sequence of C. amherstiae and then, compared with the mitochondrial genome sequence of C. pictus to determine the positions of 13 PCGs and two rRNAs, and calculate the bases composition. tRNAs were predicted by mitochondrial tRNA Forecast website (http://130.235.244.92/ARWEN/index.html). The predicted tRNAs, intergenic spacers, and overlapping regions between genes by manual check. Combined with the 12S rRNA (Gallus gallus) and 16S rRNA (Chrysolophus pictus), secondary structures downloaded from RNA database (http://www.rna.ccbb.utexas.edu/) and RNA Central (https://rnacentral.org/), and compared with the rRNA secondary structures of some birds (Ke et al. Citation2010; Yang et al. Citation2012), rRNA secondary structures of the two species were predicted. RSCU was analyzed with MEGA 7.
2.4. Phylogenetic analysis
In this study, 21 species of 10 genera of Phasianidae were selected for phylogenetic analysis, and Aix galericulata was selected as outgroup, their mitochondrial genomes were downloaded from NCBI (). Both maximum-likelihood (ML) and Bayesian inference (BI) were employed for phylogenetic analyses, which were performed using MEGA 7 and PhyloSuite V1.2.2.
Table 1. Annotation of the mitochondrial genome of Chrysolophus amherstiae (C.a) and Chrysolophus pictus (C.p).
3. Results
3.1. General characters and composition of mitogenomes
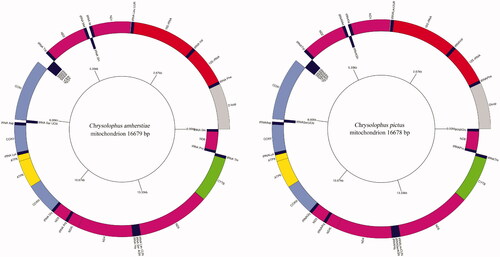
The complete mitogenomes sequences of the two species were 16,679 bp (C. amherstiae, MW880933) and 16,678 bp (C. pictus), the contents of A, T, G, and C were basically similar. The mitochondrial genomes of both species contained 13 PCGs (COX1-3, ND1-6, ND4L, ATP6, ATP8, Cytb), two rRNA genes (12S rRNA and 16S rRNA), 22 tRNA genes, and a D-loop region. Among them, eight tRNA genes (tRNAGln, tRNAAla, tRNAAsn, tRNACys, tRNATyr, tRNASer, tRNAPro, tRNAGlu) and a protein-coding gene (ND6) were located on the mitochondrial light chain while other genes were encoded on the heavy chain (). There were nine overlapping regions in the whole circular of C. amherstiae, with a total of 32 bp, the C. pictus had eight overlapping regions and a total of 31 bp. The size of the two specie’s overlapping regions varied from 1 to 10 bp, and the largest overlap was between ATP8 and ATP6. There were 17 intergenic spacers in both C. amherstiae (49 bp in total) and C. pictus (50 bp in total). The size of the intergenic spacers ranged from 1 to 11 bp, and the largest intergenic spacer was between tRNALeu and ND1 ().
Figure 1. Mitochondrial map of C. amherstiae and C. pictus.
3.2. Protein-coding genes and relative synonymous codon usage
The nucleotide composition of 13 PCGs in the mitochondria of C. amherstiae and C. pictus was similar to other birds. The AT content of 13 PCGs of C. amherstiae was 51.52–59.39%, and the C. pictus was 50.84–61.21%, and they showed similar A and T nucleotide biases (). The ND4L gene had the lowest AT content and the ATP8 gene was the highest both in C. amherstiae and C. pictus. The use of start codon and stop codon of C. amherstiae was the same as that of C. pictus. Except that the start codon of COX1 was GTG, the others were ATG. In terms of termination codons, ND2, ND4, and COX3 were terminated with incomplete T, ND6 and COX1 with TAG and AGG, and the remaining genes were terminated with TAA.
Table 2. Nucleotide composition in PCGs of mitogenomes of Chrysolophus amherstiae (C.a) and Chrysolophus pictus (C.p).
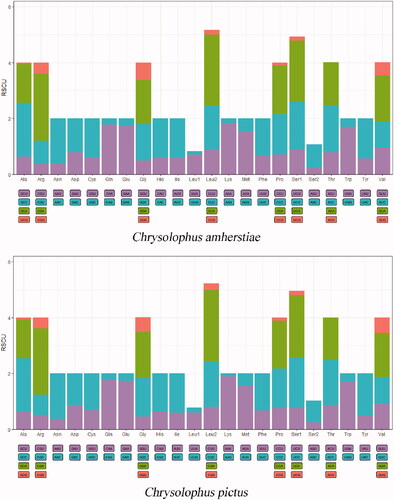
The codons study of 13 PCGs of C. amherstiae and C. pictus showed that the total number of codons was 3786, and no codon ACG (coding Thr) was detected. The most commonly used codons were CUA (C. amherstiae 278 times, C. pictus 279 times), AUC (C. amherstiae 215 times, C. pictus 214 times), and CUC (C. amherstiae 174 times, C. pictus 179 times). The corresponding amino acids were Leu2, Ile, and Leu1, respectively. According to the number of amino acids encoded by 13 PCGs in them, C. pictus encoded one more Ary, His, Met, Pro, Thr, and Val than C. amherstiae. C. amherstiae had one more Cys, Gly, Ile, Leu, and two Ser than C. pictus. By comparing the RSCU values of the two species, there was a subtle distinction in the use frequency of synonymous codon for different amino acids (). For example, the codon CUG was used more frequently in Leu2 of C. pictus than C. amherstiae, while Gly of C. amherstiae used codon GGG more often than Gly of C. pictus. In addition, at the 13th amino acid position of ATP6 gene, C. amherstiae was Cys but C. pictus was Tyr, and at the 194th amino acid position, there were Thr and Ala of C. amherstiae and C. pictus, respectively.
Figure 2. The relative synonymous codon usage (RSCU) in the mitogenomes of C. amherstiae and C. pictus.
3.3. tRNAs and rRNAs
There were 22 tRNAs in the mitochondrial genome of the C. amherstiae, including two repetitive tRNALeu and tRNASer. The length range of the sequences was 66–76 bp. By predicting the secondary structure of tRNAs, tRNASer (AGN) was found unable to form a complete cloverleaf secondary structure due to the lack of dihydrouracil (DHU) loop, and the rest of tRNAs could take shape a complete cloverleaf secondary structure. The basic tRNA characteristics of C. pictus are the same as those of C. amherstiae.
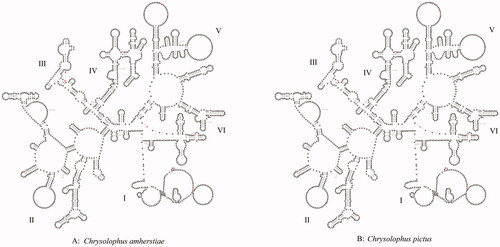
There were two rRNAs, including 12S rRNA and 16S rRNA in the mitochondria of both C. amherstiae and C. pictus. 12S rRNA was located between tRNAPhe and tRNAVal, the length of 12S rRNA of the two species was the same, both were 969 bp, but there were 11 bp differences in bases. 16S rRNA was located in between tRNAVal and tRNALeu (UUR), C. amherstiae was 1606 bp, and C. pictus was 1605 bp, there were 16 bp differences. By predicting the secondary structure of rRNA, it can be seen that the stem-loop structures in the diagram were arranged alternately, and the basic structures of the two were roughly the same. Their 12S rRNA secondary structures all contained four domains (I–IV) and 46 stem-loop structures (). The differences between them mainly existed in the ring regions of domain I and domain II, and only one base difference existed in domain III. Both 16S rRNA secondary structures contained 6 domains (I–VI) and 65 stem-loop structures (), and domain II contained five bases differences the most. On the whole, the differences between the two were mostly in the loop region, while the stem regions were relatively conservative. However, due to the differences of individual bases, the stem-loop structures were changed. For example, the base C was inserted at 765 bp of 16S rRNA of C. amherstiae (, red arrow), resulting in a larger ring structure there than that of C. pictus.
Figure 3. Prognostic map of 12S rRNA secondary structures in C. amherstiae and C. pictus. The different bases are shown in red. I–IV represent structural domains.
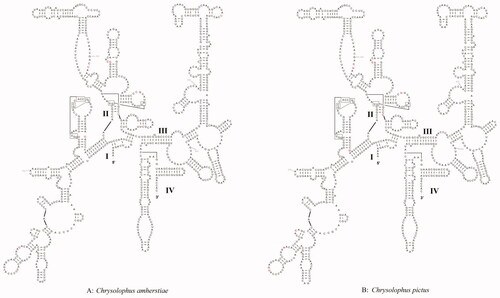
Figure 4. Prognostic map of 16S rRNA secondary structures in C. amherstiae and C. pictus. The different bases are shown in red. The red arrow represents the inserted base. I–VI represent structural domains.
3.4. Phylogenetic analysis
Mitochondrial genome sequences of C. amherstiae and C. pictus were compared with those of other 19 species belonging to nine genera (Crossoptilon, Lophura, Phasianus, Syrmaticus, Lyrurus, Pucrasia, Lophophorus, Tetraophasis, Pavo) of Pheasinidae. Phylogenetic trees were constructed by BI and ML methods, Aix galericulata was selected as an outgroup.
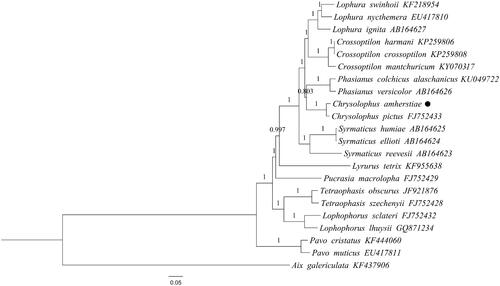
The results of phylogenetic trees obtained by the two methods were slightly different, but the BI tree has higher confidence ( and ). Except for the outgroup of Aix galericulata, the other 22 species of Pheasinidae were divided into 10 branches, they were belonged to 10 genera. In addition, the other nine genera except Pavo were assembled into a large cluster. In this large cluster, Lophophorus and Tetraophasis were gathered into a branch, Pucrasia, Crossoptilon, Chrysolophus, Lophura, Phasianus, Syrmaticus, and Lyrurus were clustered into a branch, but Pucrasia was grouped with Lophophorus and Tetraophasis in the ML tree. The evolutionary relationship between Crossoptilon and Lophura was relatively close, and both were polyphyletic groups. It was consistent with the results obtained by previous reports (Bai et al. Citation2020). The results of this study proved that Chrysolophus was clustered with Crossoptilon and Lophura, which was consistent with some of the current conclusions (Shen et al. Citation2010), but different from some results, they argued that the Chrysolophus and Phasianus should be gathered into a tuft (Bai Citation2020). The Syrmaticus was also a polyphyletic group and had a distant internal evolutionary relationship. The relationship between C. amherstiae and C. pictus was closer than other species, which was consistent with the current classification.
Figure 5. Maximum-likelihood (ML) phylogenetic tree constructed based on complete mitochondrial genomes from 21 species of 10 genera of Phasianidae. Numbers at the branches indicated the bootstrapping values with 10,000 replications. Filled circle represented a sequence from this study.
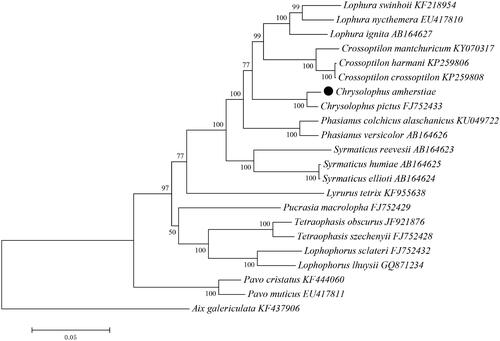
Figure 6. Bayesian inference (BI) phylogenetic tree constructed based on complete mitochondrial genomes from 21 species of 10 genera of Phasianidae. Numbers at the branches indicated the bootstrapping values with 10 million generations. Filled circle represented a sequence from this study.
4. Discussion
At present, the study of Pheasinidae and other animals using mitochondrial genomes is developing rapidly. More and more scholars use mitochondrial single genes or full sequences to classify and identify different birds of Pheasinidae and analyze their phylogeny. However, the comparative studies between C. amherstiae and C. pictus are limited to the comparison of individual genes of mitochondria or appearance, and the molecular evidence is not comprehensive enough. The use of the complete mitochondrial genomes comparison can provide more evidence and obtain more accurate results.
In this study, the C. amherstiae was sequenced, and its nucleotide content showed AT bias and anti-G shift, the C. pictus was the same as it. The basic mitochondria of both are similar to those of most Pheasinidae birds. It was found that there were a few differences in the number and type of bases in the overlapping and discontinuous regions of mitochondrial genes between C. amherstiae and C. pictus, which may be the result of evolutionary selection.
There were incomplete stop codons ‘T’ in 13 PCGs of both species, these incomplete stop codons may be transformed to TAA via post-transcriptional polyadenylation (Anderson et al. Citation1981). However, there were still some base variations in the 13 PCGs of the two species, which led to changes in the amino acids they encode, and their amino acids had nuance in use of synonymous codons. Since 13 PCGs are genes encoding polypeptides related to oxidative phosphorylation (Anderson et al. Citation1981), they can determine the production efficiency of ATP and are closely related to the adaptation of the body to the environment. ATP6 and Cytb were found to be the most sensitive to natural selection, and changes in amino acids at key parts will lead to changes in protein function (Dan et al. Citation2003). COX2, ND2, ATP6, ATP8, and Cytb were pointed out that through the adaptive choices at high altitudes, it may help them adapt to specific geographical environments (Luo et al. Citation2013). In this study, there were differences in the bases of 13 PCGs between C. amherstiae and C. pictus, especially the mutation of two amino acids in ATP6, which changed the protein hydrophobicity and affected the function of ATP6, such as the transformation between ADP and ATP, this phenomenon may be the adaptive evolution of its habitat at higher altitude than the C. pictus.
There were some divergences in 12S rRNA and 16S rRNA between C. amherstiae and C. pictus, mainly located in the ring region. rRNA is the slowest and most conserved gene in the mitochondrial genome (Neefs et al. Citation1990). The evolution of the general ring region is faster and the differences between species are large, while the stem region is relatively conserved (Woese et al. Citation1980; Noller Citation1984). However, none of these differences resulted in significant changes in the secondary structure of rRNA and were similar to that of other birds, possibly because these minor variations were constrained by their structure and function. In addition, there are no spacers in the genes, which is typical of metazoans (Wolstenholme and Jeon Citation1992). Their tRNASer (AGN) cannot be folded into the cloverleaf secondary structure because of the lack of DHU loop, which is similar to that of most vertebrates (Wang et al. Citation2004; Zhuang Citation2007; Ke et al. Citation2010; Wei et al. Citation2013; Liu Citation2014; Zhou, Zhou, et al. Citation2020; Zhou, Li, et al. Citation2020; Huang et al. Citation2021).
The phylogenetic trees of 19 species of birds belonging to nine genera of Pheasinidae and Chrysolophus were constructed by using the whole mitochondrial genomes. The phylogenetic relationship between C. amherstiae and C. pictus was closest, they were independently grouped into one branch. The Crossoptilon, Lophura, and Phasianus were closely related to the evolution of Chrysolophus, and the furthest relationship was Pavo. In this study, the relationship between Chrysolophus and Crossoptilon, Lophura, and Phasianus is like with some of the findings, and has a high support rate. It can provide reference for the phylogenetic analysis of Pheasinidae family in the future.
Disclosure statement
The authors declare no conflicts of interest and are alone responsible for the content and writing of the paper.
Data availability statement
The genome sequence data that support the findings of this study are openly available in GenBank of NCBI at https://www.ncbi.nlm.nih.gov/ under the accession no. MW880933.
Additional information
Funding
References
- Anderson S, Bankier AT, Barrell BG, de Bruijn MH, Coulson AR, Drouin J, Eperon IC, Nierlich DP, Roe BA, Sanger F, et al. 1981. Sequence and organization of the human mitochondrial genome. Nature. 290(5806):457–465.
- Bai W. 2020. Complete mitochondrial genome and phylogenetic relationship of Phasianidae birds. Taiyuan: Shanxi University.
- Bai W, Zhu J, Ren ZM. 2020. Complete mitochondrial genome of Chrysolophus pictus (Galliformes: Phasianidae), a national protected wild pheasant in China. Mitochondrial DNA B Resour. 5(1):1031–1033.
- Boore JL. 1999. Animal mitochondrial genomes. Nucleic Acids Res. 27(8):1767–1780.
- Dan M, Eduardo RP, Pawel G, Vincent M, Andrew GC, Seyed H, Martin B, Kirk E, Estella C, Michael DB, et al. 2003. Natural selection shaped regional mtDNA variation in humans. Proc Natl Acad Sci U S A. 100(1):171–176.
- Gao GQ. 2016. Researches of plumage pigmentation based on golden pheasant genome and transcriptome sequencing. Huhhot: Inner Mongolia University.
- Gui JF. 1990. The evolutionary genetics of vertebrate mitochondrial DNA. Chin J Zool. 1990(01):50–55.
- Huang YL, Huang J, Shi Y, Xu YH, Zhou YW, Hou SL. 2021. Mitochondrial genome sequence analysis and phylogenetic study of Lepus yarkandensist. Chin J Wildlife. 42(1):71–80.
- Huang ZH, Long J, Zhang LX, Liu CB, Liu NF. 2006. Genetic analysis of the mitochondrial DNA control region of Chrysolophus pictus and Chrysolophus amherstiae. J Jiangxi Normal Univ (Nat Sci). 2006(1):91–94.
- Ke Y, Huang Y, Lei FM. 2010. Sequencing and analysis of the complete mitochondrial genome of Podoces hendersoni (Ave, Corvidae). Hereditas. 32(9):951–960.
- Liu G. 2014. The complete mitochondrial genomes of four Anseriformes species and implications for their phylogenetics. Hefei: Anhui University.
- Luo YJ, Yang XH, Gao YQ. 2013. Mitochondrial DNA response to high altitude: a new perspective on high-altitude adaptation. Mitochondrial DNA. 24(4):313–319.
- Neefs JM, Van de Peer Y, De Rijk P, Goris A, De Wachter R. 1990. Compilation of small ribosomal subunit RNA sequence. Nucleic Acids Res. 18(Suppl.):2237–2317.
- Noller HF. 1984. Structure of ribosomal RNA. Annu Rev Biochem. 53(253):119–162.
- Shen YY, Liang L, Sun YB, Yue BS, Yang XJ, Murphy RW, Zhang YP. 2010. A mitogenomic perspective on the ancient, rapid radiation in the Galliformes with an emphasis on the Phasianidae. BMC Evol Biol. 10:132.
- Shi XY, Fu Q, Wang L, Jiang ZY, Shi XG, Li S. 2018. Notes on the natural hybridization of golden pheasant Chrysolophus pictus and Lady Amherst’s pheasant C. amherstiae in Anzihe Nature Reserve, Sichuan province. Chin J Zool. 53(4):660–663.
- Wang X, Sun Y, Yuan XD, Tang MQ, Wang L, Yu YF, Li QW. 2004. Comparative study of mitochondrial tRNA gene sequence and secondary structure among fifteen predatory birds. Yi Chuan Xue Bao. 31(4):411–419.
- Wei L, Liu JG, Liu F, Chu LX. 2013. Comparison of mitochondrial genomes of six felines. J Chuzhou Univ. 15(2):80–87.
- Woese CR, Magrum LJ, Gupta R, Siegel RB, Stahl DA, Kop J, Crawford N, Brosius J, Gutell R, Hogan JJ, et al. 1980. Secondary structure model for bacterial 16S ribosomal RNA: phylogenetic, enzymatic and chemical evidence. Nucleic Acids Res. 8(10):2275–2293.
- Wolstenholme DR, Jeon KW. 1992. Mitochondrial genomes. San Diego: Academic Press; p. 22.
- Xiangyu JG, Yang L, Zhang YP. 2000. Sequence divergence between Chrysolophus amherstiae and Chrysolophus pictus. Hereditas. 22(4):225–228.
- Yang C, Wang QX, Huang Y, Xiao H. 2012. Analysis of the complete mitochondrial genome sequence of Larus brunnicephalus (Aves, Laridae). Hereditas. 34(11):1434–1462.
- Zhang YP, Chen X, Shi LM. 1991. Studies on mitochondrial DNA (mtDNA) of two species of Chrysolophus and Phasianus colchicus. Zool Res. 1991(4):387–392.
- Zheng GM. 2017. Classification and distribution of birds in China. Beijing: Higher Education Press.
- Zhou J, Li JL, Chen QR, Liu M, Chen Y, Wu XS. 2020. Complete sequence determination and analysis of mitochondrial genome of Rex rabbit. Chin J Vet Sci. 40(4):823–827.
- Zhou T, Zhou J, Liang S, Bao ZY, Zhao BH, Hu SS, Chen Y, Wu XS. 2020. Complete mitochondrial genome sequence and analysis of Fujian yellow rabbit. Acta Agric Bor Occid Sin. 29(9):1295–1303.
- Zhuang X. 2007. Studies on complete mitochondrial genome of Epinephelus coioides and Epinephelus akaara. Xiamen: Xiamen University.