
Abstract
Celtis is a large genus in Cannabaceae family, with more than 70 species in the world. However, the intraspecific variabilities of morphological features make it difficult for some species to be distinguished based on their morphological characteristics. To supply the chloroplast (cp) genome resources of Celtis for species identification, the plastome of Celtis sinensis Persoon 1805 was newly sequenced and comparative genomics was analyzed. The chloroplast genome was 159,085 bp in length and had a quadripartite structure consisting of two inverted repeats (IRs) separated by a small single copy (SSC) and a large single copy (LSC) region. A total of 133 genes were annotated, including 88 protein-coding genes, eight rRNA genes, and 37 tRNA genes. Among the protein-coding genes, the frequency of the leucine codon is the highest and that of the cysteine codon is the lowest. Comparative genomic analysis showed that the IRS region was more conservative than the LSC and SSC regions, with most sequence variations located in the intergenic spacer rather than the protein-coding region. Moreover, sixteen highly divergent hotspots were identified. The ML phylogenetic tree showed that all involved Celtis species were clustered together, and the plastome reported in this paper has high enough resolution to distinguish C. sinensis (Pers.) from other Celtis plants. This study provides useful genetic resources for the identification of C. sinensis (Pers.) and is also of great significance for the phylogeny study of Celtis plants in the future.
1. Introduction
Celtis is a genus of Cannabaceae plants with about 70 species, mainly distributed in the temperate and tropical regions (Hwang et al. Citation2003). These plants are rich in total fibers, proteins, vitamins, minerals, and phenols, and are commonly used as the source of industrial wood and for the extraction of medicinal substances with antioxidant and antibacterial properties (Ota et al. Citation2017; Shokrzadeh et al. Citation2018; Temiz et al. Citation2021). Although the Celtis species have similar traditional medical functions, their phytochemical composition and efficacy vary by species (El-Alfy et al. Citation2011; Yıldırım et al. Citation2017). Therefore, accurate species identification can facilitate the effective management and development of Celtis plants. However, some species in the genus are difficult to identify due to their highly variable morphological characteristics. For example, leaves from individuals with different states, even if they have the same genotype, may have different shapes, making identification very complicated (Whittemore Citation2008). With the development of DNA sequencing technologies, phylogeny generated by a single or several gene combinations is being replaced by phylogenetic relationships constructed from the whole genome. The cp genome is more conservative in gene structure and composition than mitochondrial and nuclear genomes and is therefore commonly used in population genetics and phylogeny studies (Fan et al. Citation2020). Although several cp genomes of Celtis have been reported (Wang et al. Citation2019a, Citation2019b; Liu et al. Citation2021), the lack of resources for the cp genome of Celtis still hinders our understanding of Celtis species identification and phylogeny.
Celtis sinensis Persoon 1805, commonly known as Chinese hackberry, active ingredients extracted from its leaves and barks have been shown to be effective in treating gastrointestinal diseases and lung abscesses (Wei and Guo Citation2020). It is also often used as folk medicine to treat abdominal pain, urticaria, and eczema (Kim et al. Citation2005). Here, the complete cp genome of C. sinensis (Pers.) was newly assembled and characterized. In addition, a plastome comparative analysis of C. sinensis (Pers.) and its related species was performed. This study provides important information for the molecular identification, phylogeny, and development of genetic markers of C. sinensis (Pers.).
2. Materials and methods
2.1. Plant materials, DNA extraction, and library construction
Fresh leaves of C. sinensis (Pers.) were collected from Chengdu City, Sichuan Province, China (103°59′2″E, 30°45′52″N). A few experimental leaf samples used in this study were all from cultivated materials, permission was not required for sample collection as this tree is a common and non-national protected plant species that is abundantly available in the Chengdu region of China. The samples were also collected without causing harm to the trees themselves and the plant habitat. The voucher specimen was deposited in the plant molecular laboratory of Leshan Normal University (http://www.lsnu.edu.cn/, contact person: Jing Fan, email: [email protected]) under the voucher number CS201911. DNA was extracted by the CTAB method, and the Illumina library was then constructed using total DNA and sequenced by the Illumina NovaSeq 6000 platform.
2.2. Chloroplast genome assembly and annotation
The sequenced raw reads were quality-controlled by NGSQC Toolkit v2.3.3 software (Patel and Jain Citation2012). Subsequently, a total of 19,862,546 high-quality PE150 clean reads were assembled into contigs by SPAdes3.11.0 software, using a k-mer set of 93, 105, 117, and 121 (Bankevich et al. Citation2012). After being annotated by the Plann and GeSeq softwares (Huang and Cronk Citation2015; Tillich et al. Citation2017), the successfully annotated genome was then submitted to the GenBank database, and the annotation file in GenBank format was submitted to OGDRAW to draw the organelle genome map (Lohse et al. Citation2007).
2.3. Condon usage and comparative plastome analysis
Codon usage and amino acid frequency were analyzed using codonW1.4.2 (Peden Citation1999). Expansion and contraction of the IR region were visualized using IRscope software (Amiryousefi et al. Citation2018). The similarity of cp genomes of five Celtis species was compared in Shuffle-LAGAN mode and visualized by mVISTA software (Frazer et al. Citation2004). Nucleotide diversity (pi) was calculated by DnaSP V6.0 software, with a window length of 600 bp and step size of 200 bp (Rozas et al. Citation2017).
2.4. Phylogenetic analysis
To determine the phylogeny of C. sinensis (Pers.), the cp genome of which was compared with 46 plastomes from GenBank using the automatic alignment model in MAFFT 7.037 software (Katoh and Standley Citation2013). The aligned sequences were optimized using Gblocks 0.91 b tools, allowing the gap position parameter to be set to all (Castresana Citation2000). Subsequently, the ML phylogenetic tree was constructed by MEGAX with the following parameters: general time-reversible (GTR) model, gamma-distributed with invariant sites (G + I), partial deletion of gaps/missing data, and 1,000 bootstrap repetitions (Kumar et al. Citation2018).
3. Results
3.1. Plastome features of C. sinensis Persoon
The cp genome of C. sinensis (Pers.) was a 159,085 bp circular quadripartite structure with GC content of 36.32% (GenBank accession number MN877379), in which two inverted repeats (IRA and IRB, 26,894 bp each) were separated by a large single copy (LSC, 86,137 bp) and a small single copy (SSC, 19,160 bp) region. A total of 133 genes were annotated, including 88 protein-coding genes, 37 tRNA genes, and eight rRNA genes. Of these, eight protein-coding genes (ndhB, rpl2, rpl22, rpl23, rps7, rps19, ycf1, ycf2), four rRNA genes (rrn23, rrn16, rrn5, rrn4.5), and seven tRNA genes (trnA-UGC, trnI-CAU, trnI-GAU, trnL-CAA, trnN-GUU, trnR-ACG, trnV-GAC) were duplicated in the IRs region, the rps12 gene was trans-spliced.
3.2. Codon usage analysis
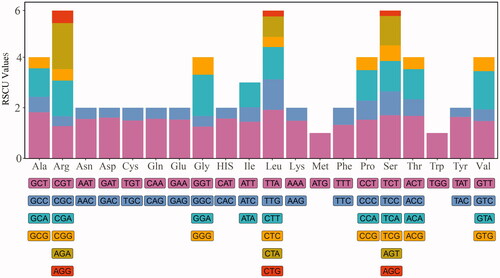
To determine the codon usage patterns in the plastome of C. sinensis (Pers.), the relative synonymous codon usage (RSCU) was calculated using the nucleotide sequences of protein-coding genes. By analyzing 26,761 codons from 85 genes starting with ATG, it was found that leucine codons (Leu) were used the most frequently, accounting for 10.68% of the total codon utilization. We also found that the synonymous codons of leucine include TTA, TTG, CTT, CTC, CTA, and CTG, among which TTA (RSCU = 1.92) was used more frequently than CTC (RSCU = 0.4). However, cysteine codons were the least frequently used in the genome, accounting for only 1.17% of the total frequency. All amino acids except methionine (Met) and tryptophan (Trp) had two or more codons. These results suggest that the cp genome of C. sinensis (Pers.) has a certain codon preference ().
Figure 1. Codon usages in the plastome of Celtis sinensis Persoon. Note: symbols on the abscissa represent 20 amino acids, RSCU values on the ordinate indicate the frequency of codon usage, stacked bars of different colors above the ordinate correspond to codons of the same color below the ordinate.
3.3. Contraction and expansion of IRs
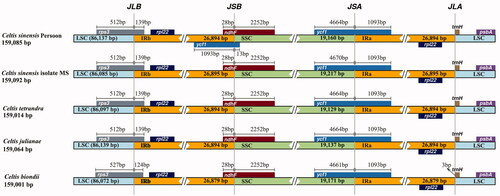
To identify the contraction and expansion of the IR regions, the cp genome of C. sinensis (Pers.) was compared with previously reported four Celtis plastomes. The results showed that the LSC-IRb junction of the five Celtis species was located in the rps3 gene, IRb-SSC junction was located within the ndhF gene, and the ends of IRb region extended into the rps3 gene and ndhF gene, respectively, with lengths of 124–139 and 28 bp. The ycf1 gene spanned the SSC/IRa boundary, and the IRa region extended into the ycf1 gene with a length of 1093 bp. The trnH gene was located near the IRa-LSC boundary. In general, the genes at the IR/SC junction are relatively conserved and share the same gene order, especially in C. sinensis (Pers.), C. tetrandra, and C. julianae. Comparative genome analysis showed that the five species ranged in size from 159,001 bp (C. biondii) to 159,092 bp (C. Sinensis isolated MS), with length differences caused by single copy (SC) regions of different lengths ().
Figure 2. Comparison of the IR/SC boundaries among five Celtis plastomes.
3.4. Comparative plastome analysis of Celtis plants
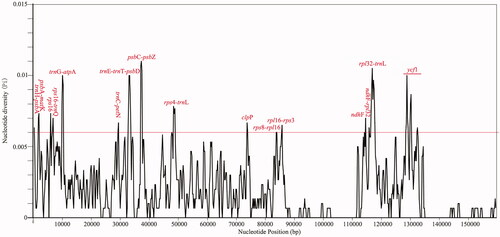
To compare the plastome divergence between Celtis species, a global comparison was performed by mVISTA program, with the cp genome of C. sinensis (Pers.) as the reference. The results showed that most sequence variations were located in LSC and SSC regions, indicating that IR regions were more conservative than the single-copy regions. Further analysis found that the non-coding sequences hold most of the sequence variation sites (). To identify highly divergent hotspots, nucleotide diversity (Pi) values were calculated by DnaSP V6.0 software. Sixteen divergent hotspots with Pi values ≥0.006 were discovered from the cp genome of Celtis, including trnH-psbA, psbA-matK, rps16, rpsl6-trnQ, trnG-atpA, trnC-petN, trnE-trnT-psbD, psbC-psbZ, rps4-trnL, clpP, rps8-rpl16, rpl16-rps3, ndhF, ndhF-rpl32, rpl32-trnL and ycf1 ().
Figure 3. Sequence comparison of the cp genomes of five Celtis plants. Note: the annotation of Celtis sinensis Persoon was selected as the reference, gray arrows indicate the direction and location of each gene, colored regions represent exons, UTR and conservative non-coding regions, vertical scales display the identity ranging from 50 to 100%.
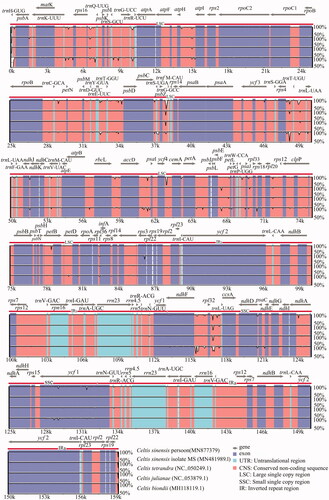
Figure 4. Sliding window test of the cp genomes of five Celtis species. Note: Genes in the divergent hotspots where nucleotide diversity (Pi) exceeds the threshold of 0.006 are highlighted in red.
3.5. Phylogenetic analysis
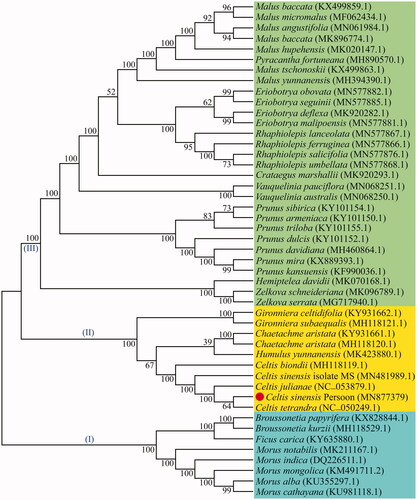
To understand the phylogenetic relationship of C. sinensis (Pers.), a maximum likelihood (ML) phylogenetic tree was constructed from the cp genome of C. sinensis (Pers.) and 46 other species. The ML phylogenetic tree showed that the cp genome reported in this paper can distinguish C. sinensis (Pers.) from other plants at the genomic level. All plants were divided into three clades, among which Celtis plants were clustered together, C. sinensis (Pers.), C. tetrandra, and C. julianae showed a closer relationship ().
Figure 5. The ML phylogenetic tree constructed from 47 chloroplast genomes. Note: Numbers near each node represent bootstrap percentage obtained by 1,000 bootstrap analyses, the symbols (I)–(III) indicate that the phylogenetic tree evolved toward three branches, the GenBank accession numbers are shown in parentheses.
4. Discussion
The genus Celtis is a large group in the Cannabaceae family (Spitaler et al. Citation2009). However, chloroplast genome sequences of many Celtis members have not yet been revealed, the insufficient sequence resources hinder our comprehensive understanding of the phylogeny and species identification of Celtis plants. In this study, a new cp genome sequence was reported and its gene structure and comparative genome were analyzed. Most angiosperms have a quadripartite plastome ranging in size from 115 to 165 kb (Cheng et al. Citation2020). The cp genome of C. sinensis (Pers.) reported in this paper is 159,085 bp in length and contains a quadripartite structure with 133 genes. RSCU statistics is a preferences assessment of synonymous codons in species (Somaratne et al. Citation2019). The codon usage frequency of C. sinensis (Pers.) was calculated using the protein-coding genes with ATG as the starting codon. Statistical analysis showed that all protein-coding genes except methionine and tryptophan contained synonymous codons, among which leucine (Leu) codon had the highest frequency and cysteine (Cys) codon had the lowest frequency. The codon bias (RSCU > 1) was found in 30 codons from C. sinensis (Pers.), and most of them tended to use A/T endings (). A comparison of Celtis plastomes revealed that the gene arrangement at the IR/SC junction was relatively conserved. Our results can be explained that the high conservation of the cp genome leads to the similarity of gene distribution at the SC/IR junction (Zhou et al. Citation2020). In addition, there are some differences in the location of genes, indicating slight expansion and contraction in the IR regions (). Some relevant DNA fragments may also be less similar in closely related individuals, making it necessary to screen for loci with high mutation frequencies (Guo et al. Citation2020). We found that the difference in LSC/SSC region was greater than those in the IR region, and the variation in intergenic spacer was more obvious than that of protein-coding genes (). A total of 16 hypervariable regions suitable for development as molecular markers were detected in this study (). This is consistent with other reports that highly differentiated regions of cp genomes are usually located in the intergenic regions (Zhou et al. Citation2020). Most of the protein-coding genes in the cp genome are quite conservative, but there may be exceptions for some protein genes (Cheng et al. Citation2020). In our study, four protein genes (rps16, clpP, ndhF, and ycf1) showed higher differences in Celtis plants (). In this study, phylogenetic analysis indicated that C. sinensis (Pers.) was closely related to C. tetrandra and C. julianae, all the five Celtis species were clustered together (). This paper provides new cp genome resources for C. sinensis (Pers.) and excavates potential molecular markers, all the above work will be valuable for molecular identification, phylogeny and population genetic research of C. sinensis (Pers.) in the future.
Author contributions
Jing Fan designed and performed experiments, analyzed data, and wrote the manuscript. Yan Chen and MingHua Luo edited, reviewed the manuscript, and formal analysis. Zi Liang analyzed data and proofread the manuscript. Xiang Nong designed experiments, contributed reagents, and analyzed the data. All authors have read and agree to the published version of this manuscript, and all authors are responsible for the contents of this article.
Disclosure statement
The authors acknowledge that there is no conflict of interest in this article.
Data availability statement
The complete chloroplast genome sequence supporting the study is available in GenBank of NCBI at https://www.ncbi.nlm.nih.gov/ under the accession number MN877379. The associated Bio-Project, SRA, and Bio-Sample numbers are PRJNA797578, SRR17630624, and SAMN25014651, respectively.
Additional information
Funding
References
- Amiryousefi A, Hyvonen J, Poczai P. 2018. IRscope: an online program to visualize the junction sites of chloroplast genomes. Bioinformatics. 34(17):3030–3031.
- Bankevich A, Nurk S, Antipov D, Gurevich AA, Dvorkin M, Kulikov AS, Lesin VM, Nikolenko SI, Pham S, Prjibelski AD, et al. 2012. SPAdes: a new genome assembly algorithm and its applications to single-cell sequencing. J Comput Biol. 19(5):455–477.
- Castresana J. 2000. Selection of conserved blocks from multiple alignments for their use in phylogenetic analysis. Mol Biol Evol. 17(4):540–552.
- Cheng Y, Zhang L, Qi J, Zhang L. 2020. Complete chloroplast genome sequence of Hibiscus cannabinus and comparative analysis of the Malvaceae family. Front Genet. 11:227.
- El-Alfy TS, El-Gohary HM, Sokkar NM, Hosny M, Al-Mahdy DA. 2011. A new flavonoid C-glycoside from Celtis australis L. and Celtis occidentalis L. leaves and potential antioxidant and cytotoxic activities. Sci Pharm. 79(4):963–975.
- Fan J, Zhu WY, Li ZF, Zhang XF. 2020. Chloroplast genome sequence of a yellow colored rice (Oryza sativa L.): insight into the genome structure and phylogeny. Mitochondr DNA Part B. 05(03):3650–3652.
- Frazer KA, Pachter L, Poliakov A, Rubin EM, Dubchak I. 2004. VISTA: computational tools for comparative genomics. Nucleic Acids Res. 32(Web Server issue):W273–W279.
- Guo L, Guo S, Xu J, He L, Carlson J, Hou X. 2020. Phylogenetic analysis based on chloroplast genome uncover evolutionary relationship of all the nine species and six cultivars of tree peony. Ind Crops Prod. 153:112567.
- Huang DI, Cronk QC. 2015. Plann: a command-line application for annotating plastome sequences. Appl Plant Sci. 3(8):1500026.
- Hwang BY, Chai HB, Kardono LBS, Riswan S, Farnsworth NR, Cordell GA, Pezzuto JM, Kinghorn AD. 2003. Cytotoxic triterpenes from the twigs of Celtis philippinensis. Phytochemistry. 62(2):197–201.
- Katoh K, Standley DM. 2013. MAFFT multiple sequence alignment software version 7: improvements in performance and usability. Mol Biol Evol. 30(4):772–780.
- Kim DK, Lim JP, Kim JW, Park HW, Eun JS. 2005. Antitumor and antiinflammatory constituents from Celtis sinensis. Arch Pharm Res. 28(1):39–43.
- Kumar S, Stecher G, Li M, Knyaz C, Tamura K. 2018. MEGA X: molecular evolutionary genetics analysis across computing platforms. Mol Biol Evol. 35(6):1547–1549.
- Liu L, Zhang Y, Li P. 2021. Development of genomic resources for the genus Celtis (Cannabaceae) based on genome skimming data. Plant Divers. 43(1):43–53.
- Lohse M, Drechsel O, Bock R. 2007. OrganellarGenomeDRAW (OGDRAW): a tool for the easy generation of high-quality custom graphical maps of plastid and mitochondrial genomes. Curr Genet. 52(5–6):267–274.
- Ota A, Višnjevec AM, Vidrih R, Prgomet Ž, Nečemer M, Hribar J, Cimerman NG, Možina SS, Bučar-Miklavčič M, Ulrih NP. 2017. Nutritional, antioxidative, and antimicrobial analysis of the Mediterranean hackberry (Celtis australis L.). Food Sci Nutr. 5(1):160–170.
- Patel RK, Jain M. 2012. NGS QC toolkit: a toolkit for quality control of next generation sequencing data. PLoS One. 7(2):e30619.
- Peden JF. 1999. Analysis of codon usage [Ph.D. thesis]. University of Nottingham.
- Rozas J, Ferrer-Mata A, Sanchez-DelBarrio JC, Guirao-Rico S, Librado P, Ramos-Onsins S, Sanchez-Gracia A. 2017. DnaSP 6: DNA sequence polymorphism analysis of large data sets. Mol Biol Evol. 34(12):3299–3302.
- Shokrzadeh M, Bakhshi jouybari H, Hosseinpour M, ziar A, Habibi E. 2018. Antioxidant and protective effect of hydroalcoholic extract of Celtis australis L. on CCl4 induced hepatotoxicity. Pharm Biomed Res. 4(3):26–31.
- Somaratne Y, Guan D, Wang W, Zhao L, Xu S. 2019. The complete chloroplast genomes of two Lespedeza species: insights into codon usage bias, RNA editing sites, and phylogenetic relationships in desmodieae (Fabaceae: Papilionoideae). Plants. 9(1):51.
- Spitaler R, Gurschler S, Ellmerer E, Schubert B, Sgarbossa M, Zidorn C. 2009. Flavonoids from Celtis australis (Cannabaceae). Biochem Syst Ecol. 37(2):120–121.
- Temiz MA, Temur A, Akgeyik Y, Uyar A. 2021. Protective effect of Celtis tournefortii against copper-induced toxicity in rat liver. Acta Vet Brno. 90(1):91–98.
- Tillich M, Lehwark P, Pellizzer T, Ulbricht-Jones ES, Fischer A, Bock R, Greiner S. 2017. GeSeq – versatile and accurate annotation of organelle genomes. Nucleic Acids Res. 45(W1):W6–W11.
- Wang Y, Yuan X, Zhang J. 2019b. The complete chloroplast genome sequence of Celtis tetrandra. Mitochondrial DNA B Resour. 4(2):3463–3464.
- Wang G, Zhang Y, Zhou J, Zhang M, Hu Y, Tian Y, Zhou J, Wang Z. 2019a. Characterization of the first complete chloroplast genome sequence of Celtis sinensis (Cannabaceae) and its phylogenetic implications. Mitochondrial DNA B Resour. 4(2):4091–4093.
- Wei Q, Guo W. 2020. Chemical components of volatile oil from leaves and stems of Celtis sinensis Pers. J Essent Oil Bear Plants. 23(4):772–778.
- Whittemore AT. 2008. Exotic species of Celtis (Cannabaceae) in the flora of North America. J Bot Res Inst Texas. 2(1):627–632.
- Yıldırım I, Uğur Y, Kutlu T. 2017. Investigation of antioxidant activity and phytochemical compositions of Celtis tournefortii. FRA. 7(2):160–165.
- Zhou T, Zhu H, Wang J, Xu Y, Xu F, Wang X. 2020. Complete chloroplast genome sequence determination of Rheum species and comparative chloroplast genomics for the members of Rumiceae. Plant Cell Rep. 39(6):811–824.