
Abstract
To date, only one mitogenome from an Antarctic amphipod has been published. Here, novel complete mitochondrial genomes (mitogenomes) of two morphospecies are assembled, namely, Charcotia amundseni and Eusirus giganteus. For the latter species, we have assembled two mitogenomes from different genetic clades of this species. The lengths of Eusirus and Charcotia mitogenomes range from 15,534 to 15,619 base pairs and their mitogenomes are composed of 13 protein coding genes, 22 transfer RNAs, 2 ribosomal RNAs, and 1 putative control region CR. Some tRNAs display aberrant structures suggesting that minimalization is also ongoing in amphipod mitogenomes. The novel mitogenomes of the two Antarctic species have features distinguishing them from other amphipod mitogenomes such as a lower AT-richness in the whole mitogenomes and a negative GC- skew in both strands of protein coding genes. The genetically most variable mitochondrial regions of amphipods are nad6 and atp8, while cox1 shows low nucleotide diversity among closely and more distantly related species. In comparison to the pancrustacean mitochondrial ground pattern, E. giganteus shows a translocation of the nad1 gene, while cytb and nad6 genes are translocated in C. amundseni. Phylogenetic analysis based on mitogenomes illustrates that Eusirus and Charcotia cluster together with other species belonging to the same amphipod superfamilies. In the absence of reference nuclear genomes, mitogenomes can be useful to develop markers for studying population genetics or evolutionary relationships at higher taxonomic levels.
Introduction
Mitogenome DNA sequence data or parts of mitogenomes have been widely used to reconstruct evolutionary relationships or detect cryptic diversity (Caterino et al. Citation2000; Tang et al. Citation2020). For instance, in amphipods, sequencing mitochondrial cox1 or cytb together with nuclear genes (e.g. 18S, 28S, ITS2) has revealed cryptic species of Hyalella S.I. Smith, 1874 (Witt et al. Citation2006), Caprella penantis Leach, 1814 (Pilar Cabezas et al. Citation2013), Gammarus fossarum Koch, 1836 (Grabowski et al. Citation2017) and some Eusirus Krøyer, 1845 species (Baird et al. Citation2011). Molecular data from 13 protein coding genes of Alicella gigantea Chevreux, 1899 (Li et al. Citation2019b), Baikalian amphipods (Romanova et al. Citation2016), Gammarus roeselii Gervais, 1835 (Cormier et al. Citation2018), Halice sp. Boeck, 1871 (Li et al. Citation2019a), Metacrangonyctidae Boutin & Messouli, 1988 (Bauzà-Ribot et al. Citation2012), and from all mitochondrial genes (protein coding genes, rRNA, tRNA) of Gammarus pisinnus Hou, Li & Li, 2014 and Gammarus lacustris G.O. Sars, 1863 (Sun et al. Citation2020) have been used to reconstruct evolutionary relationships. The broad application of molecular data from mitogenomes can be explained by several advantages, which the mitogenome has compared to the nuclear genome. These include its simpler structure, conserved gene content and limited size (Boore Citation1999; Li et al. Citation2019b; Krebes and Bastrop Citation2012) facilitating sequencing of mitogenomes from those species for which reference nuclear genomes are not yet available. The uniparental, usually maternal inheritance of mitogenomes furthermore simplifies analyses because recombination is either totally absent or very rare (Barr et al. Citation2005, Lin and Danforth Citation2004). The relatively high evolutionary rate of mitogenomes generating relative large genetic differences makes mitogenomic DNA sequence data furthermore suitable for studies at the genus or species level investigating population genetic or and phylogeographic patterns (Ballard and Whitlock Citation2004; Krebes and Bastrop Citation2012, Tang et al. Citation2020; Li et al. Citation2019a). The inclusion of whole mitogenomes has resulted in phylogenies with better statistical supports (Haran et al. Citation2013; López-López and Vogler Citation2017) and clearer phylogeographic patterns (Keis et al. Citation2013). Moreover, despite the highly conserved gene content of the mitogenome, gene order has been found to be variable and can provide additional data for reconstructing phylogenetic relationships and evolutionary histories (Cormier et al. Citation2018; Krebes and Bastrop Citation2012; Zhang et al. Citation2020).
Amphipods are widely distributed crustaceans inhabiting a range of different habitats (Väinölä et al. Citation2008; Li et al. Citation2019b). In Antarctica, amphipods are among the most diverse components of the benthic community (Gallardo Citation1987) and show high levels of endemism (Knox and Lowry Citation1977) making them ideal model organisms to study evolutionary patterns and divergences based on mitogenomes. Currently, there is only one published complete mitogenome of an Antarctic amphipod, namely of Gondogeneia antarctica Chevreux, Citation1905 (Shin et al. Citation2012), and no mitogenomes are yet available for abundant amphipods of the genera Eusirus Krøyer, 1845 and Charcotia Chevreux, Citation1905.
In this paper, we have assembled and analyzed complete mitogenomes of three Antarctic amphipods from two morphospecies (Charcotia amundseni d'Udekem d'Acoz, Schön & Robert, 2018 and Eusirus giganteus Andres et al., Citation2002) and two genetic clades of the latter species. Our aims are to (1) provide full mitogenomic data of selected amphipod species for future research and (2) compare gene content and order with published amphipod mitogenomes to unravel shared and unique patterns of mitogenome evolution in amphipods.
Materials and methods
Sample collection
Specimens of two species of Antarctic amphipods, Charcotia amundseni d'Udekem d'Acoz, Schön & Robert, 2018 and two genetic clades of Eusirus giganteus Andres et al., Citation2002 (G1 and G2; which might resemble different genetic species (Verheye and D’Udekem D’Acoz Citation2021) have been collected during different Antarctic expeditions () and are curated in the collections of the Royal Belgian Institute of Natural Sciences, Brussels, Belgium.
Table 1. Sampling details of specimens analyzed in this study, including date of sample, expedition, locality, geographical coordinates, voucher ID provided by Royal Belgian Institute of Natural Sciences (RBINS), and gear used during sampling.
Eusirus amphipods belong to the superfamily Eusiroidea Stebbing, 1888. Eusirus cf. giganteus has previously been confused with Eusirus perdentatus Chevreux, 1912 due to small morphological differences (Andres et al. Citation2002). The genetic study of Baird et al. (Citation2011) reveals cryptic diversity of Eusirus giganteus including the so-called clades G1–G4, and the existence of a species complex is supported by Verheye and D’Udekem D’Acoz (Citation2021). The same authors report that potential Eusirus giganteus species that still need to be formally described showed at least minor morphological differences and different color morphs but that a thorough morphological analysis of the putative genetic species is still required. Given the possibility of multiple cryptic species, we follow here the suggestion of Greco et al. (Citation2021) to use the name Eusirus cf. giganteus in our study. Our other target species, Charcotia amundseni, belongs to the superfamily Lysianassoidea Dana, 1849. The genus Charcotia has formerly been known as Waldeckia (Chevreux Citation1905) but recently has undergone a change in nomenclature (D’Udekem D’Acoz et al. Citation2018) which we follow here.
Mitochondrial genome sequencing, assembly, annotation, and analyses
DNA has been extracted from a pleopod of each specimen using the DNeasy Blood & Tissue Kit (Qiagen, Germany) for both Eusirus cf. giganteus clades and the Qiamp DNA Minikit (Qiagen, Germany) for Charcotia amundseni following the manufacturer’s protocol. DNA concentration and quality have been checked with a Nanodrop ND-1000 Spectrophotometer (ThermoFisher Scientific, USA) and a Qubit 2.0 fluorometer (Life Technologies, USA).
A low coverage skimming sequencing approach has been applied at the Genomics Core at the KU Leuven (Leuven, Belgium) using an Illumina HiSeq2500 sequencing platform in the 2 × 125 bp mode. Samples were indexed separately as unique libraries. Reads have been quality-checked using FASTQC (Andrews Citation2010) and pre-processed with Geneious Prime 2019 v1.8.0 (https://www.geneious.com) by merging paired reads, removing duplicates and trimming of low-quality ends using the BBDuk trimmer in Geneious with the minimum quality set to 20. These pre-processed reads have then been used for de novo assemblies in MITObim v1.9.1 (Hahn et al. Citation2013) with the MIRA 4.0.2 (Chevreux et al. Citation1999) assembler with default settings (kmer size = 31) and an iteration limit of 100. The Onisimus nanseni G.O. Sars, 1900 mitogenome (GenBank accession number FJ555185.1) which belongs to the same superfamily as Charcotia and a partial 16S to COI sequence of Eusirus perdentatus have been used as seed references. The longest resulting contigs from the de novo assembly have been imported into Geneious and further assembled with the ‘map to reference’ approach with medium–low sensitivity and 50 iterations. Identity of the resulting consensus sequences have been verified with BLAST searches (Altschul et al. Citation1997). Automatic annotation has subsequently been conducted with the MITOS web server, versions 1 and 2 (Bernt et al. Citation2013). The identity of the rrnL region of both Eusirus species has been confirmed by BLAST searches only, since it has not been annotated by MITOS. The resulting annotations have been viewed and gene boundaries manually corrected in Geneious. The boundaries of the 13 protein coding genes and 2 rRNA genes have been identified by comparing alignments of the novel assemblies with mitochondrial genes of other amphipod species. Protein coding genes boundaries have been further corrected by avoiding any overlap with the subsequent tRNA gene and by noticing any partial stop codons (T or TA). Such partial stop codons are atypical features of mitochondrial protein coding genes (Cameron Citation2014). Transfer RNA (tRNA) genes and their secondary structures have been predicted with MitFI (Jühling et al. Citation2012) in the MITOS pipeline and further verified with ARWEN 1.2.3 (Laslett and Canbäck Citation2008). Potential control regions (CRs) have been identified from their typical features such as high AT content, poly-T stretches, and hairpin structures (Zhang and Hewitt Citation1997).
Gene orders of the novel mitogenome assemblies were compared to the putative pancrustacean ground pattern which is derived from both Crustacea and Hexapoda (often referred to as pancrustacea) as they share the same ground pattern in terms of their mitochondrial gene order (Kilpert and Podsiadlowski Citation2006; Boore et al. Citation1998). Possible gene rearrangements have been analyzed with the CREx web service (Bernt et al. Citation2007). CREx utilizes a strong common interval tree to heuristically deduce the plausible rearrangement scenarios to change one gene order to another (Bernt et al. Citation2007). AT and GC skew have been calculated using the formulas of Perna and Kocher (Citation1995): AT skew = [A − T]/[A + T] and GC skew = [G − C]/[G + C]. Only other amphipod species with complete and published mitogenomes have been analyzed for their AT and GC skew (Supplementary Table 1). Nucleotide diversity (π) has been computed for each protein coding gene with DnaSP v6.12.03 (Rozas et al. Citation2017).
To verify the phylogenetic position of the studied species, the three novel and assembled mitogenomes were supplemented with data from other amphipod species for phylogenetic reconstructions. Published amino acid sequences of 13 protein coding genes were obtained from GenBank and aligned separately for each gene using MAFFT v7.0 online (Katoh et al. Citation2019), together with the amino acid sequences of the current study. The resulting alignments were concatenated with Geneious Prime 2019 v1.8.0 (https://www.geneious.com) and trimmed with Bioedit v7.2.5 (Hall Citation1999) with additional checking by eye. The MtArt + G + F was chosen as the best fitting model of molecular evolution as identified with ModelGenerator v0.85 (Keane et al. Citation2006) using four discrete categories for gamma distribution. Phylogenetic analyses based on maximum likelihood methods were carried out using PhyML v3.0 (Guindon and Gascuel Citation2003) with 1000 bootstrap replications. Bayesian inference was conducted with MrBayes v3.2.7 (Ronquist and Huelsenbeck Citation2003) with 1 million generations, tree sampling every 1000th generation, and 10% of the initial trees being discarded as burn-in.
Results
Mitogenome organization
The total length of the obtained complete mitochondrial genomes of Eusirus cf. giganteus (G1), Eusirus cf. giganteus (G2), and Charcotia amundseni is 15,558, 15,534, and 15,619 bp, respectively (Genbank accession nos. OK489458, OK489459, OK489457, respectively) which is within the range of complete mitogenomes from other amphipods (13,517–18,424 bp) (). The three newly assembled mitogenomes are each composed of 13 protein coding genes, 22 tRNAs and 2 rRNAs. For E. cf. giganteus, 23 genes are encoded on the positive (+) strand and 14 on the negative (–) strand while 17 genes are encoded on the + strand and 20 on the – strand in C. amundseni (Supplementary Figure 1a and b, Supplementary Table 2). A putative control region (CR) has also be identified in all three mitogenomes and is located between trnS2 and rrnL in Eusirus and between trnF and nad5 in C. amundseni. The mitogenome also contains 20 intergenic regions for E. cf. giganteus and 18 intergenic regions for C. amundseni. The whole mitogenomes of the two species show AT-richness of 61.9% for E. cf. giganteus and 68.7% for C. amundseni, respectively, which contributes to the positive AT skew (0.008 to 0.092) and negative GC skew (−0.317 to −0.201) values observed in the three mitogenomes (). A relatively high AT content is also observed in the complete mitogenomes of other amphipod species varying from 61.09 to 77% ().
Table 2. Gene lengths, AT content, and AT and GC skews of E. cf. giganteus (G1), E. cf. giganteus (G2) and C. amundseni and 40 other amphipod species with complete, published mitogenomes (for details of the analyzed species, see Supplementary Table 1).
Gene order and rearrangements
A translocation of nad1 gene in E. cf. giganteus is observed while cytb and nad6 are translocated in C. amundseni as compared to the pancrustacean ground pattern (Supplementary Figure 2). We furthermore also find shifts in the position of tRNAs and the control region in E. cf. giganteus and C. amundseni as compared to the pancrustacean ground pattern (Supplementary Figure 2). While also trnG has been translocated in the three species investigated here, we find other tRNA gene strings consisting of trnA, trnS1, trnR, trnN, and trnE for E. cf. giganteus and trnS1, trnN, trnE, and trnF for C. amunseni (Supplementary Figure 2). Similar with the pancrustacean ground pattern, the trnV is located between the rrnL and rrnA genes in E. cf. giganteus while trnC and trnV are inserted between these genes in C. amundseni (Supplementary Figure 2).
Results of the CREx analyses indicate that E. cf. giganteus and C. amundseni have undergone multiple transpositions and rearrangements relative to the pancrustacean ground pattern (Supplementary Figure 3b).
Protein coding genes
The most frequent start codon in E. cf. giganteus and C. amundseni is ATG (Supplementary Table 2). Defining the protein coding gene boundaries following a tRNA results in a few partial or incomplete stop codons (T or TA). The AT content of the protein coding genes of the three amphipod mitogenomes is estimated as 59.6% for E. cf. giganteus (G1 and G2) and 67.3% for C. amundseni (). Mitochondrial genomes of the two species in this study have negative GC skew values in the protein coding genes encoded on both strands (Supplementary Table 4). The highest AT content is found in the third codon position of C. amundseni and the second codon position of E. cf. giganteus while the lowest AT content is observed in the first codon position in all three species. (Supplementary Table 3).
Ribosomal RNA
The two ribosomal RNA (rrnS and rrnL) genes in the three mitogenomes are located on the negative (−) strand. In the two Eusirus species, the length of both RNAs is 681 bp and 871 bp, respectively (Supplementary Table 2). Unlike in E. cf. giganteus, the two mitochondrial rRNAs of C. amundseni are shorter (529 bp and 739 bp) (Supplementary Table 2). The mitochondrial rRNA genes of the two amphipod species in this study also show a high AT content with 69.7% for E. cf. giganteus (G1 and G2) and 70.8% for C. amundseni.
Transfer RNA
In the three mitogenomes of this study, 22 tRNAs are present with a length ranging from 52 to 67 base pairs (Supplementary Table 2). The AT content of tRNAs of E. cf. giganteus is 66.2% and 69.9% for C. amundseni (). In E. cf. giganteus, 14 tRNAs are encoded in the + strand and 8 in the − strand. In C. amundseni 10 tRNAs are encoded in the + and 12 in the − strand. Typical clover leaf secondary structures are observed in most predicted tRNAs although some tRNAs show wobble base pairs, atypical pairing or the DHU and TΨC arm are missing (Supplementary Figure 4a–c). More specifically, the DHU arm is missing in trnS1, trnS2 and trnV of E. cf. giganteus (Supplementary Figure 4a and b) and trnS1, trnS2, and trnI of C. amundseni (Supplementary Figure 4c). We also find that the TΨC loop is absent in trnK, trnD, trnN, trnM, trnS2, trnI, and trnQ of E. cf. giganteus (Supplementary Figure 4a and b) and in trnD, trnH, trnL1, trnC, trnV, trnQ, trnK, and trnM of C. amundseni (Supplementary Figure 4c).
Nucleotide diversity
When estimating nucleotide diversity (π) between the two Eusirus genetic clades, we observe high values for nad6 (0.013), nad5 (0.012), and nad1 (0.011) (Supplementary Figure 5a) and low ones for nad4 (0.002), nad3 (0.003), nad2 (0.004), and cox1 (0.005) with nad4 (0.002) being the least variable. We also find high variability in nad6 (0.569), atp8 (0.566), and nad2 (0.515) between C. amundseni and E. cf. giganteus (G1) and low variability in cox1 (0.279), cytb (0.328), and cox3 (0.342) (Supplementary Figure 5b). Moreover, between C. amundseni and E. cf. giganteus (G2), high variability is observed in nad6 (0.567), atp8 (0.560), and nad2 (0.515), while the lowest variability is found in cox1 (0.28), cytb (0.327), and cox3 (0.343) (Supplementary Figure 5b).
Phylogenetic analysis
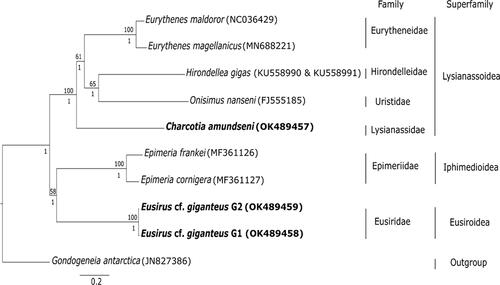
Phylogenetic analysis revealed that the phylogenetic grouping follows the superfamily identity and fall under different family groups (). The two genetic clades of Eusirus cf. giganteus G1 and G2 under family Eusiridae, cluster together. They belong to the superfamily Eusiroidea and are found to be closely related to both Epimeria frankei Beermann & Raupach, 2018 in Beerman, Westbury, Hofreiter, Hilgers, Deister, Neumann & Raupach, 2018 and Epimeria cornigera Fabricius, 1779 (family Epimeriidae Boeck, 1871) from the Iphimedioidea Boeck, 1871 superfamily. Similarly, Charcotia amundseni from family Lysianassidae Dana, 1849 is clustering together with Eurythenes magellanicus H. Milne Edwards, 1848 and Eurythenes maldoror d'Udekem d'Acoz & Havermans, 2015 (family Eurytheneidae Stoddart & Lowry, 2004), Hirondellea gigas Birstein & Vinogradov, 1955 (family Hirondelleidae Lowry & Stoddart, 2010), and Onisimus nanseni G.O. Sars, 1900 (family Uristidae Hurley, 1963) and all belonging to the superfamily Lysianassoidea.
Figure 1. Phylogenetic tree based on the concatenated 13 protein coding genes amino acid alignment using maximum likelihood and Bayesian methods. Only bootstrap values of ≥50 (above the nodes) and posterior probabilities >0.80 (below the nodes) are shown. Scale bar corresponds to the number of substitutions per site. Target species of the current study are indicated in bold. The Genbank accession numbers for the mitochondrial genomes are shown in the parenthesis.
Discussion
In the current study, we have assembled and annotated novel complete mitogenomes from two Antarctic amphipod species with a low coverage skimming sequencing approach. We have obtained very low percentages of ambiguities (<0.01%) illustrating that this cost efficient approach is very successful. Besides our study, only two complete mitogenomes from amphipods of the polar regions are currently available, namely, from Gondogeneia antarctica Chevreux Citation1905 from Antarctica (Shin et al. Citation2012) and Onisimus nanseni G.O. Sars, 1900 from the Arctic (Ki et al. Citation2010). Our study thus provides important novel genomic data for further research and the first complete mitogenomes of the widely spread amphipod genera Eusirus and Charcotia. Our comparisons of mitogenomes between two genetic clades, possibly resembling two different genetic species of E. cf. giganteus illustrate that mitogenomic features such as length, gene order, AT content, and tRNA structure are similar at the intraspecific level (, Supplementary Figure 1, Supplementary Figure 2; Supplementary Table 3, Supplementary Figure 4a and b).
All three newly obtained mitogenomes are with 15,534 and 15,619 bp at the middle range of reported lengths of published amphipod mitogenomes (14,113bp to 18,424 bp) (Romanova et al. Citation2016; Li et al. Citation2019b). The observed AT-richness of the mitogenomes of the current study (61.9% and 68.7%) is slightly lower than in other studies based on complete () and incomplete amphipod mitogenomes where AT range between 69.79% and 74.35% (Li et al. Citation2019a). However our data are in line with Wilson et al. (Citation2000) reporting such an AT-rich bias as typical for arthropods.
The negative GC skews on both strands of the protein coding genes of the two species in this study differ from the so far known common Malacostraca pattern where genes encoded on the + strand usually exhibit negative and genes encoded on the − strand positive GC skews (Hassanin Citation2006). The strand bias in nucleotide composition of metazoan mitogenomes is attributed to varying mutational pressure during replication or transcription (Pons et al. Citation2014; Hassanin et al. Citation2005). Future research will need to test if these factors are responsible for the different GC patterns observed in the two Antarctic amphipod species of the current study.
Gene order and rearrangements
The translocations of trnG and a commonly derived pattern of a gene string consisting of trnA, trnS1, trnN, trnE, and trnR are presumed to be apomorphic features of certain amphipods (Kilpert and Podsiadlowski Citation2010; Krebes and Bastrop Citation2012; Li et al. Citation2019a). The two studied species exhibit the translocation of trnG relative to the pancrustacean ground pattern. However, the altered tRNA gene order of the two species results in a unique tRNA string that is dissimilar to the apomorphic gene string of trnA, trnS1, trnN, trnE, and trnR. Moreover, the observed rrnL-trnV-rrnS pattern of E. cf. giganteus is known to be common in most Malacostraca (Ki et al. Citation2010) and is also observed in the pancrustacean ground pattern. This is, however, not the case for C. amundseni with the trnC being present. In addition, the large-scale gene reversals that have been found in three species have also been observed in Halice sp. Boeck, 1871 (Li et al. Citation2019a). It may be attributed to intramitochondrial recombination allowing breaking and rejoining of the mitochondrial genome (Dowton and Austin Citation1999; Li et al. Citation2019a).
rRNA genes
The shortest complete rrnL in amphipods of 577 bp is currently known from Hirondellea gigas Birstein & Vinogradov, 1955 (Lan et al. Citation2016), which is much shorter than the rrnL that has been found in the species of the current study. On the other hand, the rrnS of C. amundseni has with 529 bp the same length as Alicella gigantea (Li et al. Citation2019b) which has so far been the shortest reported rrnS length in amphipods. Also, the shortest total length of rrnL and rrnS together has been described from the amphipod Hirondellea gigas Birstein & Vinogradov, 1955 (Lan et al. Citation2016) with 1120 bp, and we find that the total length of the two rRNAs in C. amundseni is with 1268 bp rather similar. Short rRNA genes have also been observed in Gammarus duebeni Lilljeborg, 1852 (Krebes and Bastrop Citation2012) where they have been attributed to a minimization strategy of the mitogenome.
tRNA secondary structures
Aberrant tRNA structures as we find them in the three novel mitogenomes are common. Jühling et al. (Citation2012) have described a loss of a D-domain in trnS1 in almost all metazoan, while the D-domain in trnS2 has only been lacking in Lophotrochozoa and Ecdysozoa. Mitogenome studies of other amphipod species also report the lack of the DHU arm in trnS1 and trnS2 in Epimeria cornigera Fabricius, 1779, Epimeria frankei Beermann & Raupach, 2018 in Beerman, Westbury, Hofreiter, Hilgers, Deister, Neumann & Raupach, 2018 (Beermann et al. Citation2018), Caprella scaura Templeton, 1836 (Ito et al. Citation2010) and ‘Metacrangonyx boveii’ (Pons et al. Citation2014) and in trnV in Brachyuropus grewingkii Dybowsky, 1874, Acanthogammarus victorii Dybowsky, 1874, Eulimnogammarus cyaneus Dybowsky, 1874, and Garjajewia cabanisii Dybowsky, 1874 (Romanova et al. Citation2016), Halice sp. Boeck, 1871 (Li et al. Citation2019a) and ‘Metacrangonyx boveii’ (Pons et al. Citation2014). The absence of the TΨC loop is another aberrant and common structure in amphipod that has also been observed in trnC, trnE, and trnT of Caprella mutica Schurin, 1935 (Kilpert and Podsiadlowski Citation2010), trnQ and trnV of Gammarus duebeni Lilljeborg, 1852 (Krebes and Bastrop Citation2012), and trnC, trnQ, trnK, and trnF of Onisimus nanseni G.O. Sars, 1900 (Ki et al. Citation2010). The pressure for minimization of the mitogenome has been put forward as one of the explanations for these aberrant tRNA structures (Yamazaki et al. Citation1997). Other explanations could be replication slippage resulting in sequence deletions or insertions (Macey et al. Citation1997). Despite these aberrant structures in tRNAs, these are most likely still functional (Watanabe et al. Citation2014).
Nucleotide diversity
Information on nucleotide diversity can be helpful for the design of new molecular markers (Romanova et al. Citation2016; Zhang et al. Citation2018). Here, we have shown that the most variable mitogenes of Eusirus for intraspecific comparisons between genetic clades are nad6, nad5, and nad1 while for comparisons between Eusirus and Charcotia, atp8, nad6, and nad2 are most variable, which could be suitable for future phylogeographic and population genetic studies. Contrary, the least variable mitogenes for Eusirus are nad4, nad3, nad2, and cox1 and for interspecies comparisons between Eusirus and Charcotia cox1, cytb, and cox3 could be more suitable for future deep phylogeny investigations. Surprisingly, despite its wide use in DNA barcoding initiatives (Witt et al. Citation2006; Hebert et al. Citation2003), the cox1 gene appears to have relatively low nucleotide diversities between closely and distantly related amphipods. Consistent with our results, also Romanova et al. (Citation2016) describe the mitogenes atp8, nad2, nad4l, nad5, and nad6 as most variable in Baikalian amphipods and cox genes to be less variable, with cox1 having the lowest nucleotide diversity.
Phylogenetic analysis
Our evolutionary tree () constructed from mitochondrial protein coding genes is well supported and shows phylogenetic clades according to amphipod superfamily identity. Moreover, our results are congruent to the current taxonomic classification where the species were categorized into their respective family and superfamily (Horton et al. Citation2021). Previous classification have placed Eusirus in the same Eusiroidea superfamily as Epimeria (Bousfield Citation1978) while the recent classification have placed Eusirus under superfamily Eusiroidea and Epimeria under Iphimedioidea (Lowry and Myers Citation2017). Phylogenetic evidence using 18S rDNA have shown that Eusirus has a close relationship with Epimeria which showed a well-supported clade of Eusiridae, Calliopiidae, Astyridae, Iphimediidae, Epimeriidae, and Pleustidae families (Englisch Citation2001). Phylogenetic evidence using 13-protein coding genes further corroborates these close relationships ().
Our grouping of Charcotia amundseni with other species from the superfamily Lysianassoidea () is supported with the morphological phylogeny of Lowry and Myers (Citation2017), which characterized this superfamily as often having a type 3 lysianassoid calceolus and a cleft telson. Molecular phylogenetic analyses using concatenated 16S-COX1-18S data in Ritchie et al. (Citation2015) show clustering of families and superfamilies similar to our study which further backs up our results. The phylogenetic grouping of the two morphospecies invested here based on the three novel mitogenomes thus follow the expected patterns according to taxonomic relationships.
Conclusions
The current study provides three additional novel complete mitogenomes of Antarctic amphipod species and the first complete mitogenomes of the abundant amphipod genera Eusirus and Charcotia. In comparison to other published amphipod mitogenomes, the novel mitogenomes show distinct features such as a lower AT-richness in their whole mitogenomes, negative GC skews on both strands of the protein coding genes, and unique gene rearrangements. The novel mitogenomes also share characteristics with other amphipod mitogenomes including aberrant tRNA and short rRNA genes, which could be linked to minimalization of mitogenomes. Moreover, the estimation of the nucleotide diversity (π) provides information to choose mitogenes as most suitable markers for future phylogenetic studies of amphipods. The novel mitogenomes are certainly useful for future phylogenetic analyses as put the investigated species into phylogenetic positions matching superfamily and family identity.
Ethics statement
This study did not require any ethical approval from the University of Hasselt, Belgium.
Author contributions
Molecular analyses (LS and TP), analysis and interpretation of the data (LS, IS, and TP), and writing of this manuscript (LS, TP, BF, GL, MK, and IS). All authors agree to be accountable for all aspects of the work.
Supplemental Material
Download MS Word (1.6 MB)Acknowledgements
The authors are grateful to the Royal Belgian Institute of Natural Sciences, Belgium, and the National Museum of Natural History, Paris, for providing the samples used in this study. Also, the authors are also greatly indebted to Marie Verheye (University of Liege, Belgium) and Cédric d'Udekem d'Acoz (Royal Belgian Institute of Natural Sciences, Belgium) for providing suggestions for this manuscript. Lastly, the Genomics Core in KU Leuven is acknowledged for conducting the high throughput sequencing.
Disclosure statement
No potential conflict of interest was reported by the author(s).
Data availability statement
The genome sequence data that support the findings of this study are openly available in GenBank of NCBI at https://www.ncbi.nlm.nih.gov/ under the accession numbers Eusirus cf. giganteus (G1) (OK489458), Eusirus cf. giganteus (G2) (OK489459), and Charcotia amundseni (OK489457). The associated Bioproject is PRJNA769065 and the Biosample numbers are Eusirus cf. giganteus (G1) (SAMN22086850), Eusirus cf. giganteus (G2) (SAMN22087742), and Charcotia amundseni (SAMN22087745). The SRA accession numbers are Eusirus cf. giganteus (G1) (SRX13936485), Eusirus cf. giganteus (G2) (SRX13936486), and Charcotia amundseni (SRX13936484).
Additional information
Funding
References
- Altschul SF, Madden TL, Schäffer AA, Zhang J, Zhang Z, Miller W, Lipman DJ. 1997. 366Gapped BLAST and PSI-BLAST: a new generation of protein database search programs. Nucleic Acids Res. 25(17):810–3402.
- Andres HG, Lörz AN, Brandt A. 2002. A common but undescribed huge species of Eusirus Krøyer, 1845 (Crustacea, Amphipoda, Eusiridae) from Antarctica. Mitteilungen Aus Dem Hamburgischen Zoologischen Museum Und Institut. 99:109–126.
- Andrews S. 2010. FastQC: a quality control tool for high throughput sequence data [Online]. [cited 2019 July 28] http://www.bioinformatics.babraham.ac.uk/projects/fastqc/.
- Baird HP, Miller KJ, Stark JS. 2011. Evidence of hidden biodiversity, ongoing speciation and diverse patterns of genetic structure in giant Antarctic amphipods. Mol Ecol. 20(16):3439–3454.
- Ballard JWO, Whitlock MC. 2004. The incomplete natural history of mitochondria. Mol Ecol. 13(4):729–744.
- Barr CM, Neiman M, Taylor DR. 2005. Inheritance and recombination of mitochondrial genomes in plants, fungi and animals. New Phytol. 168(1):39–50.
- Bauzà-Ribot MM, Juan C, Nardi F, Oromí P, Pons J, Jaume D. 2012. Mitogenomic phylogenetic analysis supports continental-scale vicariance in subterranean thalassoid crustaceans. Curr Biol. 22(21):2069–2074.
- Beermann J, Westbury MV, Hofreiter M, Hilgers L, Deister F, Neumann H, Raupach MJ. 2018. Cryptic species in a well-known habitat: applying taxonomics to the amphipod genus Epimeria (Crustacea, Peracarida). Sci Rep. 8(1):1–26.
- Bernt M, Donath A, Jühling F, Externbrink F, Florentz C, Fritzsch G, Pütz J, Middendorf M, Stadler PF. 2013. MITOS: improved de novo metazoan mitochondrial genome annotation. Mol Phylogenet Evol. 69(2):313–319.
- Bernt M, Merkle D, Ramsch K, Fritzsch G, Perseke M, Bernhard D, Schlegel M, Stadler PF, Middendorf M. 2007. CREx: inferring genomic rearrangements based on common intervals. Bioinformatics. 23(21):2957–2958.
- Boore JL. 1999. Animal mitochondrial genomes. Nucleic Acids Res. 27(8):1767–1780.
- Boore JL, Lavrov DV, Brown WM. 1998. Gene translocation links insects and crustaceans. Nature. 392(6677):667–668.
- Bousfield EL. 1978. A revised classification and phylogeny of amphipod crustaceans. Ottawa: Royal Society of Canada.
- Cameron SL. 2014. How to sequence and annotate insect mitochondrial genomes for systematic and comparative genomics research. Syst Entomol. 39(3):400–411.
- Caterino MS, Cho S, Sperling FA. 2000. The current state of insect molecular systematics: a thriving Tower of Babel. Annu Rev Entomol. 45(1):1–54.
- Chevreux B, Wetter T, Suhai S. 1999. Genome sequence assembly using trace signals and additional sequence information. Computer Science and Biology: Proceedings of the German Conference on Bioinformatics (GCB 1999), Vol. 99, p. 45–56.
- Chevreux E. 1905. Diagnoses d’amphipodes nouveaux provenant de l’expédition antarctique du Français. I. Lysianassidae. Bull Soc Zool Fr. 30:159–165.
- Cormier A, Wattier R, Teixeira M, Rigaud T, Cordaux R. 2018. The complete mitochondrial genome of Gammarus roeselii (Crustacea, Amphipoda): insights into mitogenome plasticity and evolution. Hydrobiologia. 825(1):197–210.
- Dowton M, Austin AD. 1999. Evolutionary dynamics of a mitochondrial rearrangement “hot spot” in the Hymenoptera. Mol Biol Evol. 16(2):298–309.
- D’Udekem D’Acoz C, Schon I, Robert H. 2018. The genus Charcotia Chevreux, 1906 in the Southern Ocean, with the description of a new species (Crustacea, Amphipoda, Lysianassoidea). Belg J Zool. 148(1):31–82.
- Englisch U. 2001. Analyse der Phylogenie der Amphipoda (Crustacea, Malacostraca) mit Hilfe von Sequenzen des Gens der RNA der kleinen ribosomalen Untereinheit [dissertation]. Bochum: Ruhr-Universität Bochum, Lehrstuhl für Spezielle Zoologie 1–312.
- Gallardo VA. 1987. The sublittoral macrofaunal benthos of the Antarctic shelf. Environ Int. 13(1):71–81.
- Grabowski M, Mamos T, Bącela-Spychalska K, Rewicz T, Wattier RA. 2017. Neogene paleogeography provides context for understanding the origin and spatial distribution of cryptic diversity in a widespread Balkan freshwater amphipod. PeerJ. 5:e3016.
- Greco S, D'Agostino E, Manfrin C, Gaetano AS, Furlanis G, Capanni F, Santovito G, Edomi P, Giulianini PG, Gerdol M. 2021. RNA-sequencing indicates high hemocyanin expression as a key strategy for cold adaptation in the Antarctic amphipod Eusirus cf. giganteus Clade g3. Biocell 45(6):1611.
- Guindon S, Gascuel O. 2003. A simple, fast, and accurate algorithm to estimate large phylogenies by maximum likelihood. Syst Biol. 52(5):696–704.
- Hahn C, Bachmann L, Chevreux B. 2013. Reconstructing mitochondrial genomes directly from genomic next-generation sequencing reads–a baiting and iterative mapping approach. Nucleic Acids Res. 41(13):e129–e129.
- Hall TA. 1999. BioEdit: a user-friendly biological sequence alignment editor and analysis program for Windows 95/98/NT. Nucl Acids Symp Ser. 41:95–98.
- Haran J, Timmermans MJ, Vogler AP. 2013. Mitogenome sequences stabilize the phylogenetics of weevils (Curculionoidea) and establish the monophyly of larval ectophagy. Mol Phylogenet Evol. 67(1):156–166.
- Hassanin A. 2006. Phylogeny of Arthropoda inferred from mitochondrial sequences: strategies for limiting the misleading effects of multiple changes in pattern and rates of substitution. Mol Phylogenet Evol. 38(1):100–116.
- Hassanin A, Leger Nelly, Deutsch J. 2005. Evidence for multiple reversals of asymmetric mutational constraints during the evolution of the mitochondrial genome of Metazoa, and consequences for phylogenetic inferences. Syst Biol. 54(2):277–298.
- Hebert PD, Cywinska A, Ball SL, DeWaard JR. 2003. Biological identifications through DNA barcodes. Proc R Soc Lond B. 270(1512):313–321.
- Horton T, Lowry J, De Broyer C, Bellan-Santini D, Coleman CO, Corbari L, Costello MJ, Daneliya M, Dauvin J-C, Fišer C, et al. 2021. World Amphipoda Database. [accessed 2021 Nov 23]. http://www.marinespecies.org/amphipoda.
- Ito A, Aoki MN, Yokobori SI, Wada H. 2010. The complete mitochondrial genome of Caprella scaura (Crustacea, Amphipoda, Caprellidea), with emphasis on the unique gene order pattern and duplicated control region. Mitochondrial DNA. 21(5):183–190.
- Jühling F, Pütz J, Bernt M, Donath A, Middendorf M, Florentz C, Stadler PF. 2012. Improved systematic tRNA gene annotation allows new insights into the evolution of mitochondrial tRNA structures and into the mechanisms of mitochondrial genome rearrangements. Nucleic Acids Res. 40(7):2833–2845.
- Katoh K, Rozewicki J, Yamada KD. 2019. MAFFT online service: multiple sequence alignment, interactive sequence choice and visualization. Brief Bioinform. 20(4):1160–1166.
- Keane TM, Creevey CJ, Pentony MM, Naughton TJ, Mclnerney JO. 2006. Assessment of methods for amino acid matrix selection and their use on empirical data shows that ad hoc assumptions for choice of matrix are not justified. BMC Evol Biol. 6(1):29.
- Keis M, Remm J, Ho SYW, Davison J, Tammeleht E, Tumanov IL, Saveljev AP, Männil P, Kojola I, Abramov AV. 2013. Complete mitochondrial genomes and a novel spatial genetic method reveal cryptic phylogeographical structure and migration patterns among brown bears in north‐western Eurasia. J Biogeogr. 40(5):915–927.
- Ki JS, Hop H, Kim SJ, Kim IC, Park HG, Lee JS. 2010. Complete mitochondrial genome sequence of the Arctic gammarid, Onisimus nanseni (Crustacea; Amphipoda): novel gene structures and unusual control region features. Comp Biochem Physiol Part D Genomics Proteomics. 5(2):105–115.
- Kilpert F, Podsiadlowski L. 2006. The complete mitochondrial genome of the common sea slater, Ligia oceanica (Crustacea, Isopoda) bears a novel gene order and unusual control region features. BMC Genomics. 7(1):1–18.
- Kilpert F, Podsiadlowski L. 2010. The mitochondrial genome of the Japanese skeleton shrimp Caprella mutica (Amphipoda: Caprellidea) reveals a unique gene order and shared apomorphic translocations with Gammaridea. Mitochondrial DNA. 21(3-4):77–86.
- Knox GA, Lowry JK. 1977. A comparison between the benthos of the Southern Ocean and the North Polar Ocean with special reference to the Amphipoda and the Polychaeta. Polar oceans. Calgary: Arctic Institute of North America; p. 423–462.
- Krebes L, Bastrop R. 2012. The mitogenome of Gammarus duebeni (Crustacea Amphipoda): a new gene order and non-neutral sequence evolution of tandem repeats in the control region. Comp Biochem Physiol D Genomics Proteomics. 7(2):201–211.
- Lan Y, Sun J, Bartlett DH, Rouse GW, Tabata HG, Qian PY. 2016. The deepest mitochondrial genome sequenced from Mariana Trench Hirondellea gigas (Amphipoda). Mitochondrial DNA B Resour. 1(1):802–803.
- Laslett D, Canbäck B. 2008. ARWEN: a program to detect tRNA genes in metazoan mitochondrial nucleotide sequences. Bioinformatics. 24(2):172–175.
- Li JY, Song ZL, Yan GY, He LS. 2019b. The complete mitochondrial genome of the largest amphipod, Alicella gigantea: insight into its phylogenetic relationships and deep sea adaptive characters. Int J Biol Macromol. 141:570–577.
- Li JY, Zeng C, Yan GY, He LS. 2019a. Characterization of the mitochondrial genome of an ancient amphipod Halice sp. MT-2017 (Pardaliscidae) from 10,908 m in the Mariana Trench. Sci Rep. 9(1):1–15.
- Lin CP, Danforth BN. 2004. How do insect nuclear and mitochondrial gene substitution patterns differ? Insights from Bayesian analyses of combined datasets. Mol Phylogenet Evol. 30(3):686–702.
- López-López A, Vogler AP. 2017. The mitogenome phylogeny of Adephaga (Coleoptera). Mol Phylogenet Evol. 114:166–174.
- Lowry JK, Myers AA. 2017. A phylogeny and classification of the Amphipoda with the establishment of the new order Ingolfiellida (Crustacea: Peracarida). Zootaxa. 4265(1):1–89.
- Macey JR, Larson A, Ananjeva NB, Papenfuss TJ. 1997. Replication slippage may cause parallel evolution in the secondary structures of mitochondrial transfer RNAs. Mol Biol Evol. 14(1):30–39.
- Perna NT, Kocher TD. 1995. Patterns of nucleotide composition at fourfold degenerate sites of animal mitochondrial genomes. J Mol Evol. 41(3):353–358.
- Pilar Cabezas M, Cabezas P, Machordom A, Guerra‐García JM. 2013. Hidden diversity and cryptic speciation refute cosmopolitan distribution in Caprella penantis (Crustacea: Amphipoda: Caprellidae). J Zool Syst Evol Res. 51(2):85–99.
- Pons J, Bauzà-Ribot MM, Jaume D, Juan C. 2014. Next-generation sequencing, phylogenetic signal and comparative mitogenomic analyses in Metacrangonyctidae (Amphipoda: Crustacea). BMC Genomics. 15(1):566.
- Ritchie H, Jamieson AJ, Piertney SB. 2015. Phylogenetic relationships among hadal amphipods of the Superfamily Lysianassoidea: implications for taxonomy and biogeography. Deep Sea Res Part I. 105:119–131.
- Romanova EV, Aleoshin VV, Kamaltynov RM, Mikhailov KV, Logacheva MD, Sirotinina EA, Gornov AY, Anikin AS, Sherbakov DY. 2016. Evolution of mitochondrial genomes in Baikalian amphipods. BMC Genomics. 17(Suppl 14):1016.
- Ronquist F, Huelsenbeck JP. 2003. MRBAYES 3: Bayesian phylogenetic inference under mixed models. Bioinformatics. 19(12):1572–1574.
- Rozas J, Ferrer-Mata A, Sánchez-DelBarrio JC, Guirao-Rico S, Librado P, Ramos-Onsins SE, Sánchez-Gracia A. 2017. DnaSP 6: DNA sequence polymorphism analysis of large data sets. Mol Biol Evol. 34(12):3299–3302.
- Shin SC, Cho J, Lee JK, Ahn DH, Lee H, Park H. 2012. Complete mitochondrial genome of the Antarctic amphipod Gondogeneia antarctica (Crustacea, amphipod). Mitochondrial DNA. 23(1):25–27.
- Sun S, Wu Y, Ge X, Jakovlić I, Zhu J, Mahboob S, Al-Ghanim KA, Al-Misned F, Fu H. 2020. Disentangling the interplay of positive and negative selection forces that shaped mitochondrial genomes of Gammarus pisinnus and Gammarus lacustris. R Soc Open Sci. 7(1):190669.
- Tang Y, Zheng X, Liu H, Sunxie F. 2020. Population genetics and comparative mitogenomic analyses reveal cryptic diversity of Amphioctopus neglectus (Cephalopoda: Octopodidae). Genomics. 112(6):3893–3902.
- Väinölä R, Witt JDS, Grabowski M, Bradbury JH, Jazdzewski K, Sket B. 2008. Global diversity of amphipods (Amphipoda; Crustacea) in freshwater. Hydrobiologia 595:241–255.
- Verheye ML, D’Udekem D’Acoz C. 2021. Integrative taxonomy of giant crested Eusirus in the Southern Ocean, including the description of a new species (Crustacea: Amphipoda: Eusiridae. Zool J Linn Soc. 193(1):31–77.
- Watanabe YI, Suematsu T, Ohtsuki T. 2014. Losing the stem-loop structure from metazoan mitochondrial tRNAs and co-evolution of interacting factors. Front Genet. 5:109.
- Wilson K, Cahill V, Ballment E, Benzie J. 2000. The complete sequence of the mitochondrial genome of the crustacean Penaeus monodon: are malacostracan crustaceans more closely related to insects than to branchiopods? Mol Biol Evol. 17(6):863–874.
- Witt JD, Threloff DL, Hebert PD. 2006. DNA barcoding reveals extraordinary cryptic diversity in an amphipod genus: implications for desert spring conservation. Mol Ecol. 15(10):3073–3082.
- Yamazaki N, Ueshima R, Terrett JA, Yokobori S, Kaifu M, Segawa R, Kobayashi T, Numachi K, Ueda T, Nishikawa K. 1997. Evolution of pulmonate gastropod mitochondrial genomes: comparisons of gene organizations of Euhadra, Cepaea and Albinaria and implications of unusual tRNA secondary structures. Genetics. 145(3):749–758.
- Zhang D, Li WX, Zou H, Wu SG, Li M, Jakovlić I, Zhang J, Chen R, Wang GT. 2018. Mitochondrial genomes of two diplectanids (Platyhelminthes: Monogenea) expose paraphyly of the order Dactylogyridea and extensive tRNA gene rearrangements. Parasit Vectors. 11(1):1–13.
- Zhang DX, Hewitt GM. 1997. Insect mitochondrial control region: a review of its structure, evolution and usefulness in evolutionary studies. Biochem Syst Ecol. 25(2):99–120.
- Zhang Z, Xing Y, Cheng J, Pan D, Lv L, Cumberlidge N, Sun H. 2020. Phylogenetic implications of mitogenome rearrangements in East Asian potamiscine freshwater crabs (Brachyura: Potamidae). Mol Phylogenet Evol. 143:106669.