
Abstract
Long-standing tensions between Protestant and Catholic communities in Northern Ireland have led to high levels of segregation. This article explores the spaces within which residents of north Belfast move within everyday life and the extent to which these are influenced by segregation. We focus in particular on the role that interconnecting tertiary streets have on patterns of mobility. We adapt Grannis’s (Citation1998) concept to define T-communities from sets of interconnecting tertiary streets within north Belfast. These are combined with more than 6,000 Global Positioning System (GPS) tracks collected from local residents to assess the amount of time spent within different spaces. Spaces are divided into areas of residents’ own community affiliations (in-group), areas not clearly associated with either community (mixed), or areas of opposing community affiliation (out-group). We further differentiate space as being either within a T-community or along a section of main road. Our work extends research on T-communities by expanding their role beyond exploring residential preference, to explore, instead, networks of (dis)connection through which social divisions are expressed via everyday mobility practices. We conclude that residents are significantly less likely to move within mixed and out-group areas and that this is especially true within T-communities. It is also evident that residents are more likely to travel along out-group sections of a main road if they are in a vehicle and that women show no greater likelihood than men to move within out-group space. Evidence from GPS tracks also provides insights into some areas where mixing appears to occur. Key Words: GIS, Northern Ireland, postconflict, segregation, T-communities.
北爱尔兰基督新教与天主教之间的长期冲突导致高度的隔离。本研究探讨北爱尔法斯特居民每日生活中的活动空间, 以及这些空间受到隔离影响的程度。我们特别聚焦相互连结的第三级街道在移动模式上的角色。我们改编格兰尼斯(1998)的概念, 从北贝尔法斯特中一系列互相连结的第三级街道中定义T社群, 并结合搜集自地方居民超过六千个的全球定位系统(GPS)追踪, 评估在不同空间中花费的时间。空间分隔成居民自身社群联系(群体内部)的地区、并非与任一社群清楚联系的地区(混合), 或是对立的社群联系之地区(群体外部)。我们进一步将空间区分为在T社群内部或是沿着主要道路的路段。我们的研究通过将T社群的角色扩张至探讨居住偏好之外, 改为探讨社会分野通过每日移动行为展现的(不)连结网络, 延伸T社群的研究。我们于结论中主张, 居民明显较少在混合地区与群体外部的地区活动, 尤其对T社群而言更是如此。证据同时显示, 居民若乘坐交通工具, 则更可能沿着主要道路的群体外部部分进行移动, 且女性并非较男性而言更可能在群体外部空间中移动。全球定位系统追踪的证据, 同时对混合可能发生的若干地区提出洞见。关键词:地理信息系统, 北爱尔兰, 后冲突, 隔离, T社群。
Las viejas tensiones que reinan entre las comunidades protestantes y católicas de Irlanda del Norte han conducido a altos niveles de segregación. Este artículo explora los espacios dentro de los cuales se mueven los residentes del norte de Belfast en su vida cotidiana y el grado con el que estos son influidos por la segregación. Nos concentramos en particular en el papel que cumplen las calles terciarias en los patrones de movilidad de la gente. Adaptamos el concepto de Grannis (1998) para definir las comunidades T a partir de conjuntos de interconexión de calles terciarias dentro del note de Belfast. Estos a la vez se combinan con más de 6000 rastros del Sistema de Posicionamiento Global (GPS) tomados de residentes locales para evaluar el tiempo empleado por ellos dentro de diferentes espacios. Los espacios se dividen en áreas de afiliaciones de la propia comunidad de los residentes (dentro del grupo), áreas que no están claramente asociadas con cualquier comunidad (mezcladas), o áreas de afiliaciones comunitarias contrarias (fuera del grupo). Adicionalmente diferenciamos el espacio como asociado dentro de una comunidad T, o a lo largo de una sección de la vía principal. Nuestro trabajo amplía la investigación relacionada con comunidades T al expandir su papel más allá de la preferencia residencial a la exploración de las redes de (des)conexión a través de las cuales se expresan las divisiones sociales por medio de prácticas de movilidad cotidiana. Concluimos que los residentes están significativamente menos inclinados a desplazarse dentro de áreas mezcladas o fuera del grupo, y que esto es especialmente el caso dentro de las comunidades T. Es también evidente que los residentes están más propensos a viajar a lo largo de las secciones fuera del grupo de una vía principal si lo hacen en un vehículo y que las mujeres mostraron una probabilidad no mayor que la de los hombres a desplazarse dentro de espacios catalogados como fuera del grupo. La evidencia de los rastros GPS da también mejores perspectivas dentro de algunas áreas donde parece ocurrir mezcla de comunidades. Palabras clave: comunidades T, Irlanda del Norte, posconflicto, segregación, SIG.
There have been long-standing tensions between Protestant and Catholic communities in Northern Ireland over whether the region should remain part of the United Kingdom or become part of a united Republic of Ireland (Hughes et al. Citation2007; Brand Citation2009). These tensions have frequently erupted into violence, including the three decades between 1969 and 1998, known as “the troubles,” which both reinforced and extended patterns of residential, political, and social segregation across the region. Although the Good Friday peace agreement, in place since 1998, has helped bring a degree of peace to Northern Ireland, deep-seated notions of Britishness or Irishness are still strongly evident. Harassment, intimidation, and occasional violence continue in cities such as Belfast, further fueling mistrust between communities (Brand Citation2009). Decades of violence restrict the mobility of those living in highly segregated neighborhoods, with residents rarely crossing sectarian boundaries, instead adjusting their movements and use of services in response to fear (Lysaght and Basten Citation2003; Shirlow and Murtagh Citation2006). Through the course of this article, we explore the extent to which evidence of this restricted mobility plays out in terms of movement through different types of group space in north Belfast.
Sociospatial Segregation in Belfast
Boal (Citation1969) examined both residential and activity space segregation in the Shankhill and Falls communities (working-class areas of Belfast). In these areas, Protestants and Catholics are highly segregated yet live in close proximity to one another. Boal found a strong correlation between residential and activity space segregation, helping to explain ethno-sectarian immobility resulting from the presence of distinct territories. The layout of residential space through much of Belfast includes many cul-de-sacs and dead ends, which were intentionally used to segregate the two communities during the height of the region’s conflict and continue to create segregation leading to territorial concentration, preserving community identity and a strong sense of “other” in relation to those beyond their community (Boal Citation1996). This attitude toward the other community was also observed by Shirlow and McGovern (Citation1998), working in the Ardoyne area of Belfast. They reiterated the understanding that residential segregation both expresses and regulates ethno-sectarian animosity. In further work in the Ardoyne, fear of the other community was found to restrict mobility, affecting job-seeking, leisure, and consumption behavior (Shirlow Citation2000). Shirlow (Citation2003) found that people living in deeply segregated areas developed an instinctive awareness of “safe” and “unsafe” places.
Peace walls also remain a significant territorial feature in Belfast today. Initially constructed by the British Army in response to sectarian violence (Byrne, Heenan, and Robinson Citation2012), these walls are material structures designed to reduce opportunities for conflict between opposing communities, providing some safety and security but also reinforcing sectarian segregation (Byrne et al. Citation2012; Donnan and Jarman Citation2016). Beyond physical barriers, varying forms of territorial marking both reinforce a sense of community identity within Belfast’s neighborhoods and act as boundary markers between communities (Shirlow Citation2006). These include tangible symbols such as wall murals, flags (Jarman Citation2007), and painted curbs, as well as shared perceptions about who belongs where (Hughes et al. Citation2007; Brand Citation2009). The cumulative effect of these varying forms of sociospatial division is that in many cases basic services such as schools, playgrounds, libraries, leisure centers, and health services are used only by members of one community (Brand Citation2009), and residents have limited opportunity to interact across community divisions. Moreover, residents’ free movement through the city’s streets and the routes and pathways they select or avoid are powerfully shaped by their understandings of the local sectarian geography (Lysaght and Basten Citation2003; Huck et al. Citation2019). In this research, using a novel combination of Global Positioning System (GPS) tracking and geographic information system (GIS) data capture, we explore how Belfast residents’ everyday movements are shaped by such understandings. As elaborated later, we focus particularly on the role of tertiary street networks or T-communities (Grannis Citation1998) in the reproduction of segregated mobility practices over time. Indeed, we argue that such networks could represent a fundamental building block of the sectarian patterning of activity space use in cities such as Belfast.
There is limited literature that explores gender differences in mobility resulting from the segregation of urban street networks in Belfast, and this represents a second focus of this research. Available evidence suggests, at least anecdotally, that women might feel more confident entering neighborhoods of the opposing community (Lysaght and Basten Citation2003). A study into mobility and access to leisure facilities suggests, for example, that 62 percent of nonpensioners crossing the community divide for leisure purposes were women (Bairner and Shirlow Citation2003). Research from interviews conducted during the troubles also implies that, due to assumed political innocence and a mutual agreement that women and children were not legitimate targets, some women felt a greater confidence crossing the peace line in West Belfast (Dowler Citation2001). Although there is some evidence here to suggest that women are potentially more willing to enter out-group areas, this evidence has not explored concrete patterns of movement in and through everyday spaces. We therefore explore this idea further to see whether our evidence supports the idea that women move more freely than men within out-group spaces.
Lysaght and Basten (Citation2003) suggested that for those with access to a car it might be possible to overcome some of the spatial divisions that exist within a segregated city. The greater sense of safety and reduced opportunity for interaction derived when traveling in a vehicle suggest a greater likelihood that people will enter out-group or mixed spaces when traveling in a vehicle than when traveling on foot. In other words, a vehicle could act as a kind of spatial “bubble” that potentially insulates residents from forms of threat that are experienced more acutely when they travel as pedestrians, thus allowing them to cross sectarian boundaries. We explore this hypothesis further during our analysis.
Segregation, T-Communities, and Everyday Mobility Practices: From Predefined Areal Units to Tertiary Street Networks
This research aims to extend existing research on sectarian divisions in Belfast in two main ways. We extend Grannis’s (Citation1998, Citation2005) work on the role of so-called T-communities in maintaining racial segregation in large U.S. cities to the context of sectarian segregation in Belfast, Northern Ireland’s capital city. As a novel contribution to the field, we show how such T-communities are central in shaping the everyday mobility practices of local Catholic and Protestant residents. In effect, they are central to maintaining networks of disconnection in this historically divided city.
Many segregation studies use predefined areas such as census boundaries to define neighborhoods and measure the nature and extent of urban segregation (Omer and Benenson Citation2002; Noonan Citation2005; Lloyd Citation2010; Wong and Shaw Citation2011; Weaver Citation2015; Li and Wang Citation2017; Merrilees et al. Citation2017). Grannis (Citation2009) stressed that although boundaries defined by census or other administrative agencies generate statistical units that are useful for summarizing data, they do not delineate neighborhoods in a socially meaningful way or account for the potential for residents to interact. Census boundaries seldom map onto residents’ own perceptions or behaviors, which are important if the causes and consequences of segregation are to be determined (Deng Citation2016). For example, physical barriers such as open spaces, railways, or major roads have been found to affect segregation (Noonan Citation2005); yet such barriers are often disregarded in the largely administrative definition of census boundaries. The geographic context relevant to individuals themselves might thus not necessarily relate to officially delineated geographic units (e.g., wards, districts, or other census units; Kwan Citation2012). In the context of this study, the actual and perceived potential for interaction with specific group members is important for understanding both the nature of segregation and its consequences for the everyday mobility practices of individuals.
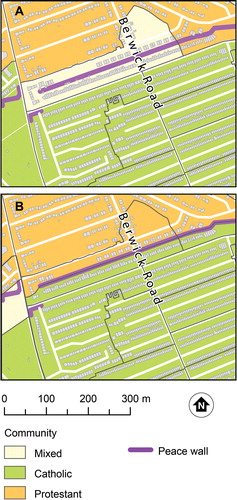
The challenges relating to use of census boundaries for neighborhood delineation are evident in north Belfast. Here some census small areas (the smallest reporting unit for the Northern Ireland census) appear to be highly mixed, yet as the example in shows, the area is, in fact, highly divided. On closer inspection of the small area shown as mixed in , it can be seen that there is no route, pedestrian or otherwise, between one side of the census small area and the other without crossing the boundary of the census small area. In fact, divided by a peace wall, this small area straddles an interface between highly segregated neighborhoods. This suggests not only that community affiliation is poorly defined but also that the census boundaries do not form part of a cohesive neighborhood definition.
Figure 1 (A) Community definitions based on UK population census small area statistics for 2011. Areas defined based on greater than 65 percent Catholic or Protestant. (B) Adjusted community definition accounting for street layout, presence of peace walls, and known community boundaries.
The concept of T-communities was introduced by Grannis (Citation1998), whose hypothesis was that relational connections via tertiary streets were a better predictor of the racial composition of neighborhoods than either simple proximity or distribution across census units. By studying two cities with very different social and geographic backgrounds, Los Angeles and San Francisco, Grannis (Citation1998) tested this hypothesis, finding that those residents connected via tertiary streets were much more similar than those not connected through a tertiary street network. He concluded that those “down the street”—regardless of distance—are more similar to each other than those who might be closer by straight-line distance but less connected. Grannis (Citation1998) also highlighted that residents living within the same census area do not have the same opportunities for contact as those living within the same T-communities. This concurs with our own observations as demonstrated earlier in , which indicates how interaction between residents who share a census tract might nonetheless be limited by territorial boundaries and the (dis)connection of existing street networks.
Grannis (Citation2005) later went on to study variations within T-communities, this time studying the cities of Los Angeles, New York, and Chicago. There he concluded that T-communities and their role in social connectivity between residents who view themselves as similar were a major factor in individuals’ decisions regarding where they choose to live. The T-community concept suggests that the geographic opportunities for everyday “passive” contacts, which tertiary street networks facilitate, could lead to opportunities for active contact between residents and the building of a sense of community (Weaver Citation2015). For these reasons, individuals’ residential preferences reflect not only simple relations of physical proximity but also relations of real and imagined connection, a sense of who lives down the street and who is likely to be encountered in everyday life while engaging in mundane activities such as going to the shops, visiting a friend, walking the dog, or simply taking a stroll.
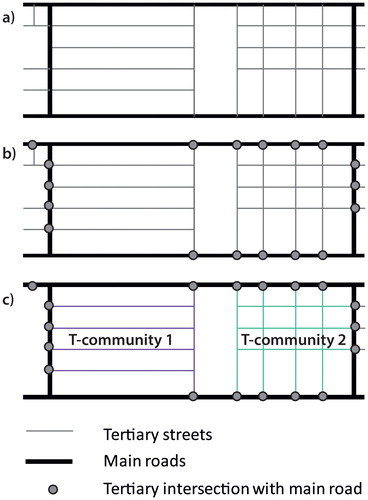
Grannis (Citation1998) defined tertiary streets as pedestrian-oriented streets that are not used as throughways but are designed to connect local residents with a sociospatial network of seemingly “trivial” streets. Where two or more tertiary streets interconnect, they are considered part of the same T-community, but once a tertiary street interconnects with a main road or other barrier, the outer limit of the T-community is defined (). T-communities also account for other boundaries that might separate neighborhoods, including parks, shopping malls, or physical barriers such as walls (Grannis Citation1998). Although there might always remain some uncertainty about the true geographic context affecting individuals (Kwan Citation2012), T-communities help to focus defined neighborhoods around opportunities for interaction, which is particularly important when considering segregation and mobility. The interconnections and opportunities for interaction facilitated by T-communities, we would argue, thus provide a more meaningful definition of spatial units for segregation studies than more commonly applied census boundaries.
Figure 2 The T-community concept: (A) distinguish main roads from tertiary streets, (B) identify intersections between tertiary streets and main roads (or other barriers), (C) group tertiary streets into T-communities, terminating the T-community when it reaches an intersection with a main road.
If, as Grannis (Citation1998) suggested, T-communities influence opportunities for interaction, then we might predict higher levels of activity space segregation (and lower levels of mixing) within them than within nontertiary streets. As discussed later, this research thus aimed to explore the extent to which sectarian segregation of mobility practices varies between tertiary and nontertiary streets, focusing on relations in the northern area of the historically divided city of Belfast. Our main objective here was not to directly compare the analytic utility of standard census units with T-communities as a foundational unit of analysis in residential segregation research, a comparison that Grannis has already developed (e.g., Grannis Citation1998). Rather, our objective was more novel, namely, to explore the potential role of T-communities in shaping how residents use everyday pathways and activity space beyond their homes.
Research Focus and Questions
Regardless of how neighborhoods are defined, many segregation studies focus exclusively on residential segregation, often using census data to define the ethnic mix of the residential population (Grannis Citation1998; Hughes et al. Citation2007; Lloyd and Shuttleworth Citation2012; Bruch Citation2014). Although some studies have measured use of space through activity diaries (Wong and Shaw Citation2011; Farber et al. Citation2013; Li and Wang Citation2017) or from mobile phone usage (Silm and Ahas Citation2014; Järv et al. Citation2015), few studies have used GPS tracking for understanding the impact of segregation on mobility (Palmer et al. Citation2013; Roulston et al. Citation2017). GPS tracks potentially identify locations that people visit when not at home, as well as the routes people take to reach these locations. To date the T-community concept has only been used for studies of residential segregation in large grid plan cities (Grannis Citation1998, Citation2005). Meanwhile work using GPS tracks to measure time in neighborhoods of differing characteristics has relied on census units to define neighborhood boundaries (Palmer et al. Citation2013). By combining T-community neighborhood definitions with GPS tracks collected by residents, we gain new insights into the way in which people use different types of group space (in-group, mixed, and out-group) and different neighborhood types (T-communities, main roads). To explore the impact of segregation on residents’ everyday movements, the study focuses entirely on time spent in transit, moving through open space, and excludes time spent at destinations.
Fear of the opposing community, either real or perceived, leads to negative emotional responses toward out-group areas (Shirlow Citation2003; Roulston et al. Citation2017), suggesting therefore that residents would be less likely to spend time moving within out-group areas. This is the first assumption that we seek to test. We then explore a second assumption that time spent in out-group space is less likely to be within T-communities and more likely to be along sections of main road that are used as through routes or for access to services, including access to supermarkets and retail parks. Based on the suggestion that fear is reduced when traveling in a vehicle (Lysaght and Basten Citation2003), we will test whether mode of transport affects the likelihood of entering out-group or mixed spaces. Finally, based on suggestions in the literature that women might be more willing to enter out-group space, we explore this idea further using data from a sample of local residents to determine whether there is any greater likelihood that women will enter out-group spaces than men.
Combining GPS tracking and T-community definitions, we address the following research questions:
Do residents of north Belfast spend significantly more time moving within areas of their own community affiliation (in-group areas) than within out-group or mixed spaces?
Of time spent within out-group space, is this more likely to be along sections of main road than within out-group T-communities?
Does mode of transport affect mobility, with people traveling in vehicles more likely to enter mixed or out-group space?
Do women spend more time within out-group areas than men?
Methods
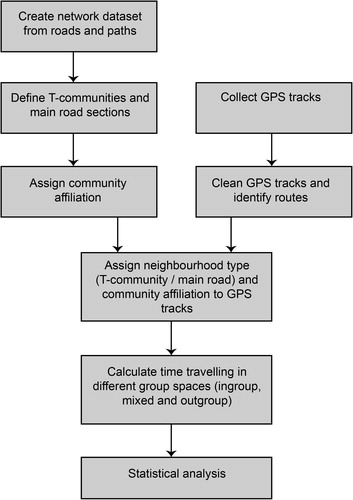
In this section, we outline the data inputs used and analysis undertaken, focusing on the challenge of studying how T-communities might shape everyday mobility practices in north Belfast, and how this could be affected by factors such as mode of transport and gender. The key steps are summarized in the flow diagram in .
Figure 3 Summary of steps in the methodology.
Study Area
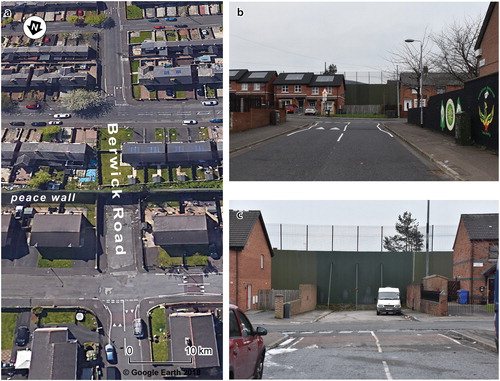
This study focuses on the area of north Belfast. Whereas east Belfast is predominantly Protestant and west Belfast is predominantly Catholic, north Belfast has approximately even numbers of Catholics and Protestants living side by side in highly segregated communities, as illustrated in . It is also within this part of the city that physical barriers to movement, in the form of peace walls, are most prevalent (). Both the close proximity of opposing communities and the presence of peace walls in north Belfast potentially affect people’s everyday mobility patterns, therefore making it an interesting focus for this study. illustrates the way in which peace walls divide tertiary streets that would once have connected communities. The example shown in is a section of a 650-m-long fence, which now divides a once-joined T-community into two disconnected communities. Here it evident that the tertiary street, Berwick Road, once connecting the two communities has been truncated. Regardless of any preference for avoiding out-group communities, it is obvious that the presence of peace walls themselves has affected everyday mobility in Belfast.
Figure 4 Study area: Catholic and Protestant communities within the study area of north Belfast, defined as census small areas with greater than 65 percent of residents identifying with this community during the 2011 Census of Population and where strong community identity is known to exist. Large nonresidential spaces and mixed neighborhoods are shown in white.
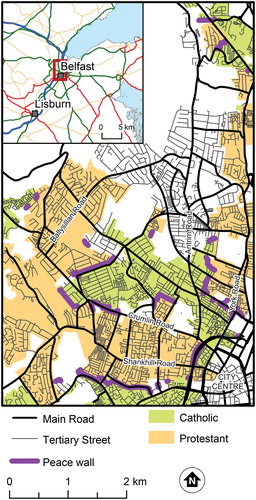
Figure 5 (A) Aerial image showing the division of the tertiary street, Berwick Road, by a peace wall. (B) Photo highlighting the impact of the barrier, on the Catholic side of the peace wall with evidence of painted murals. (C) Photo highlighting the impact of the barrier, on the Protestant side of the peace wall.
North Belfast experiences high levels of deprivation, with half of the residents living in the top 20 percent of most deprived wards in Northern Ireland. Deprivation levels are very similar for both the Protestant and Catholic communities in this study. The research here is part of a wider study exploring mobility and segregation in north Belfast (Hocking et al. Citation2019; Huck et al. Citation2019). Of all participants taking part in the study, 73 percent had a household income of less than £20,000 per year, with very little variation between community groups. Variation in economic status or deprivation is therefore excluded from subsequent analysis.
Defining T-Communities
We began by creating a network data set representing all roads and paths within north Belfast. This was derived from a road data set supplied by the Ordnance Survey Northern Ireland (OSNI) from which we captured additional residential footpaths visible on either Google Maps or the OSNI 1:10,000 background maps. Tertiary streets and footpaths within residential areas were defined as traversable. Features such as main roads, peace walls, industrial areas, retail complexes, and parks were defined as nontraversable and used as barriers within the network, thus defining boundaries for the T-communities. The T-communities were computed using ArcGIS Desktop 10.4 (ESRI Citation2015) network analysis tools to generate service areas representing all sets of connected streets before a barrier is reached (see for examples of defined T-communities). A fuller description of the method for creating T-communities can be found in the Supplemental Material.
Figure 6 An illustrative section of north Belfast showing (A) defined T-communities (labeled T1–T11) and (B) sections of main roads.
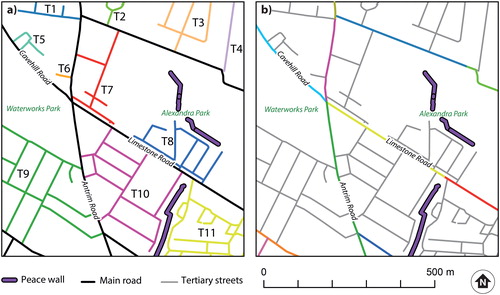
One of the key distinctions between Grannis’s (Citation1998) original definition and our implementation of T-communities is the treatment of main roads. Using Grannis’s definition, only roads not suitable for pedestrians are defined as main roads (Grannis Citation2005). By this definition, however, north Belfast would only form one T-community. Using our refined definition of main roads as those wide enough for two cars to pass and known as through routes, a more meaningful set of T-communities was created for studying segregation at a finer scale and in a context with a very different road structure. In Grannis’s (Citation1998) work, the main roads are then of little interest to further analysis of segregation. In the context of north Belfast, however, the main roads used to delineate boundaries to T-communities are of interest themselves. These main roads are well used as pedestrian routes and are often lined with residential properties. They accordingly convey sectarian territorial meanings. In addition to defining distinct T-communities, main roads were broken into sections at key junctions or known community divides (; see Supplemental Material for more information). In total, there are 391 T-communities and 212 main road sections within the study area, compared to 411 census small areas.
Assigning Community Affiliation
Although it is common to define the community affiliation of a neighborhood using census data, this can in some instances be misleading. For example, in north Belfast some census zones (census small areas) that appear mixed based on even numbers of Catholics and Protestants can be some of the most divided, such as the established Protestant community of Greencastle (Huck et al. Citation2019). Although census zones follow street patterns to some extent, they are often optimized to account for the number of households that they contain rather than aligned to community or neighborhood divides. It is therefore possible for census zones to be constructed across a clear community divide. In some instances, the divide is not only a perceived one but is also a physical barrier, with peace walls dividing census zones (as demonstrated in ). Using extensive local knowledge of the research team, the location of barriers (Belfast Interface Project 2017), and existing census data, census zones straddling a community divide were split and community affiliation was redefined accordingly. Areas were defined as either Catholic, Protestant, or mixed where it was known that a clear sense of community identity existed or mixing occurs, and was supported by census statistics. This definition was used to assign community affiliation to the T-communities. Unlike the census small area boundaries, no T-communities were found to straddle a known community divide. Community affiliation of sections of main road were defined, using the same community definition and with further refinement and advice from the Institute of Conflict Research, a nongovernmental organization located on a sectarian interface in north Belfast that has conducted research on segregation for more than twenty years.
GPS Tracking
Participants for GPS tracking were recruited to the project during a one-year field campaign, in which two project researchers went door to door throughout north Belfast asking all householders who answered the door to participate by installing a custom application on a GPS-enabled Android smartphone and collecting data for a period of up to fourteen days (see Hocking et al. [Citation2018], for more details of the process of recruiting particpants). From this field campaign, 233 recruits agreed to install the tracking application and registered some data. The application automatically captured points every four seconds and uploaded the data to a remote server once connected to Wi-Fi (Whyatt et al. Citation2016). Locational accuracy of GPS track points varies depending on a number of factors, including alignment of satellites, the quality of the receiver, and the presence of blocking features such as buildings and trees. Signal indoors is usually poor. The GPS data were cleaned to remove points with poor positional accuracy. The continuous sequence of points for each participant was also divided into separate tracks and stop locations. Details of the data cleaning process and the method used to separate tracks can be found in Davies et al. (Citation2017). A total of 184 (86 Catholic, 87 Protestant, and 11 other) users recorded at least one valid track, where a route between two locations could be distinguished. These were used in the subsequent analysis. The number of tracks varied from one to 200 per participant, with a mean of thirty-three per participant. A total of 6,158 separate tracks and stops were defined. The average age of participants was thirty-nine (this was the same for both Catholic and Protestant participant groups). Of the participants whose data were used for this study, 62 percent were female and 38 percent were male. There was a slight variation in gender split between community groups, with 57 percent female in the Catholic group and 70 percent female in the Protestant group.
Travel mode has a potentially significant influence on an individual’s willingness to move within out-group areas (Lysaght and Basten Citation2003). Because the mobile app did not capture travel mode, mode was inferred based on the work of Bohte and Maat (Citation2009). Participants were assumed to be on foot if the average track speed was less than 10 km/hr and the maximum track speed was less than 14 km/hr, in a vehicle if the average track speed was greater than 25 km/hr or maximum track speed was greater than 45 km/hr, and indeterminate for all other speeds, which could represent bicycling, slow-moving traffic, or a mixed-mode journey.
GPS track points were assigned T-communities or main road sections by first snapping all points within 20 m of a main road to those roads. This ensured that track points near junctions with tertiary streets remained associated with main roads. All remaining points within 40 m of a road were snapped to the nearest road section, assuming that all points further than 40 m from a road were associated with movement through open spaces such as parks. At this stage attributes from the assigned T-community or main road were joined to the GPS track points, including the community affiliation of the T-community. From this it was possible to ascertain whether the track points were in-group (same community affiliation as the participant), mixed (either participant affiliation was other or neighborhood was mixed), or out-group (community affiliation was opposite to the participant). User ID, track ID, time, travel mode, participant’s community affiliation and gender, and type of group space (in-group, mixed, out-group) were associated with each track point prior to the statistical analysis.
Statistical Approach
To address the research questions specified earlier, taking into account the structure of our data, which involved repeated measurement of participants from different groups, genders, and T-communities, we used mixed linear modeling with random intercepts for participants, implemented in the statistical programming language R (R Core Team Citation2018) and the package NLME (Pinheiro et al. Citation2018). Modeling our data with mixed linear methods allowed us to test the hypothesis that residents would spend more time moving within in-group areas (a main effect) and that when moving through out-group or mixed areas they would be more likely to do so along main roads (an interaction of type of group space and type of road). It also allowed us to test the hypothesis that residents would be more likely to move through mixed or out-group spaces in a vehicle rather than on foot (an interaction of mode of transport and type of group space), as well as the hypothesis that women would spend more time within non-in-group areas than men. To control for variable amounts of GPS tracking data captured from participants, which resulted in positively skewed distributions, time estimates were first aggregated per person and then log-transformed.
Factors for analysis included type of group space (in-group, mixed, out-group), community membership (Catholic/Protestant), travel mode (by vehicle or on foot), and neighborhood type (main road vs. T-community). A further covariate was added into the analysis to control for opportunity for road usage across group space and neighborhood type. This covariate represented the proportion of main roads and tertiary streets within 1 km of a participant’s home that was within in-group, mixed, or out-group space. The dependent variable was the log-transformed, summed amount of time in minutes that each individual spent in different types of spaces using different modes of travel. This measure was used to generate, among other things, aggregate scores of the time spent by different community groups across different spaces. The mixed linear model fitted to the data had fixed effects for group space, community membership (Catholic/Protestant), travel mode, neighborhood type, and the road usage covariate, as well as a random intercept effect for participants. Modeling was carried out in a top-down fashion, as recommended by Zuur et al. (Citation2009); that is, nonsignificant higher order model classes were removed iteratively and nonsignificant individual terms were removed from the highest remaining order of model class.
Results
We present results for each of the research questions in the order specified earlier and repeat the research questions for sake of clarity of presentation.
Do residents of north Belfast spend significantly more time moving within areas of their own community affiliation (in-group areas) than within out-group or mixed spaces?
Of time spent within out-group space is this more likely to be along sections of main road than within out-group T-communities?
Overall, participants spent considerably more time moving within in-group areas than within mixed or out-group areas. suggests that for sections of main road there is an ordinal pattern for time spent in types of group space (in-group > mixed > out-group). Whereas the pattern of preference for in-group space holds for both main roads and T-communities, the pattern is much more striking for time spent within T-communities, where very little time is spent within mixed or out-group areas. This is borne out by the significant interaction for group space and neighborhood type in the mixed linear model, as shown in . Our results therefore not only confirm the preference for moving within in-group space but also clearly demonstrate that time spent within out-group space is more likely to be along sections of main road.
Figure 7 Median minutes spent along main roads or within T-communities, across types of group space. Note: The confidence intervals were estimated by bootstrap (1,000 replications).
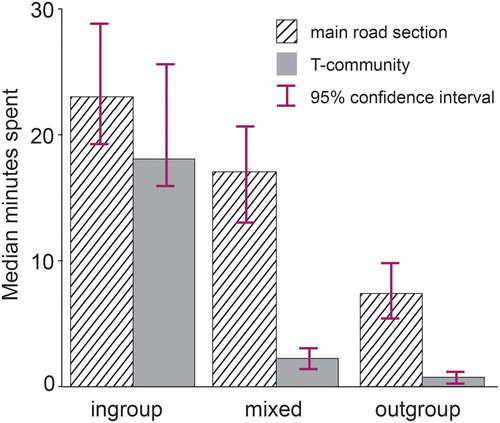
Table 1. Analysis of variance table for mixed linear model containing two-way interaction of group space and neighborhood type, controlling for home location
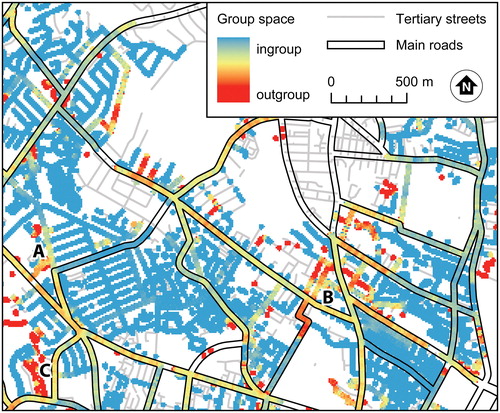
further illustrates the finding that participants were significantly less likely to move within out-group T-community space. This shows that along main roads there is movement within in-group, mixed, and out-group spaces, with a slight preference toward movement within in-group spaces. For the majority of T-communities, however, it is evident that most movement occurs within in-group space. Although the majority of mixing between in-group and out-group usage occurs along main roads, pockets of out-group movements within tertiary streets occur across the map, usually relating to a single trip by one participant (e.g., Location C in ). In some areas where a greater amount of mixing appears present within tertiary streets, there are possible explanatory factors. For example, Location A on the map shows the location of Holy Cross Girls Primary School. This is a Catholic primary school situated within a Protestant neighborhood. Tracks within this area, recorded as movement within out-group space, are all timed at the start or end of the school day, suggesting that taking children to or from the Holy Cross School offers a clear explanation of the use of this out-group space. There is also strong evidence of movement within out-group space around Location B. This is a predominantly Catholic area, which includes the location of the Belfast Royal Academy (a mixed grammar school). The timing of out-group movement in this area is more varied, typically at the start and end of the working day and at lunchtime.
Figure 8 Movements captured from participants’ Global Positioning System tracks within north Belfast. Shading ranges from blue (track points show participants moving within in-group areas) to red (track points show participant movement within out-group spaces). Blended colors show mixed patterns of movement within in-group and out-group areas.
Although the nonoverlapping confidence intervals in suggest clear differences in the patterns of time spent within sections of main road or T-communities across different group spaces (in-group, mixed, out-group), this could be an artifact of participants’ home locations rather than preference for in-group space. We therefore introduced a covariate into the analysis to control for the opportunity of road usage across group space and neighborhood type (main road section, T-community). Having carried out a secondary analysis to account for the types of roads and group spaces within close proximity of a participant’s home location, results showed that although the control for home location was significant in explaining use of group space, preference for in-group space remained significant. shows the modified analysis of variance table, which confirms that even controlling for home location, people were significantly less likely to spend time within out-group space. shows that home location had a significant overall effect on time spent across different kinds of spaces, F(1, 1641.6) = 17.86, p < 0.001; however, above and beyond this effect, type of group space, neighborhood type, and, crucially, the group space by neighborhood type interaction all remained statistically significant. Examination of the residuals from the model suggested possible heteroskedasticity (an important assumption underlying the calculation of probability values), and we therefore computed bootstrap 95 percent confidence intervals (1,000 replications) for model parameter estimates as an alternative, distribution-independent check on model effects. All effects reported as significant in also had confidence intervals that were either entirely positive or entirely negative, supporting the findings in . Model parameters, with confidence intervals, are shown in .
Table 2. Model coefficients (fixed effects, with bootstrapped 95 percent confidence intervals, 1,000 repetitions)
For the statistical analysis, all zero values were removed, meaning that only participants who spent at least sometime within an out-group area were included in the analysis. This removed from the analysis 21 percent of participants, who never recorded any movement within out-group space. In light of this, the clear preference found for use of in-group rather than out-group space is a conservative estimate of the impact of segregation on movement. The overall use of out-group T-communities is particularly low, constituting less than 2 percent of the overall movements captured within the GPS tracks.
In summary, our results show that residents of north Belfast spend significantly more time moving within areas of their own community affiliation (in-group areas) and that time spent within out-group space is more likely to be along sections of main road than within T-communities. The overall implication is that segregation is widespread within north Belfast and that it is expressed most starkly via everyday patterns of movement within networks of tertiary streets (T-communities).
Does mode of transport affect mobility, with people traveling in vehicles more likely to enter mixed or out-group space?
Initial examination of the two-way interaction between group space and travel mode, shown as part of , suggested that there was no significant interaction between travel mode and group space (p ≤ 0.202) in predicting time spent. Further exploration of the three-way interactions between group space, neighborhood type, and travel mode, shown in , revealed that movement along out-group or mixed sections of main roads was significantly more likely to occur within a vehicle than on foot. In contrast, we found no significant differences for travel mode within mixed or out-group T-communities. Model parameters, with confidence intervals, are shown in .
Figure 9 Median minutes spent in different group spaces by transport mode. Letters above bars indicate significantly different post hoc contrasts (Tukey). Different letters indicate a significant difference at p < 0.05. Thus, in the far right panel, a > b > c = c, indicating that participants spent significantly more time in out-group main road sections when in a vehicle than when walking in such sections or either walking or driving in T-communities.
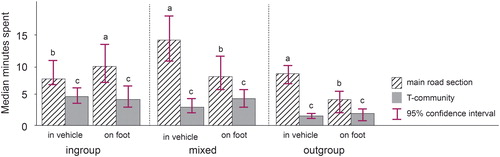
Table 3. Analysis of variance table for mixed linear modeling of time spent within in-group spaces by travel mode, community, and neighborhood type
Table 4. Model coefficients (fixed effects, with bootstrapped 95 percent confidence intervals, 1,000 repetitions)
We found that the combination of mode of transport and type of road had little influence on the use of in-group space. However, several effects emerged for mixed and out-group spaces when considering the same combination. Notably, along main roads, residents were more likely to move within mixed or out-group spaces when in a vehicle, rather than on foot. Mode of transport, however, had no effect on the time spent in mixed or out-group spaces when those spaces were part of the T-communities. Thus, traveling in a vehicle might enable residents to spend more time on main roads outside their own community spaces, but it has no effect on the use of mixed or out-group spaces that are within T-communities.
Do women spend more time within out-group areas than men?
We tested whether men and women spent different amounts of time in different group spaces, but we did not find a significant effect. The only notable effect we found for gender in all of our analyses was a marginally significant interaction between gender and mode of transport in a four-way mixed linear model (extending the three-way model reported in by adding mode of transport). This showed that there was a significant likelihood that men would travel within a vehicle and that women would walk. In general, though, our results do not support the hypothesis that women would spend more time in mixed or out-group spaces, whether located along main roads or within T-communities.
Table 5. Analysis of variance table for mixed linear modeling of time spent in in-group spaces by gender, neighborhood type, and group space
Discussion
In reflecting on the methodology applied and results obtained, we first examine the findings in relation to the hypothesis set, which explores the impact of segregation on people’s mobility, particularly in the context of movement within defined T-community spaces. We then discuss challenges of adapting the T-community concept to a very different setting than its original implementation, examining the extent to which this is useful for further segregation studies.
Perhaps unsurprising, given the history of conflict within north Belfast and the continued presence of sectarian markers in the landscape, including physical barriers such as peace walls, our results show that residents of north Belfast spend significantly more time moving within in-group spaces than within either mixed or out-group areas. What is more interesting is that this pattern is significantly stronger within T-communities than along main roads, suggesting that it is within networks of tertiary streets (T-communities) that segregation remains at its strongest. Given Grannis’s (Citation1998) premise that opportunities for interaction between residents create identity within T-communities, and thereby shape residents’ choices about where and with whom they want live (Grannis Citation1998), it is perhaps unsurprising that no T-communities straddle a community divide and that very little movement occurs within out-group T-community space. Where use is made of out-group T-community space this is often for specific reasons, such as access to Holy Cross Primary School, a Catholic school situated within a predominantly Protestant T-community (, Location A). At the same time, past tensions around areas such as Holy Cross serve to highlight tensions and fear related to entering out-group neighborhoods (Gilligan Citation2009; Young Citation2017).
Along main roads there is still a preference for use of in-group space, but this effect is less pronounced than within T-communities. One explanation for this is that journeys along main roads beyond in-group space are necessary to access other parts of the city, as well as key services and facilities within north Belfast that might be located along main roads in or beyond out-group spaces. Travel along main roads, typically in vehicles between an individual’s home T-community and a neutral nonplace such as a supermarket, limits interactions with people or symbols of sectarianism such as flags or graffiti (Huck et al. Citation2019). Although there is significantly more use of out-group sections of main roads compared to T-communities, evidence from walking interviews (see Hocking et al. [Citation2019] for details) conducted as part of the wider project, of which this study is one part, suggests that there remains a clear sense of defined community territories along main roads. In some cases, community members know which side of the road they need to walk on to feel safe. During his walking interview, one participant (a male Protestant) had a clear notion of where he did and did not feel safe and the best route through an opposing out-group area. Reference here to “the Shankhill” relates to an area of shops along Shankhill Road. Both Shankhill Road and Crumlin Road are main roads that lead into the city center.
I know that’s Catholic, so therefore that would stop me from going in that direction. If I could avoid going in the direction of a Catholic area, hence, this is why I would go this way because I would feel very vulnerable going down through Alliance Avenue. Be very vulnerable down Ardoyne Road. But on this road, it runs straight down, straight down to Twaddell Avenue, Woodvale, Crumlin Road. And if I was going to the Shankill for instance to go to a shop, I’d walk on that side of the road [right hand if headed in the direction of town], and right down to that corner.
In exploring the impact of mode of transport on mobility, it is clear that participants are more likely to travel along out-group sections of main roads if they are in a vehicle. This is interesting because it qualifies the supposed “bubble” effects of being enclosed within a motor vehicle. Being within a vehicle might cause residents to feel safer (Lysaght and Basten Citation2003), minimizing opportunities for interaction with members of the other community. Residents might travel through out-group areas in a vehicle to reach neutral spaces such as retail parks or supermarkets, sometimes referred to as nonspaces, which have no past history of ownership or conflict (Huck et al. Citation2019). The bubble effect of a vehicle does not, however, appear to extend into T-communities. This is perhaps to be expected, because T-communities are rarely used as thoroughfares and therefore are unlikely to be passed through in a vehicle en route to other destinations. It should also be remembered that very little movement was recorded within out-group T-communities and limited conclusions can therefore be made in relation to travel mode within out-group T-communities.
Despite anecdotal evidence from earlier literature (Dowler Citation2001; Bairner and Shirlow Citation2003; Lysaght and Basten Citation2003) suggesting that women might experience greater mobility within out-group areas, evidence from the tracking data both along main roads and within T-communities in north Belfast suggests that this is not the case, with no significant difference found in the amount of time that men and women spend moving within out-group areas. Anecdotal evidence within the literature is now dated and mobility patterns could have since changed in postconflict Belfast. It is also possible that although women might be more prepared to enter out-group areas—for example, to access certain shops, services, or activities—these visits might be infrequent and hence were not fully captured within the limited time frame of the tracking data collected. An alternative explanation could be that although women typically feel less afraid of entering out-group areas, both women and men will equally prefer in-group areas, unless there is a particular need to cross a sectarian boundary.
Grannis’s (Citation1998) definition of T-communities was designed to work for large cities in the United States and thus needed scaling, through redefining the interpretation of main roads, to be applicable in this research context. This rescaling was effective in delineating boundaries that fit well with existing understanding of community divides within north Belfast and shows potential as a means of neighborhood delineation for other studies and geographic contexts. Although in some cases our T-communities extended over an area known locally to be defined by name as more than one neighborhood, these were neighborhoods of the same community affiliation and evidence from the tracking data in this area suggests that residents move throughout the whole of that T-community, not only the locally named area in which they live. Although this might suggest that T-communities do not necessarily delineate neighborhoods as recognized locally, they do represent opportunities for interaction, as originally intended by Grannis (Citation1998). Kwan (Citation2012) previously commented that an individual’s perceived neighborhood might differ both from administratively defined neighborhoods and from people’s activity spaces. In this context, our T-communities not only appear appropriate for the context studied but also offer a more meaningful fit to known community boundaries than census zones that are often used in segregation studies (Lloyd and Shuttleworth Citation2012; Palmer et al. Citation2013).
The other key adaptation to Grannis’s (Citation1998) original T-community concept was the treatment of main roads. In an area such as north Belfast, where the main roads are walkable and fronted by many residential properties, these cannot simply be excluded from the analysis. The ability to compare patterns of segregation and mobility between main road sections and T-communities proved highly beneficial, leading to a greater understanding of the types of space in which the greatest impact of segregation on mobility occurs. Because T-communities are based on real-world geographies, they provide a useful unit of assessment for real-world interventions to encourage greater mixing.
One of the key elements to understanding the impact of segregation on mobility is the GPS tracking data available for this study. This is a unique data set, obtained from a year-long field campaign (Hocking et al. Citation2019) representing up to two weeks of movements for 184 residents. Although the GPS tracks represent only a sample of the population for a limited time, they provide a rich source of understanding in terms of the types of spaces within which residents regularly move. The GPS data can only tell us where people do go, however, and do not offer conclusive evidence of where people do not go. Grannis’s (Citation1998) analysis of segregation was limited to residential data for census blocks, with no available information on time spent in different T-communities. The GPS track data collected for this study, however, gave us the opportunity to explore in more depth the extent to which individuals move with different types of T-communities or main roads and thus the extent to which segregation affects movement. Importantly, it also helps identify the types of spaces where opposing communities might interact. The GPS tracking data offer the opportunity to identify specific areas where greater mixing appears to occur. The most striking example of this is evident in , at Location B. One reason for this mixing might be the location of the Belfast Royal Academy grammar school, although timing within the track data suggests that this cannot be the only explanation. Another explanation might be the lack of alternative options for local convenience shops within the neighboring Protestant community. Although the tracking data cannot confirm the full extent of or reasons for mixing occurring in this area, they do suggest that this area warrants further exploration to ascertain the extent of this mixing and what factors might be encouraging this to occur. Further examination of this mixing could enhance opportunities to encourage further interaction between the communities both here and elsewhere.
The methods developed here not only are useful for the understanding of segregation in the context of north Belfast but show the usefulness and adaptability of the T-community concept for understanding segregation and mobility in other geographic contexts.
Conclusion
This article explores the impact of segregation in new ways. A rich set of GPS tracks obtained through an extensive, year-long field study (Hocking et al. Citation2019) enabled us to shift analytic focus away from residential segregation, which is already relatively well understood within Northern Ireland, and toward an understanding of the impact of segregation on individuals’ everyday movements. More specifically, we have argued that shifting focus away from use of administrative geographies (e.g., census boundaries) toward use of defined T-communities provides a more meaningful set of boundaries in relation to the geography that residents encounter when making day-to-day mobility choices in the city. Analysis using T-communities also enabled us to develop a clearer understanding of the different impacts that segregation has within networks of residential tertiary streets, more easily avoidable by members of the out-group community, compared to main roads, sometimes unavoidably used to access facilities elsewhere.
We have shown Grannis’s (Citation1998) T-community concept to be scalable and applicable within north Belfast. First, although the T-communities we generated were smaller in geographic area than Grannis’s (Citation1998) original work in larger cities such as Los Angeles, they are equally useful and appropriate for the street and neighborhood configurations found in Belfast. In adapting the T-community definition to fit a new geographic context, we demonstrate its flexibility to be adapted and applied in future studies elsewhere. Future work could incorporate participatory approaches (Huck et al. Citation2019) to defining community affiliation of T-communities. Second, within north Belfast it is clear not only that segregation occurs and affects mobility but also that the impact of segregation on mobility appears to be greatest within tertiary street networks, where movement within out-group communities is minimal. Even along main roads where greater mixing occurs, evidence suggests that most of these movements are within vehicles, thus providing rare opportunities for face-to-face interactions between members of different community groups.
In summary, it is clear that the two main communities in North Belfast remain largely disconnected from each other, almost never entering residential T-communities associated with the other community. Although there is some evidence to suggest potential connections along main roads, even here this is mostly within vehicles, thus limiting opportunities for interaction and leaving the communities disconnected from each other. More positively, however, results from our GPS tracking highlight some areas where greater mixing appears to occur, and these areas warrant further investigation. Understanding why mixing occurs in particular areas could lead to greater understanding that can in turn influence policy and planning elsewhere in the city.
Supplemental Material
This article contains Supplemental data available on the publisher’s Web site.
Supplemental Material
Download Zip (6.6 MB)Acknowledgments
We thank the participants from north Belfast who made this study possible. We also thank our reviewers for their useful comments.
Additional information
Funding
GEMMA DAVIES is the GIS Officer in the Lancaster Environment Centre at Lancaster University, Lancaster LA1 4YQ, UK. E-mail: [email protected]. Her research interests cover several areas of applied GIS, including food security, journey-time exposure to air pollution, and mobility.
JOHN DIXON is Professor of Psychology in the School of Psychology at the Open University, Milton Keynes MK7 6AA, UK. E-mail: [email protected]. His work focuses on the dynamics of intergroup contact, prejudice, and segregation in historically divided societies.
COLIN G. TREDOUX is Professor of Psychology at the University of Cape Town, Rondebosch, Cape Town 7701, South Africa, and Chaire d’Attractivité at Université de Toulouse, Jean Jaurés. E-mail: [email protected]. His research in social psychology focuses on modeling intergroup relations.
J. DUNCAN WHYATT is a Senior Lecturer in GIS in the Lancaster Environment Centre at Lancaster University, Lancaster LA1 4YQ, UK. E-mail: [email protected]. He has research interests in both the natural and social sciences.
JONNY J. HUCK is a Lecturer in Geographical Information Science in the Department of Geography at the University of Manchester, Manchester M13 9PL, UK. E-mail: [email protected]. His research interests include the representation of vague entities in geographical information science and the application of emergent technologies to geographical problems, particularly in the context of health and postconflict societies.
BRENDAN STURGEON is a researcher at the Institute for Conflict Research, Belfast BT15 2GG, Northern Ireland. E-mail: [email protected]. His research interests include segregation and policing in postconflict societies.
BREE T. HOCKING was until recently a Research Associate in the School of Psychology at The Open University, Belfast BT1 3GN, Northern Ireland. E-mail: [email protected]. An independent scholar and writer, her work focuses on spatial politics, identity, public art, and the anthropology of tourism in postindustrial and postconflict landscapes.
NEIL JARMAN is Director of the Institute for Conflict Research, Belfast BT15 2GG, Northern Ireland. E-mail: [email protected]. His research focuses on such issues as street violence, disputes over parades, management of public order, police reform, racist and homophobic violence, and human rights in a number of countries, including Northern Ireland, South Africa, the United States, Israel and Palestine, Kosovo, and Nepal.
DOMINIC BRYAN is a Reader in Anthropology in the Institute of Irish Studies at Queen’s University Belfast, Belfast BT7 1NN, Northern Ireland. E-mail: [email protected]. His research interests include the politics of rituals and symbols in Northern Ireland and other divided societies.
Related Research Data
References
- Bairner, A., and P. Shirlow. 2003. When leisure turns to fear: Fear, mobility, and ethno-sectarianism in Belfast. Leisure Studies 22 (3):203–21.
- Belfast Interface Project. 2017. Interface barriers, peacelines and defensive architecture. Accessed April 11, 2019. https://www.belfastinterfaceproject.org/sites/default/files/publications/Interfaces%20PDF.pdf
- Boal, F. W. 1969. Territoriality on the Shankill–Falls Divide, Belfast. Irish Geography 6 (1):30–50.
- Boal, F. W. 1996. Integration and division: Sharing and segregating in Belfast. Planning Practice and Research 11 (2):151–58.
- Bohte, W., and K. Maat. 2009. Deriving and validating trip purposes and travel modes for multi-day GPS-based travel surveys: A large-scale application in the Netherlands. Transportation Research Part C: Emerging Technologies 17 (3):285–97.
- Brand, R. 2009. Urban artifacts and social practices in a contested city. Journal of Urban Technology 16 (2–3):35–60.
- Bruch, E. E. 2014. How population structure shapes neighborhood segregation. American Journal of Sociology 119 (5):1221–78.
- Byrne, J., C. G. Heenan, and G. Robinson. 2012. Attitudes to peace walls. Coleraine, N. Ireland: University of Ulster.
- Davies, G., J. J. Huck, J. D. Whyatt, J. D. B. Hocking, N. Jarman, B. Sturgeon, and D. Bryan. 2017. Belfast mobility: Extracting route information from GPS tracks. Proceedings of the GIS Research UK 25th Annual Conference: GISRUK 2017, Manchester, UK. Accessed April 3, 2019. http://manchester.gisruk.org/proceedings.php
- Deng, Y. 2016. Challenges and complications in neighborhood mapping: From neighborhood concept to operationalization. Journal of Geographical Systems 18 (3):229–48.
- Donnan, H., and N. Jarman. 2016. Ordinary everyday walls: Normalising exception in segregated Belfast. In The walls between conflict and peace, ed. A. Gasparini and E. Ben-Rafael, 238–60. Leiden, The Netherlands: Brill.
- Dowler, L. 2001. No man’s land: Gender and the geopolitics of mobility in west Belfast, Northern Ireland. Geopolitics 6 (3):158–76.
- ESRI. 2015. ArcGIS 10.4 for Desktop. Redlands, CA: Environmental Systems Research Institute.
- Farber, S., T. Neutens, H. J. Miller, and X. Li. 2013. The social interaction potential of metropolitan regions: A time-geographic measurement approach using joint accessibility. Annals of the Association of American Geographers 103 (3):483–504.
- Gilligan, C. 2009. Insecurity and community relations: Vulnerability and the protests at the Holy Cross Girls Primary School in Belfast. In Community, citizenship, and the war on terror, ed. P. Noxolo and J. Huysmans, 32–50. Basingstoke, UK: Palgrave Macmillan.
- Grannis, R. 1998. The importance of trivial streets: Residential streets and residential segregation. American Journal of Sociology 103 (6):1530–64.
- Grannis, R. 2005. T-communities: Pedestrian street networks and residential segregation in Chicago, Los Angeles, and New York. City & Community 4:295–321.
- Grannis, R. 2009. From the ground up: Translating geography into community through neighborhood networks. Princeton, NJ: Princeton University Press.
- Hocking, B., B. Sturgeon, J. D. Whyatt, G. Davies, J. Huck, J. Dixon, N. Jarman, and D. Bryan. 2019. Negotiating the ground: “Mobilizing” a divided field site in the “post-conflict” city. Mobilities 13 (6):876–93.
- Huck, J., D. Whyatt, J. Dixon, B. Sturgeon, B. Hocking, G. Davies, N. Jarman, and D. Bryan. 2019. Exploring segregation and sharing in Belfast: A PGIS approach. Annals of the American Association of Geographers 109 (1):223–41.
- Hughes, J., A. Campbell, M. Hewstone, and E. Cairns. 2007. Segregation in Northern Ireland. Policy Studies 28 (1):33–53.
- Jarman, N. 2007. Pride and possession, display and destruction: Flags and identity in Belfast. In Flying the flag: Critical perspectives on symbolism and identity, ed. T. Eriksen and R. Jenkins, 88–101. London and New York: Routledge.
- Järv, O., K. Müürisepp, R. Ahas, B. Derudder, and F. Witlox. 2015. Ethnic differences in activity spaces as a characteristic of segregation: A study based on mobile phone usage in Tallinn, Estonia. Urban Studies 52 (14):2680–98.
- Kwan, M.-P. 2012. The uncertain geographic context problem. Annals of the Association of American Geographers 102 (5):958–68.
- Li, F., and D. Wang. 2017. Measuring urban segregation based on individuals’ daily activity patterns: A multidimensional approach. Environment and Planning A: Economy and Space 49 (2):467–86.
- Lloyd, C. D. 2010. Exploring population spatial concentrations in Northern Ireland by community background and other characteristics: An application of geographically weighted spatial statistics. International Journal of Geographical Information Science 24 (8):1193–1221.
- Lloyd, C. D., and I. Shuttleworth. 2012. Residential segregation in Northern Ireland in 2001: Assessing the value of exploring spatial variations. Environment and Planning A: Economy and Space 44 (1):52–67.
- Lysaght, K., and A. Basten. 2003. Violence, fear and the everyday: Negotiating spatial practices in the city of Belfast. In The meaning of violence, ed. E. Stanko, 224–43. London and New York: Routledge.
- Merrilees, C. E., L. K. Taylor, R. Baird, M. C. Goeke-Morey, P. Shirlow, and E. M. Cummings. 2017. Neighborhood effects of intergroup contact on change in youth intergroup bias. Journal of Youth and Adolescence 47 (1):77–87.
- Noonan, D. D. 2005. Neighbours, barriers and urban environments: Are things “different on the other side of the tracks”? Urban Studies 42 (10):1817–35.
- Omer, I., and I. Benenson. 2002. Investigating fine-scale residential segregation by means of local spatial statistics. Geography Research Forum 22:41–60.
- Palmer, J. R. B., T. J. Espenshade, F. Bartumeus, C. Y. Chung, N. E. Ozgencil, and K. Li. 2013. New approaches to human mobility: Using mobile phones for demographic research. Demography 50 (3):1105–28.
- Pinheiro, J., D. Bates, S. DebRoy, and D. Sarkar, and R Core Team. 2018. nlme: Linear and nonlinear mixed effects models. R Package Version 3.1–137. Accessed October 2, 2019. https://CRAN.R-project.org/package=nlme.
- R Core Team. 2018. R: A language and environment for statistical computing. Vienna, Austria: R Foundation for Statistical Computing.
- Roulston, S., U. Hansson, S. Cook, and P. McKenzie. 2017. If you are not one of them you feel out of place: Understanding divisions in a Northern Irish town. Children’s Geographies 15 (4):452–65.
- Shirlow, P. 2000. Fear, mobility and living in the Ardoyne and Upper Ardoyne communities. Belfast, Northern Ireland: North Belfast Partnership Board.
- Shirlow, P. 2003. “Who fears to speak”: Fear, mobility, and ethno‐sectarianism in the two Ardoynes. The Global Review of Ethnopolitics 3 (1):76–91.
- Shirlow, P. 2006. Belfast: The “post-conflict” city. Space and Polity 10 (2):99–107.
- Shirlow, P., and M. McGovern. 1998. Language, discourse and dialogue: Sinn Fein and the Irish peace process. Political Geography 17 (2):171–86.
- Shirlow, P., and B. Murtagh. 2006. Belfast: Segregation, violence and the city. London: Pluto.
- Silm, S., and R. Ahas. 2014. The temporal variation of ethnic segregation in a city: Evidence from a mobile phone use dataset. Social Science Research 47:30–43.
- Weaver, R. 2015. A cross-level exploratory analysis of “neighborhood effects” on urban behavior: An evolutionary perspective. Social Sciences 4 (4):1046–66.
- Whyatt, J., G. Davies, J. Huck, J. Dixon, B. Hocking, N. Jarman, B. Sturgeon, and D. Bryan. 2016. Belfast pathways: Space-time analysis of everyday activities in a segregated environment. Proceedings of the GIS Research UK 24th Annual Conference: GISRUK 2016, Greenwich, UK.
- Wong, D. W. S., and S.-L. Shaw. 2011. Measuring segregation: An activity space approach. Journal of Geographical Systems 13 (2):127–45.
- Young, C. 2017. Kerbs painted at Holy Cross Girls’ Primary School. The Irish News, June 30.
- Zuur, A., E. N. Ieno, N. Walker, A. A. Saveliev, and G. M. Smith. 2009. Mixed effects models and extensions in ecology with R. New York: Springer Science & Business Media.