
Abstract
The availability and use of geographic information technologies and data for describing the patterns and processes operating on or near the Earth’s surface have grown substantially during the past fifty years. The number of geographic information systems software packages and algorithms has also grown quickly during this period, fueled by rapid advances in computing and the explosive growth in the availability of digital data describing specific phenomena. Geographic information scientists therefore increasingly find themselves choosing between multiple software suites and algorithms to execute specific analysis, modeling, and visualization tasks in environmental applications today. This is a major challenge because it is often difficult to assess the efficacy of the candidate software platforms and algorithms when used in specific applications and study areas, which often generate different results. The subtleties and issues that characterize the field of geomorphometry are used here to document the need for (1) theoretically based software and algorithms; (2) new methods for the collection of provenance information about the data and code along with application context knowledge; and (3) new protocols for distributing this information and knowledge along with the data and code. This article discusses the progress and enduring challenges connected with these outcomes.
过去50年, 描述地表和近地表模式和过程的地理信息技术、数据及其应用, 已经有了极大的发展。在此期间, 受益于计算科学的快速进步和数据的爆炸性增长, 地理信息系统软件和算法的数量也急剧增多。为了对环境应用进行分析、建模和可视化, 地理信息科学家们一直需要在众多的软件系统和算法之间做出选择。在特定应用和特定研究区域, 评定产生不同结果的不同软件平台和算法的功效, 往往非常困难, 也是地理信息科学家所面临的主要挑战。利用地理形态学的细节和问题, 本文描述了如下需求:1)基于理论的软件和算法, 2)收集数据和程序的来源及其应用背景知识的新方法, 3)同数据和程序一起, 提供来源信息和背景知识的协议。本文讨论了与这些需求有关的进展和挑战。
La disponibilidad y uso de tecnologías y datos de información geográfica para describir los patrones y procesos que operan en o cerca de la superficie de la Tierra ha crecido sustancialmente durante los pasados cincuenta años. El número de paquetes de software y algoritmos de sistemas de información geográfica también se ha incrementado rápidamente durante este período, alimentado por los avances acelerados en computación y el explosivo crecimiento en la disponibilidad de datos digitales que describen fenómenos específicos. Por eso los científicos de la información geográfica cada vez más tienen que escoger hoy entre múltiples suites de software y algoritmos para ejecutar análisis específicos, modelado y tareas de visualización con aplicaciones ambientales. Este es un desafío mayor porque a menudo es difícil evaluar la eficacia las plataformas de software y algoritmos tomados como candidatos cuando se usan en aplicaciones específicas y áreas de estudio, que con frecuencia generan resultados diferentes. Las sutilezas y cosas que caracterizan el campo de la geomorfometría se usan aquí para documentar la necesidad de allegar (1) software y algoritmos fundamentados teóricamente; (2) nuevos métodos para la recolección de información básica acerca de los datos y código junto con conocimiento del contexto de la aplicación; y (3) nuevos protocolos para distribuir esta información y conocimiento junto con los datos y el código. El artículo discute el progreso y los retos perdurables conectados con estos resultados.
Computation has become a widely accepted, if not an expected, component of geospatial research, rising to the level of a “third branch” of science along with theory and experimentation (Deelman et al. Citation2009), or part of a “fourth paradigm” of scientific discovery beyond the existing paradigms of empiricism, laboratory analysis, and simulation (Hey, Tansley, and Tolie Citation2009). A computational approach to geospatial research allows the rapid utilization of many disparate data sources and the application of many variants of an algorithm to execute any specific analysis. Modern geospatial research, however, is based on an in silico science involving the complex process of data acquisition, data management, analysis, visualization, and dissemination of results.
We can use geomorphometry, the science of quantitative land surface analysis, to illustrate the current state of affairs. Great strides have been made in geomorphometry during the past fifty years, spurred on by new sources of digital elevation data, the specification of new land surface parameters, the extraction of landforms and other land surface objects, the improving characterization of error and uncertainty, and the development of code to facilitate and support digital terrain modeling workflows.
The calculation and use of land surface parameters constitute the heart of geomorphometry. There are now more than 100 primary and secondary land surface parameters in common use (Wilson Citation2018). The majority are primary parameters derived from square-grid digital elevation models (DEMs) that measure site-specific, local, or regional characteristics of the land surface without additional input (Wilson and Burrough Citation1999). The secondary parameters are calculated using at least two primary parameters and additional inputs in some instances and focus on water flow and soil redistribution or energy and heat regimes (Wilson and Gallant Citation2000). Many of these land surface parameters incorporate flow direction and rely on preconditioning of the elevation source data to delineate the channel system and fill spurious pits, before using one or more of the twenty-four flow direction algorithms proposed during the past thirty years. In addition, several of the newer flow direction algorithms combine square-grid DEMs and triangulated irregular networks to avoid some of the shortcomings associated with using square-grid DEMs to describe the surface and to take advantage of the additional discretization afforded by triangulated irregular networks (Wilson Citation2018).
That said, it is very difficult to assess the efficacy of the aforementioned flow-routing algorithms and their impact on flow accumulation and other land surface parameters that incorporate them. The most popular approaches have relied on four geometrical shapes for which the flow directions are known (e.g., Zhou and Liu Citation2002), comparisons of the performance of two or more of the aforementioned flow direction algorithms in specific landscapes (e.g., Wilson, Lam, and Deng Citation2007; Pilesjö and Hasan Citation2014), or both. A recent study by Buchanan et al. (Citation2014) illustrates the enormity of the challenge here. This study calculated topographic wetness using more than 400 unique approaches that considered different horizontal DEM resolutions, the vertical accuracy of the DEM, flow direction and slope algorithms, smoothing versus low-pass filtering, and the inclusion of relevant soil properties, to compare the resulting topographic wetness maps with observed soil moisture in agricultural fields.
This state of affairs suggests two major challenges. The first is that different software tools might produce different results when the same spatial analysis technique (i.e., the same flow direction approach in this instance) is applied to the same data or the results cannot be reproduced by the same software due to the lack of proper metadata or provenance documenting the spatial processing parameters that were used. Qin et al. (Citation2016) recently used case-based formalization and reasoning methods to acquire application context knowledge that might help to address the latter issue. These authors selected 125 cases of drainage network extraction (fifty for evaluation, seventy-five for reasoning) from peer-reviewed journal articles and used these cases to determine the catchment area threshold for extracting drainage networks. This approach could be applied to many of the challenges currently encountered in digital terrain modeling workflows, but it would likely not solve the second problem.
The second problem is that there is every reason to believe that spatial scientists will need to be especially concerned about replicability because it is highly likely that the results generated in one geographic area will not be replicable in other geographic areas (cf. Waters [Citation2020], who described how geographically weighted regression could be used for replicating the validity of models across space). New approaches, such as the computationally efficient version of the theoretical derivation of specific catchment area by Hutchinson and Gallant (Citation2011), recently offered by Qin et al. (Citation2017), might help to minimize these problems, but for the fact that many of the current techniques for spatial analysis lack a sound theoretical justification.
These shortcomings suggest the need for new work to strengthen the replicability and reproducibility of geospatial research. The following sections tackle the aforementioned two challenges by focusing on three aspects. First, we propose a five-star guide for measuring replicability and reproducibility. We then explore how e-science and scientific workflow software might help to achieve these goals. After summarizing what we have accomplished to date to operationalize replicability and reproducibility in the geospatial sciences, we offer some conclusions and suggestions for future work.
New Protocols for Distributing the Data and Code of Geospatial Research
The data and code of a study need to be shared to address the aforementioned challenges and effectively support replicability and reproducibility in geospatial research. They can include the geospatial data used by a study, such as the data themselves, the geographic areas of data, data sources, and other metadata, as well as information about many aspects of the performed spatial analysis, such as the software and algorithm choices, software package versions, parameter settings, preprocessing steps, and others. Sharing all such information in a well-formatted manner, however, is a daunting task for many researchers.
Here, we propose a five-star practical guide for sharing data and code in geospatial research, modeled after the five-star system offered by Berners-Lee (Citation2009) for publishing linked open data on the Web (). Instead of asking researchers to share all pieces of data and code, this five-star guide encourages a simple start of data and code sharing, and researchers can move to a higher level when time and other resources allow.
Figure 1 Five-star guide to encourage more researchers and GIS practitioners to share their data and code, modeled after the five-star system for publishing linked open data on the Web proposed by Berners-Lee (Citation2009). GIS = geographic information systems.
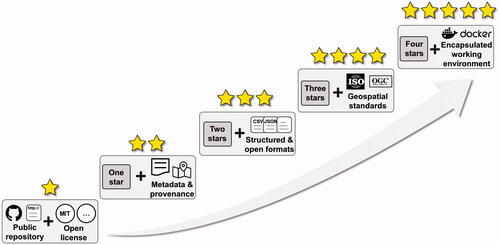
One star: Sharing the data and code of a geospatial study under an open license. At this level, researchers only need to make their data and code available via a shared Web link or a GitHub repository. The shared data and code should have an open license, such as an MIT or GNU General Public license. Researchers do not need to clean their code or make any metadata available, however.
Two stars: Sharing the data and code as well as some metadata and provenance information. At this level, researchers are expected to provide some additional metadata describing their data and code, such as the studied geographic area, the geographic information systems (GIS) software package and version used, the time of data collection, the meaning of individual attributes of a data set, and comments on individual lines of code, including the parameter settings of spatial analysis methods. The metadata and provenance information do not have to be complete or structured.
Three stars: Sharing the data and code as well as complete and well-structured metadata and provenance information. The criteria used to specify completeness include descriptions of each attribute of a data table and the provision of the coordinate information for geographic data sets. Structured metadata and provenance information using comma-separated values, JavaScript Object Notation, Resource Description Framework, or some other open format is preferred.
Four stars: Sharing the data and code as well as complete and well-structured metadata and provenance information encoded following geospatial standards. This level adds to the previous one by encouraging researchers to encode their data and metadata using standards, such as those from the Federal Geographic Data Committee, the International Organization for Standardization, and the Open Geospatial Consortium (OGC). There might also be links provided to the appropriate application programming interfaces.
Five stars: Sharing the data and code along with complete and well-structured metadata and provenance information encoded following geospatial standards and encapsulated using standard containers such as Docker. This level expects researchers to share data and code in a way that enables the complete recovery of the working environment of a study. For example, Docker provides virtualization at the level of the operating system and supports the reproduction of a study under the same computing environment.
E-Science and Scientific Workflow Software as a Framework for Facilitating Replicability and Reproducibility
The five-star guide for sharing data and code illustrated in shows how every aspect of the research process must be captured and shared to achieve replicability and reproducibility (cf. Tullis and Kar Citation2020; Waters Citation2020, Nüst and Pebesma Citation2020). Nüst and Pebesma (Citation2020), for example, suggested replacing the traditional text-centric research paper with executable research compendia that include digital artifacts that encapsulate the data, the scripted workflow and its computing environment, and the article based on a notebook. E-science offers a framework to integrate technology into all aspects of the research process and automate the acquisition of the information required to reproduce or replicate research. The e-science framework encourages the research process to be viewed as a scientific workflow or set of sequential, iterative, or branched tasks that are required to carry out a computational experiment (Deelman et al. Citation2009). Often, these systems are represented by “dataflow languages in which workflows are represented as directed graphs, with nodes denoting computational steps and connections representing data dependencies (and data flow) between steps” (McPhillips et al. Citation2009, 542). Both open-source and commercial off-the-shelf software packages exist to help scientists create, manage, and share workflows (see Garijo et al. [Citation2014] for a review).
Scientific workflow systems document and potentially automate the capture of data, analytical, and visualization provenance information. Their visual nature promotes understanding and reuse. Garijo et al. (Citation2014) outlined several advantages to workflow reuse: It supports researcher attribution of established methods, improves quality through iterative and collaborative workflow development, and makes the research process more efficient. Encapsulation of the research process in a scientific workflow system facilitates sharing of workflows. For example, myexperiment (https://www.myexperiment.org/) is a repository of nearly 4,000 workflows from a variety of workflow management systems (Goble et al. Citation2010).
We turn next to describe the progress among researchers, instructors, students, engineers, software developers, and practitioners for facilitating replicability and reproducibility in geospatial studies.
New Methods to Operationalize Replicability and Reproducibility in Spatial Analysis and Geospatial Software
The operationalization of replicability and reproducibility requires an effective mechanism to trace automatically the flow of data in geospatial software. Metadata and provenance become essential elements in such an endeavor. Metadata is a kind of data; it often uses standard language to encode information about the data, such as a spatial reference system, a bounding box, the data provider, and the data content (Goodchild Citation2007). Provenance is a kind of metadata that focuses on describing the lineage of the data (Missier, Belhajjame, and Cheney Citation2013). Current metadata and provenance have been limited to the modeling of data, which is only one element in a scientific workflow (cf. Costello et al. Citation2013; Tullis and Kar Citation2020). To enable full automation and reproducibility, we argue that it is equally, if not more, important to capture runtime information about both the data and the spatial operation, or spatial operation chains, in a complex problem-solving environment.
Metadata and Provenance in a Spatial Analytical Workbench
Anselin, Rey, and Li (Citation2014) encoded metadata and provenance into open-source spatial analysis libraries to improve interoperability, reuse, and reproducibility of spatial data and methods. The lack of replicability in current spatial software motivated this work. We take the generation of spatial weights—a fundamental element that represents the spatial neighbor relationships used to model spatial autocorrelation within spatial data and processes—as an example. Although a simple task, the generation of spatial weights can leverage different software, different ways for calculating neighborhood, and different parameter settings (i.e., row standardization or not). Given a spatial weights file, however, there are very limited metadata to interpret how the file was generated, making the replicability and validation of the spatial relationship data extremely difficult. Resolving this issue, Anselin, Rey, and Li (Citation2014) defined a lightweight provenance structure describing the input, parameters, and output of a spatial operation. The data derived from a spatial method are paired with a metadata file describing the workflow for generating them. The data are associated with a digital object identifier (see also Gallagher et al. Citation2015) so that they can be easily located and reused, and the spatial methods in a desktop-based spatial library are shared as standard Web services or application programming interfaces so that they can be remotely invoked through their uniform resource locator. This way, given a machine-understandable provenance file detailing the data processing flow, both the methods and results can be easily reproduced.
Automated Workflow Generation and Execution in a Cyberinfrastructure for Replicable Research
As a backbone framework for e-science, cyberinfrastructure relies on high-performance computing, high-speed Internet, and advanced middleware to address data- and computationally intensive problems (Atkins et al. Citation2003). One key design principle of a cyberinfrastructure is the provision of an online platform that can support physically distributed researchers to perform spatial analysis in an open, collaborative, and reproducible manner. In the geospatial domain, researchers have been investigating new ways to capture, cache, and execute data processing workflows to improve reproducibility (Wang Citation2010; Li et al. Citation2019). For example, Li, Song, and Tian (Citation2019) developed a cyberinfrastructure portal powered by spatial ontologies to realize automatic workflow generation, chaining, and execution to achieve reproducibility in an online spatial–analytical environment. Spatial ontologies have three parts. The first is an ontology defining thematic classification of various types of spatial data that are suitable for use in different applications. The second is an ontology defining the input, output, and function of a spatial operation shared openly with the public as OGC-compliant Web services. The third is a chaining rule ontology describing how to embed data and processes in a cascading workflow. A service chaining engine is proposed using the three aforementioned elements to create an executable workflow metadata file as a spatial data set that is being processed in the Web portal by an end user. The advantage of this solution is the enablement of a service-oriented computing paradigm, which includes not only the spatial data but also the processes shared as OGC services. These services provide standardized interfaces for invoking data and processes that could be located on the Web instead of being hosted locally. This service-oriented approach significantly improves data reuse, reduces the efforts in duplicating already-implemented spatial methods, and accelerates the speed for knowledge discovery. More important, the cascading workflow is independent of any specific software and instead, it can be translated easily into different process execution languages to be run using different tools, to re-create the analysis results for cross-validation and reproduction.
Conclusions
The probability of successfully reproducing a prior study increases from one to five stars. Researchers do need to spend extra time and effort to share code and data at a higher level, however. This practice often goes unrewarded in current academic evaluations and, as such, this five-star guide aims to encourage the start of a culture of data and code sharing to help facilitate replicability and reproducibility in geospatial research.
Modern geospatial research is increasingly computationally intensive, required to integrate many disparate data sources, under increased pressure to be more interdisciplinary, challenged to analyze increasing volumes of data, and, in some instances, regulated to share data, methods, and results with the public. Management of all of these ancillary pressures can potentially divert focus from primary research activities and are impediments to replicability and reproducibility. Leveraging technology at each step of the research process and encapsulating it in a scientific workflow system should promote the acquisition and sharing of the information required to make geospatial research more reproducible and replicable.
Additional information
Notes on contributors
John P. Wilson
JOHN P. WILSON is a Professor of Architecture, Civil and Environmental Engineering, Computer Science, Preventive Medicine, and Sociology and the founding Director of the Spatial Sciences Institute at the University of Southern California, Los Angeles, CA 90089-0374. E-mail: [email protected]. His main research interests focus on the use of GIS, spatial analysis, and environmental modeling to understand and predict the performance of coupled human–environment systems.
Kevin Butler
KEVIN BUTLER is a Product Engineer on the ESRI Analysis and Geoprocessing Team, ESRI, Redlands, CA 92373. E-mail: [email protected]. His research interests include a thematic focus on spatial statistical analytical workflows, a methodological focus on spatial clustering techniques, and a geographic focus on Puerto Rico and Midwestern cities.
Song Gao
SONG GAO is an Assistant Professor of GIScience in the Department of Geography, University of Wisconsin, Madison, WI 53706-1404. E-mail: [email protected]. His main research interests include place-based GIS, geospatial data science, and human mobility.
Yingjie Hu
YINGJIE HU is an Assistant Professor in the Department of Geography at the University at Buffalo, Buffalo, NY 14261. E-mail: [email protected]. His main research interests include spatial and textual analysis, geospatial semantics, geographic information retrieval, and GeoAI.
Wenwen Li
WENWEN LI is an Associate Professor in GIScience in the School of Geographical Sciences and Urban Planning, Arizona State University, Tempe, AZ 85287-5302. E-mail: [email protected]. Her research interests include cyberinfrastructure, geospatial big data, machine learning, and their applications in data-intensive environmental and social sciences.
Dawn J. Wright
DAWN J. WRIGHT is Chief Scientist of ESRI and Professor of Geography and Oceanography at Oregon State University, ESRI, Redlands, CA 92373. E-mail: [email protected]. Her main research interests are environmental informatics for open sharing and analysis of data, geospatial data science, and sea floor mapping and geomorphometry.
References
- Anselin, L., S. J. Rey, and W. Li. 2014. Metadata and provenance for spatial analysis: The case of spatial weights. International Journal of Geographical Information Science 28 (11):2261–80. doi: https://doi.org/10.1080/13658816.2014.917313.
- Atkins, D. E., K. K. Droegemeier, S. I. Feldman, H. Garcia-Molina, M. L. Klein, D. G. Messerschmitt, P. Messina, J. P. Ostriker, and M. H. Wright. 2003. Revolutionizing science and engineering through cyberinfrastructure: Report of the National Science Foundation blue-ribbon advisory panel on cyberinfrastructure. Accessed October 19, 2019. https://www.nsf.gov/cise/sci/reports/atkins.pdf.
- Berners-Lee, T. 2009. Linked data: Design issues. Accessed October 11, 2019. https://www.w3.org/DesignIssues/LinkedData.html.
- Buchanan, B. P., M. Fleming, R. L. Schneider, B. K. Richards, J. Archibald, Z. Qiu, and M. T. Walter. 2014. Evaluating topographic wetness indices across central New York agricultural landscapes. Hydrology and Earth System Sciences 18 (8):3279–99. doi: https://doi.org/10.5194/hess-18-3279-2014.
- Costello, M. J., W. K. Michener, M. Gahegan, Z.-Q. Zhang, and P. E. Bourne. 2013. Biodiversity data should be published, cited, and peer reviewed. Trends in Ecology & Evolution 28 (8):454–60. doi: https://doi.org/10.1016/j.tree.2013.05.002.
- Deelman, E., D. Gannon, M. Shields, and I. Taylor. 2009. Workflows and e-Science: An overview of workflow system features and capabilities. Future Generation Computer Systems 25 (5):528–40. doi: https://doi.org/10.1016/j.future.2008.06.012.
- Gallagher, J., J. Orcutt, P. Simpson, D. Wright, J. Pearlman, and L. Raymond. 2015. Facilitating open exchange of data and information. Earth Science Informatics 8 (4):721–39. doi: https://doi.org/10.1007/s12145-014-0202-2.
- Garijo, D., P. Alper, K. Belhajjame, O. Corcho, Y. Gil, and C. Goble. 2014. Common motifs in scientific workflows: An empirical analysis. Future Generation Computer Systems 36:338–51. doi: https://doi.org/10.1016/j.future.2013.09.018.
- Goble, C. A., J. Bhagat, S. Aleksejevs, D. Cruickshank, D. Michaelides, D. Newman, M. Borkum, S. Bechhofer, M. Roos, P. Li et al. 2010. myExperiment: A repository and social network for the sharing of bioinformatics workflows. Nucleic Acids Research 38 (Web Server issue):W677–W682. doi: https://doi.org/10.1093/nar/gkq429.
- Goodchild, M. F. 2007. Beyond metadata: Towards user-centric description of data quality. Paper presented at the 5th International Symposium on Spatial Data Quality, Enschede, The Netherlands, June 13–15.
- Hey, T., S. Tansley, and K. Tolie, eds. 2009. The fourth paradigm: Data-intensive scientific discovery. Redmond, WA: Microsoft Research.
- Hutchinson, M. F., and J. C. Gallant. 2011. A differential equation for specific catchment area. Water Resources Research 47 (5):95335. doi: https://doi.org/10.1029/2009WR008540.
- Li, W., M. Song, and Y. Tian. 2019. An ontology-driven cyberinfrastructure for intelligent spatiotemporal question answering and open knowledge discovery. ISPRS International Journal of Geo-Information 8 (11):496. doi: https://doi.org/10.3390/ijgi8110496.
- McPhillips, T., S. Bowers, D. Zinn, and B. Ludäscher. 2009. Scientific workflow design for mere mortals. Future Generation Computer Systems 25 (5):541–51. doi: https://doi.org/10.1016/j.future.2008.06.013.
- Missier, P., K. Belhajjame, and J. Cheney. 2013. The W3C PROV family of specifications for modelling provenance metadata. In Proceedings of the 16th International Conference on Extending Database Technology, ed. N. W. Paton, G. Guerrini, B. Catania, M. Castellanos, P. Atzeni, P. Fraternali, and A. Gounaris, 773–76. New York: ACM. doi: https://doi.org/10.1145/2452376.2452478.
- Nüst, D., and E. Pebesma. 2020. Practical reproducibility in geography and geosciences. Annals of the American Association of Geographers. doi:https://doi.org/10.1080/24694452.2020.1806028.
- Pilesjö, P., and A. Hasan. 2014. A triangular form-based multiple flow algorithm to estimate overland flow distribution and accumulation in a digital elevation model. Transactions in GIS 18 (1):108–24. doi: https://doi.org/10.1111/tgis.12015.
- Qin, C.-Z., B.-B. Ai, A.-X. Zhu, and J.-Z. Liu. 2017. An efficient method for applying a differential equation to deriving the spatial distribution of specific catchment area from gridded digital elevation models. Computers & Geosciences 100:94–102. doi: https://doi.org/10.1016/j.cageo.2016.12.009.
- Qin, C.-Z., X.-W. Wu, J.-C. Jiang, and A.-X. Zhu. 2016. Case-based formalization and reasoning method for knowledge in digital terrain analysis: Application to extracting drainage networks. Hydrology and Earth System Sciences 20 (8):3379–92. doi: https://doi.org/10.5194/hess-20-3379-2016.
- Tullis, A. A., and B. Kar. 2020. Where is the provenance? Ethical replicability and reproducibility in GIScience and its critical applications. Annals of the American Association of Geographers. doi: https://doi.org/10.1080/24694452.2020.1806029.
- Wang, S. 2010. A CyberGIS framework for the synthesis of cyberinfrastructure, GIS, and spatial analysis. Annals of the Association of American Geographers 100 (3):535–57. doi: https://doi.org/10.1080/00045601003791243.
- Waters, N. 2020. Motivations and methods for replication in geography: Working with data streams. Annals of the American Association of Geographers. doi:https://doi.org/10.1080/24694452.2020.1806027.
- Wilson, J. P. 2018. Environmental applications of digital terrain modelling. Oxford, UK: Wiley-Blackwell.
- Wilson, J. P., and P. A. Burrough. 1999. Dynamic modeling, geostatistics, and fuzzy classification: New sneakers for a new geography? Annals of the Association of American Geographers 89 (4):736–46. doi: https://doi.org/10.1111/0004-5608.00173.
- Wilson, J. P., and J. C. Gallant. 2000. Secondary topographic attributes. In Terrain analysis: Principles and applications, ed. J. P. Wilson and J. C. Gallant, 51–85. New York: Wiley.
- Wilson, J. P., C. S. Lam, and X. Y. Deng. 2007. Comparison of performance of flow routing algorithms used in geographic information systems. Hydrological Processes 21 (8):1026–44. doi: https://doi.org/10.1002/hyp.6277.
- Zhou, Q., and X. Liu. 2002. Error assessment of grid-based flow routing algorithms used in hydrological models. International Journal of Geographical Information Science 16 (8):819–42. doi: https://doi.org/10.1080/13658810210149425.