?Mathematical formulae have been encoded as MathML and are displayed in this HTML version using MathJax in order to improve their display. Uncheck the box to turn MathJax off. This feature requires Javascript. Click on a formula to zoom.
Abstract
This article offers a new perspective on telecommuting from the viewpoint of the complex web of digital divides. Using the United Kingdom as a case study, this article studies how the quality and reliability of Internet services, as reflected in experienced Internet upload speeds during the spring 2020 lockdown, might reinforce or redress the spatial and social dimensions of digital divisions. Fast, reliable Internet connections are necessary for the population to be able to work from home. Although not every place hosts individuals in occupations that allow for telecommuting or with the necessary skills to effectively use the Internet to telecommute, good Internet connectivity is also essential to local economic resilience in a period like the current pandemic. Employing data on individual broadband speed tests and state-of-the-art time series clustering methods, we create clusters of UK local authorities with similar temporal signatures of experienced upload speeds. We then associate these clusters of local authorities with their socioeconomic and geographic characteristics to explore how they overlap with or diverge from the existing economic and digital geography of the United Kingdom. Our analysis enables us to better understand how the spatial and social distributions of both occupations and online accessibility intersect to enable or hinder the practice of telecommuting at a time of extreme demand.
本文从复杂的数字鸿沟网络角度出发, 提供了远程办公的新见解。以英国为例, 研究了互联网服务质量和可靠性(例如2020年春季封锁期间的互联网上传速度)如何加强或矫正了数字鸿沟的空间和社会层面。快速可靠的互联网连接是在家工作的必要条件。虽然并非每个地方都有可以远程办公的个人、并非每个地方都有具备有效使用互联网进行远程办公所需技能的个人, 但在当前疫情期间, 良好的互联网连通性对经济复苏也至关重要。利用个人宽带速度测试数据和时间序列聚类新方法, 我们对具有相似上传速度时间特征的英国地方当局建立了聚类。然后, 我们将地方当局集群与其社会经济和地理特征相关联, 探索了它们与英国现有经济和数字地理的重叠或偏差。该分析使我们能够更好地理解职业和在线可访问性在空间和社会分布上的相互作用, 从而在极端需求情况下鼓励或禁止远程办公。
Este artículo presenta una perspectiva nueva del trabajo a distancia desde el punto de vista de una compleja red de divisorias digitales. Usando al Reino Unido como un estudio de caso, este artículo explora el modo como la calidad y confiabilidad de los servicios de Internet, según se reflejan en las velocidades de carga de Internet experimentadas durante el confinamiento de la primavera del 2020, podrían reforzar o reparar las dimensiones espaciales y sociales de las divisiones digitales. Se necesitan conexiones rápidas y confiables para que la gente pueda trabajar desde su casa. Aunque no todo lugar alberga individuos con ocupaciones que permitan el trabajo a distancia ni sin las habilidades necesarias para darle un uso eficaz al Internet para teletrabajar, una buena conectividad de Internet es también esencial para la resiliencia económica local en un período como el de la actual pandemia. Empleando datos de las pruebas del ancho de banda individual y métodos de clústering de series sobre el estado del arte, creamos clústeres de autoridades locales del RU con firmas temporales similares de las velocidades de carga experimentadas. Luego asociamos las geografías económica y digital existentes del Reino Unido. Nuestro análisis nos capacita para entender mejor cómo las distribuciones espaciales y sociales de las ocupaciones y la accesibilidad en red se entrecruzan para habilitar o esconder la práctica del trabajo a distancia en un tiempo de extrema demanda.
During the COVID-19 pandemic, working from home using digital technologies, whether partially or exclusively, was transformed from a niche means of accessing work—albeit one that had been on a slow, upward trend—to a widespread way of life in many countries. The ability to work from home or telecommute meant that millions retained their jobs and, to a varying extent, maintained productivity during periods of strict lockdowns around the world. This ability has not been evenly distributed socially or spatially, however, creating new intersections of economic and digital divisions. On one side are those who can work from home, supported by digital technologies. They have thus been able to enjoy both economic resilience and greater personal safety. On the other side, previously employed individuals have been forced to accept furlough or redundancy packages unless they are part of the cadre of essential workers, who are potentially at high risk of infection. Although the basis for this pandemic-generated divide has been viewed as mainly occupational, here we consider whether it is also technological and geographical.
The capability to work from home has previously been studied from the perspective of whether work tasks in a given occupation both can be and are allowed to be performed using digital technologies independent of location or colocation with colleagues, including supervisors (Singh et al. Citation2013; Allen, Golden, and Shockley Citation2015). Successful telecommuting, however, also requires that the quality and reliability of digital services, particularly home Internet connection speeds, enable the completion of work tasks with a minimum of delay or interruption. High levels of demand are one of the main causes of reduced reliability and slower connection speeds, as network bandwidth becomes congested. Yet prior to the pandemic, the performance of broadband services with respect to telecommuters was never tested at scale, because working from home and connecting to colleagues and workplace resources via the Internet was the purview of a small minority of workers. Instead, leisure use in the evening, when video streaming services are at their peak, has been used to benchmark broadband performance and service delivery by different Internet service providers (OfCom Citation2017).
The shift toward telecommuting during various stages of lockdown around the world has been drastic and there are speculations that post-COVID the tendency to work from home will be much higher, raising questions about whether Internet services can accommodate the increased demand. For example, 47 percent of people employed in the United Kingdom worked solely from home in April 2020, whereas the same figure had only reached 5 percent the year before (Office for National Statistics Citation2020a, Citation2020b). Similar figures have been reported for other countries (Felstead and Reuschke Citation2020). Approximately 37 percent of the European workforce worked from home in April , with countries like Finland reaching 60 percent (Eurofound Citation2020). In the United States, almost half of the working population worked from home during the same period because of the pandemic (Brynjolfsson et al. Citation2020), and a recent estimate indicated that 37 percent of all jobs in the United States can be permanently performed entirely from home (Dingel and Neiman Citation2020). None of these changes could have happened in the absence of reliable information and communication technology (ICT) infrastructure—in terms of both software and hardware. Whereas software innovations are easily diffused across space and society,Footnote1 the same does not apply for ICT hardware infrastructure such as Internet broadband connectivity.
Using the United Kingdom as a case study, this article aims to understand how the quality and reliability of Internet service, as reflected in experienced Internet speeds during the spring 2020 lockdown, might reinforce or redress the spatial and social dimensions of digital divisions. We employ volunteered geographic data on individual broadband speed tests and state-of-the-art time series clustering methods to create clusters of UK local authorities with similar temporal signatures of experienced Internet speeds. We then associate these clusters of local authorities with their socioeconomic and geographic characteristics to explore how they overlap with or diverge from the existing economic and digital geography of the United Kingdom. Because the quality of Internet infrastructure and services, as well as the concentration of different occupations, is spatially dependent and clustered in space, our approach offers a framework for understanding the impact of and interactions between digital divisions geographically and socioeconomically. Our analysis enables us to better understand how the spatial and social distribution of occupation and online accessibility intersect to enable or hinder the practice of telecommuting at a time of extreme demand. We also consider what lessons can be learned from this time for a future where telecommuting is likely to remain a more common means of accessing work, at least in comparison to the pre-COVID era.
By asking how resilient broadband speeds, and particularly upload speeds, are as experienced in different parts of the United Kingdom during a time of extreme demand, we interrogate which places benefit from the greater economic resilience digital technologies can offer. The structure of this article is as follows. First we review the literature on telecommuting and digital divides to better understand their structural and spatial development prepandemic, and thus their importance to the economic resilience of different places. We then describe our data and methodology. Our Results section first offers a classification of how Internet services vary across clusters of UK local authorities and then assesses whether these clusters replicate or repudiate other socioeconomic and geographic patterns of economic resilience. We conclude with a discussion of the insights we have gained from our new perspective on digital divisions.
Literature Review
From Telecommuting to #WFH
In this analysis, the terms telecommuting and working from homeFootnote2 are used interchangeably, because most remote labor during the COVID-19 crisis was carried out in the homes of individual employees rather than any other location (Eurofound Citation2020). Previous research, however, has explored how telecommuting can occur in other places, including satellite offices or on public transport (Siha and Monroe Citation2006; Felstead Citation2012). Previous research has also used a variety of definitions to measure the level of telecommuting within different workforces, distinguishing between those directly employed, indirectly employed, self-employed, full-time or part-time, and those who use digital technologies to work remotely full days or part days (Bailey and Kurland Citation2002; Haddad, Lyons, and Chatterjee Citation2009; Allen, Golden, and Shockley Citation2015). No matter the definition, the option and capability to telecommute or work from home has never been equally distributed spatially or socioeconomically any more than different industries and employment opportunities have. Studies from the United States, the Netherlands, and the United Kingdom found that telecommuters are most likely to hold professional, managerial, and technical occupations where the workforce is better educated and wealthier and that there is suppressed demand among women and part-time workers (Peters, Tijdens, and Wetzels Citation2004; Singh et al. Citation2013; Headicar and Stokes Citation2016).
Opportunities for working from home during the current pandemic have likewise not been equally spread across the workforce. Dingel and Neiman (Citation2020) indicated that in the United States, managers, educators, and those working in computer-related occupations, finance, and law can easily work from home and that occupations with opportunities to telecommute are associated with higher earnings. This is not the case for the workforce occupied in more spatially fixed occupations, from farming, construction, and manufacturing to hospitality and care services. In the United States, workers in these occupations tend to be lower income, be non-White, not have a university degree, live in rental accommodation, and lack health insurance (Mongey, Pilossoph, and Weinberg Citation2020). Similar trends can be observed for other countries. For example, 75 percent of workers with tertiary education worked from home in Europe during spring 2020, whereas only 34 percent of workers with secondary education and 14 percent of those with primary education did so (Eurofound Citation2020).
Digital Divides and Economic Resilience
The literature describes first-level digital divides in terms of the availability and quality of Internet connectivity, such as that manifest in different geographies in the United Kingdom (Riddlesden and Singleton Citation2014; Philip et al. Citation2017). Second-level digital divides consider the presence or lack of the necessary skills to effectively use digital technologies and the Internet (Van Deursen and Van Dijk Citation2011; Blank and Groselj Citation2014). The third level focuses on the heterogenous returns of Internet usage among different socioeconomic groups and, consequently, how digital technologies can assist in bridging or further enhancing existing socioeconomic divides (Stern, Adams, and Elsasser Citation2009; Van Deursen and Van Dijk Citation2014; Van Deursen and Helsper Citation2015). The potential for these different levels of digital divide to interact is growing in parallel with the digitization of various sectors of the economy and society. For example, Li, Chen, and Wu (Citation2020) highlighted how the intersection of new demands on ICT infrastructure and a paucity of end users means that some areas are being left behind in the rollout of smart applications and services. They argued that this could create a geospatial smart divide, with areas unable to capitalize on the opportunities offered by such applications and services. Likewise, the capability to telecommute is related to all three levels of digital divides but, more important, leads to differentiated outcomes regarding the economic resilience of people and places to overcome a systemic shock such as the current pandemic.
Our understanding of telecommuting as a product of enabled occupations can be described as a manifestation of the third-level digital divide, because those who are able to use digital technologies to work from home benefit from a high rate of return on their use of the Internet in terms of autonomy, flexibility, and time saved from commuting (Peters, Tijdens, and Wetzels Citation2004; Siha and Monroe Citation2006; Singh et al. Citation2013). In some aspects, these returns might have increased during the COVID-19 crisis, when those with the capability to telecommute also have the ability to maintain their employment while protecting their health. The success of these arrangements, however, has been dependent on the first-level digital divide, which is associated with geospatial access to and quality of Internet connectivity. Salemink, Strijker, and Bosworth (Citation2017) provided a systematic review of the prepandemic, first-level digital divide in infrastructure quality between urban and rural areas in various advanced economies. Rural areas, predictably, fare worse. This finding broadly applies in the United Kingdom, where studies that also analyzed broadband speed checks concluded that average speeds are lower in rural areas, something that has not been improved by policy measures to increase competition (Riddlesden and Singleton Citation2014; Nardotto, Valletti, and Verboven Citation2015). In contrast, Riddlesden and Singleton (Citation2014) found that levels of deprivation did not correlate with first-level digital divides, perhaps because many deprived areas benefit from spillover effects of quality installed infrastructure nearby.
As Blank, Graham, and Calvino (Citation2018) highlighted, though, variation in individual Internet availability and uptake is a product of more complex geospatial and demographic characteristics than simple rurality, urbanization, or levels of deprivation. Dense urban areas were shown to suffer more from slowdown during peak hours, although these services were more likely to be improved by increased competition between providers, such as between new entrants and Virgin Media cable connections (Riddlesden and Singleton Citation2014; Nardotto, Valletti, and Verboven Citation2015). The latter were historically available to only 45 percent of premises in the United Kingdom (OfCom Citation2016), where the more lucrative and competitive market originally attracted the cable TV provider. Whether the geospatial variation in infrastructure quality and reliability affects the spatial footprint of telecommuting has not previously been investigated, in part because telecommuting has not previously been a cause of concentrated demand and pressure on Internet services.
Other intersections between digital divides have been subject to study. There are indications that those who purchase high-speed connections consume more data of all sorts and use their connections for a greater variety of purposes (Hauge, Jamison, and Marcu Citation2011). There is also a correlation between access to Internet services and a reduction in household transport spending (Bris, Pawlak, and Polak Citation2017). These studies suggest that better Internet services enable households to make savings and efficiencies, an example of the first-level digital divide reinforcing the third level. Such digital intersections and efficiencies have also changed transportation, connectivity, and the structure of cities during the pandemic. We now have enough data to confirm the drastic alteration observed in the space–time geography of cities around the world in the last year (e.g., Google Citation2020; Shibayama et al. Citation2021). Yet, although there is a broad agreement that these changes during the pandemic have played a pivotal role in stopping the spread of the virus (Jia et al. Citation2020; Mu, Yeh, and Zhang Citation2020; Yang et al. Citation2020), the extent to which the increased levels of working from home, the consequent decrease in commuting flows, and the altered structure of cities will remain postpandemic is the subject of considerable debate in the literature.
Meanwhile, multilayered digital divides could also intersect with material divides and the economic geography of the United Kingdom. The regional economic resilience literature underlines the differentiated capacity of cities and regions to escape or recover from economic crises (Martin Citation2012; Kitsos and Bishop Citation2018). Because different places have different industrial and occupational profiles, these affect their aggregated potential capacity for telecommuting. Such profiles are associated with long-standing inequalities in the United Kingdom and their spatial representation as a north–south divide (Martin Citation1988). Various studies have illustrated severe inequalities between the northern and southern regions of England in terms of skills and human capital, unemployment, productivity, and prosperity (Lee Citation2014; Dorling Citation2018; McCann Citation2020). Some scholars have even argued that the United Kingdom suffers from some of the highest levels of interregional inequalities in the Global North (McCann Citation2016; Gal and Egeland Citation2018). All three levels of digital divides are associated with or shaped by the geography of the United Kingdom. Yet this is the first time that the intersection of digital and material divides is relevant to understanding the economic resilience of places and large swaths of the population, as digital technologies became an essential tool of productivity during the COVID-19 pandemic.
The extreme demand during the pandemic thus provides a new opportunity to understand how Internet infrastructure quality, and reliability affects telecommuting, particularly in light of the high volumes of bandwidth-intensive video conferencing required to avoid the face-to-face contact that could increase the spread of infection. We seek to answer how Internet service resilience could contribute to or reduce economic resilience when the latter is dependent on the capability to work from home. We also aim to improve our understanding of the impact of first-level digital divisions on telecommuting, in terms of both geospatial and temporal quality of service, and whether this results in more fundamental third-level digital divisions between local geographies than has previously been perceived.
Methods and Data
Time-Series Clustering
Our chosen methodological framework is cluster analysis, which can be defined within machine learning approaches as an unsupervised learning task, partitioning unlabeled observations into homogeneous groups known as clusters (Montero and Vilar Citation2014). The key idea is that observations within clusters tend to be more similar than observations between clusters. Clustering is particularly useful for exploratory studies because it identifies structures within the data (Aghabozorgi, Shirkhorshidi, and Wah Citation2015). Cluster analysis is widely used in geography (Everitt Citation1974; Gordon Citation1977), for example, to solve regionalization problems (Niesterowicz, Stepinski, and Jasiewicz Citation2016). Clustering methods are also the basis of geodemographics, a research domain that aims to create small area indicators or typologies of neighborhoods based on diverse variables (Harris, Sleight, and Webber Citation2005; Singleton and Longley Citation2009). These studies usually employ cross-sectional data, and most clustering problems in geography deal with observations that are fixed in time. For this article, however, we are interested in Internet speeds, which vary over time. Therefore, we create clusters of local authorities in the United Kingdom with similar temporal signatures of experienced Internet speeds.
To do so, we employ time series clustering methods, which have been developed to deal with clustering problems linked to, for instance, stock or other financial data; economic, governmental, or medical data; as well as machine monitoring (Aggarwal, Hinneburg, and Keim Citation2001; Warren Liao Citation2005; Aggarwal and Reddy Citation2013; Hyndman, Wang, and Laptev Citation2015). The main challenge, which does not apply to cross-sectional clustering problems, is data dimensionality, with a multiplicity of data points for every individual object included in the data set and how their value changes dynamically as a function of time (Aghabozorgi, Shirkhorshidi, and Wah Citation2015). This high dimensionality leads to (1) computational and algorithmic challenges regarding handling these data and building algorithms to perform clustering over long time series and (2) open questions regarding the choice of similarity measures to cluster similar times series objects together considering the whole length of the time series and overcoming issues around noise, outliers, and shifts (Lin et al. Citation2004; Aghabozorgi, Shirkhorshidi, and Wah Citation2015).
For this article we use a category of time series clustering methods known as shape-based approaches. These methods match two separate time series objects based on the similarity of their shapes through the calculation of distances between the shapes and are better equipped to capture similarities between short-length time series (Aghabozorgi, Shirkhorshidi, and Wah Citation2015), such as our data. We thus identify clusters of UK local authorities with similar temporal signatures (i.e., shapes) of experienced Internet speeds. The clusters are identified using the common partitioning algorithm, where no clusters overlap, known as k-means. This iterative algorithm is popular because of the simplicity of the implementation and the interpretability of the results. It begins with defining the desired number of clusters: k. Then each observation is randomly assigned to a cluster from the space. This initial cluster assignment is followed by iterations to minimize the distance between the centroids of the clusters and the observations assigned to these clusters (James et al. Citation2013).
There are a number of differences between the application of k-means for cross-sectional and time series data. Instead of creating clusters around centroids, a common approach is to create clusters around medoids, which are representative time series objects with a minimal distance to all other cluster objects (Sardá-Espinosa Citation2019b). Also, instead of calculating the Euclidean distance between centroids and data points, more complex distance measures need to be employed to capture the similarity between a time series object and a medoid. A common distance measure for shape-based time series clustering is dynamic time warping (DTW), an algorithm comparing two time series objects to find the optimum warping path between them. DTW is widely used to overcome limitations linked to the use of Euclidean distance (Berndt and Clifford Citation1994; Ratanamahatana and Keogh Citation2004; Sardá-Espinosa Citation2019b). The R package dtwclust has been used for the time series clustering (Sardá-Espinosa Citation2019a).
Experienced Broadband Speeds
To assess the Internet quality and reliability across local authorities in the United Kingdom, we use unique data comprising individual Internet speed tests from Speedchecker Ltd.Footnote3 This is a private company that allows Internet users to check their own broadband upload and download speeds and stores every speed-check with timestamp and geolocation information. These data have been used before to assess digital divides (Riddlesden and Singleton Citation2014) and the impact of local loop unbundling regulatory processes (Nardotto, Valletti, and Verboven Citation2015), and we followed the former’s approach to remove outliers. By using these volunteered geographic data, we are able to assess the Internet speed experienced by users, which might differ from the maximum speeds advertised by Internet service providers. Indeed, those who seek to test their broadband are most likely to do so because they are experiencing slower speeds than expected, although any skew toward slower speeds is balanced by the likelihood that those who test their broadband are also more technologically savvy or have purchased higher speed packages that are not delivering the promised level of service.
We are particularly interested in upload speeds and the frequency of speed tests over the period from March to May 2020, because government statements indicate that this encompasses the period when UK workers were told to work from home if at all possible (GOV.UK Citation2020). Schools and various retail, leisure, and hospitality businesses were closed from late March, and restrictions were gradually eased from late May. Average upload speeds are slower than average download speeds, at Mb/s mean upload speed for the whole sample, compared to
Mb/s for download speeds, but they are also less associated with Internet-based, high-demand, leisure activities such as video streaming. Therefore, upload speeds are more relevant to work-related activities such as uploading documents or two-way audio, video, and text-based communication systems.
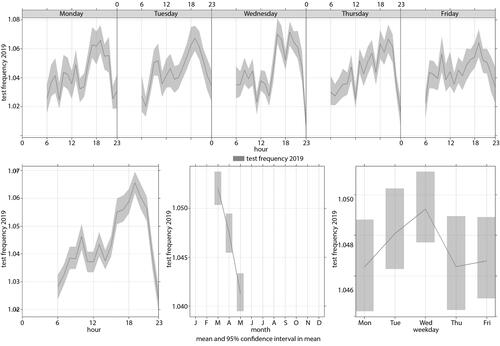
The frequency of speed tests was important in identifying the temporal profile that would give us most insight into experienced Internet service and resilience over units of time. Although there is an overall trend of increased testing from March to April and then a slight reduction from April to May, this trend masks substantial variation by not only the day of the week but also time of day, as can be seen in .Footnote4 Thus, a daily aggregation of upload speeds would mask the variation in experienced service over the course of each weekday. Furthermore, the importance of this variation is highlighted by a comparison with the same period in 2019, as in , when the volume of testing and thus of experienced Internet service quality peaked in the evening, presumably in response to demand for leisure activities and download speeds. In contrast, the majority of the increase in testing in 2020 is during the working day, creating a new morning peak in . Therefore, we include a measure of hourly variation in our temporal profiles to reflect the change in users’ perceptions of the workday reliability of Internet services.
Figure 1 Speed tests over time, 2020.
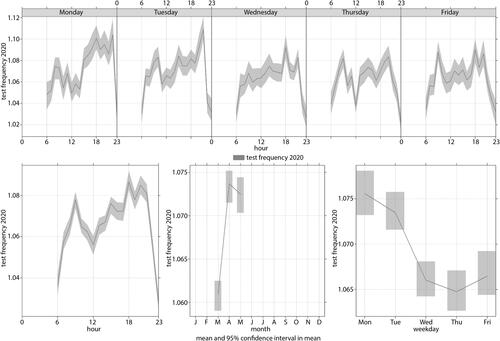
Figure 2 Speed tests over time, 2019.
There were insufficient observations, however—only speed tests per local authority district (LAD) on average—for each working hour of each working day in each LAD to profile speeds at that level of detail. Spatial aggregation was also necessary because we could not follow individuals or households and connect data points. Therefore, we aggregate the 241,088 individual, geolocated, and time-stamped speed-checks during the thirteen weeks of March to May inclusive for weekdays by each hour of the day and day of the week. Because our research aims to identify the geography of Internet service resilience for work purposes, bank holidays and the hours between midnight and 6:00 a.m. were excluded, as well as weekend days. The composite week time series thus comprises eighteen hours multiplied by five weekdays or ninety time points per series. The time series were calculated for each of the 382 LADs in the United Kingdom and standardized, and then a k-means partitioning around medoids clustering algorithm was applied using DTW. We initially ran the algorithm for
calculated the cluster validity indexes, and then ran the subsequent multinomial regression—see the end of this section for more details for the different k. Following Sardá-Espinosa (Citation2019b), to identify the optimal k we used the majority vote for the following cluster validity indexes: Silhouette (max), Score function (max), Calinski–Harabasz (max), Davies–Bouldin (min), Modified Davies–Bouldin (DB*, min), Dunn (max), and COP (min). Nevertheless, we opted against using the optimal
solution, because it was too large to allow for communicable LAD clusters. Instead, we opted for a smaller
which led to a rather similar spatial pattern and, importantly, to a much higher R2 in the subsequent explanatory regression (0.44 instead of 0.34).
In the next section, we review the temporal profile of upload speed by hour of the day and day of the composite week for each of the clusters. Because the quality and reliability of Internet services vary in time and space due to both supply- and demand-side influences, we also use a number of different measures to describe experienced upload speeds per cluster. These include (1) mean experienced connection speed, (2) standard deviation or the amount of fluctuation from the mean, and (3) the variation in speeds during the new morning peak of testing when working from home is more likely to take place. We take account of all three measurements to determine how resilient broadband speeds are as experienced in different parts of the United Kingdom during a time of extreme demand.
The cause of these different experiences of broadband resilience could vary between and within clusters, because they might reflect either patterns of demand or quality of infrastructure. Our approach is also limited by potential endogeneity, because, for example, better quality connections with high mean speeds might enable more working from home, but greater demand can cause slower speeds, less reliability, or greater variability of speed at different times of day or week. Therefore, we avoid attributing any cause to our analysis of the experienced level of quality and reliability of upload speeds. Instead, we run an auxiliary regression to understand how the spatial and temporal patterns of Internet service relate to the economic geography of the United Kingdom. More specifically, we estimate the following multinomial logit model:
(1)
(1)
Based on the outcomes of the time series clustering, we identify J distinct and crisp clusters. We then regress this cluster membership against a vector of socioeconomic and geographic variables, which are discussed in detail later. Because we cannot identify individuals or households and consequently aggregated our data at the LAD level, our results offer correlations between the socioeconomic characteristics of certain geographic locations and Internet service quality, not a record of who was telecommuting. Such individual data could be found though surveys, but these offer less detailed information about the experience of Internet resilience due to enforced demand, which is the main contribution of this article. Our auxiliary regression, therefore, provides an indication of how Internet connectivity can reinforce or redress existing spatial and social inequalities in different places. It opens a path, however, to future research by highlighting the importance of understanding of how telecommuting capabilities and digital infrastructure divisions intersect.
Results
One Upload Clusters and Cluster Description
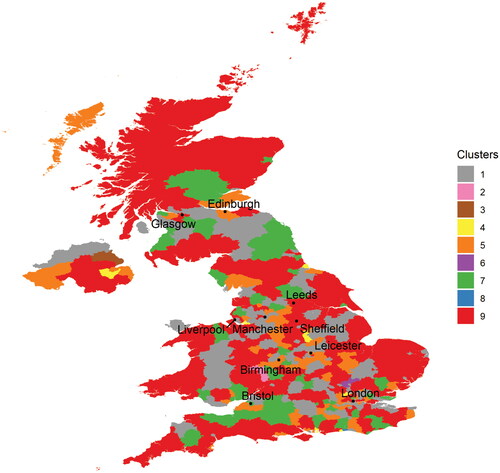
The temporal profiles of the local authority clusters are summarized in and , to provide an overview of the quality and reliability of experienced broadband in different parts of the United Kingdom. shows a composite profile of mean upload speeds per hour per day for each of the largest six clusters, in terms of the LAD membership and population.
Figure 3 Temporal profiles for upload speed clusters.
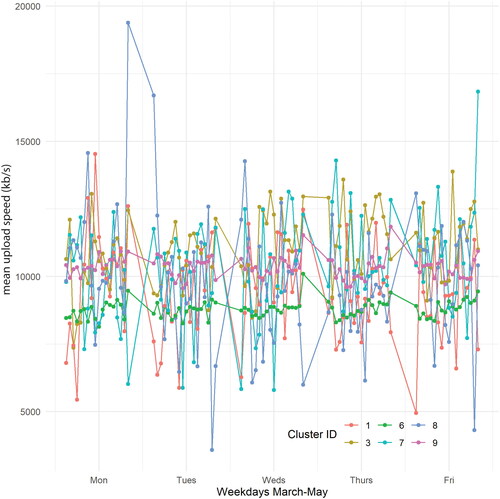
Table 1. Upload speed cluster characteristics
The largest cluster, comprising 229 local authorities and over 40 million people, is Cluster 6, which has the slowest aggregate mean upload speed of any cluster and the highest ratio of the standard deviation to the mean. This suggests that those living in local authorities in this cluster experienced some of the lowest quality broadband services in terms of upload speeds and reliability in the United Kingdom. As shown in , though, some of the most rural areas of the United Kingdom are included in this cluster. If these areas suffer most from first-level digital divides as described in the literature review, the low speeds in rural areas might be pulling down the averages in other areas in this largest cluster. Also, because the areas are clustered by their temporal profile across the working week, the graph in indicates that speeds in Cluster 6 are some of the more reliable. confirms that upload speeds in Cluster 6 during the morning peak from 9:00 to 10:59 were, on average, only 4.5 percent slower than in the evening peak period between 19:00 and 20:59, when entertainment purposes are likely to be using the most bandwidth.
Figure 4 Upload speed clusters for local authority districts.
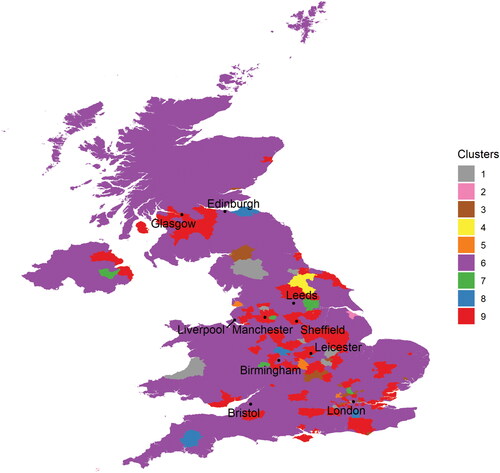
Those living in the second largest cluster—Cluster 9 with 115 LADs and 21.5 million people—experienced aggregate mean upload speeds of more than 1.5 Mb/s faster than those in Cluster 6, a lower ratio of standard deviation to mean, and almost the same upload speeds in the morning peak as during the evening peak. Indeed, the temporal profile for Cluster 9 in , like that for Cluster 6, is fairly flat. Although it is likely that the large numbers of tests being performed by the large populations in these two clusters of LADs result in less varied averages to show in the graph, the method of shape-based clustering suggests that these results indicate that the majority of the UK population experience less temporal variation and so belong in these two clusters. The results also confirm that those in Cluster 9 experienced a consistently better service during lockdown than those in Cluster 6, in terms of both average speed and reliability.
Of the smaller clusters, the 15 LADs in Clusters 1 and 8, home to more than 1.4 million people, not only experience fairly average upload speeds and high ratios of standard deviation to the mean but also experience much lower speeds during the morning peak than the evening peak. From the large spikes and dips shown in , it is likely that this poor reliability or consistency of morning Internet speeds was more noticeable to those in Cluster 1, whereas those in Cluster 8 experienced the lack of reliable service as a problem throughout the day. Meanwhile, Cluster 7 experiences speeds quite similar to those of Cluster 9 and a not too dissimilar standard deviation, but mean speeds in the morning peak are almost 10 percent lower than during the evening peak. Cluster 3 boasts speeds almost 1 Mb/s higher again but suffers from an even greater slowdown in the morning peak. In comparison, Clusters 2 and 5, home to a little less than half a million people, experience not only above-average mean speeds but also faster speeds in the morning peak compared to the evening. Thus, in the five LADs in these two clusters, the temporal profile of Internet use might be closer to what might have been expected prepandemic.
It is worth noting here that when we apply the same methods to upload speed data for the same time period in 2019, the spatial distribution and composition of the nine clusters of LADs are very different (see Appendix B). This difference is an indication of the changes in the temporal profile of Internet usage that took place during the pandemic and that would be independent of any wider trend in improving Internet services.
In summary, the reliability of Internet services during the working day appears to have altered for the vast majority of locations due to increased use from residents told to stay at home and, if they were fortunate, work from home. Yet this experience has been different in different locations. In particular, LADs in Cluster 9 experienced higher speeds and more resilient broadband Internet than those in the largest cluster, Cluster 6. Those in Clusters 3 and 7 also experienced higher mean speeds and better service reliability, and can be more confident that they are on the right side of the first-level digital divide and that their more resilient ICT infrastructure and services can robustly support higher levels of telecommuting. On the other hand, although high levels of telecommuting might be the cause of morning speeds over 15 percent lower than those in the evening, those in Clusters 1 and 8 also experienced lower mean speeds than Clusters 3, 7, and 9 but not as low as Cluster 6. Although the differences might not be large, the lower upload speeds in Cluster 6 or the poor reliability in Clusters 1 and 8 could still have had implications for economic resilience if combined with other types of digital divide. This potential will be explored in the next section.
Post-clustering Regression Analysis
Using an auxiliary multinomial logit regression, we test whether the clusters that have higher mean speeds and more reliable services do indeed consist of LADs that are more urban or closer to major urban areas and are more likely to benefit from a choice of high-quality Internet services. This part of the regression aims to confirm any first-level digital divides. Next, to better understand how the clusters fare in relation to the second-level digital divide, we consider which LADs in which clusters have a higher proportion of occupations where the nature of the work and the skills that occupation employs enable telecommuting. Finally, we consider the rate of return on Internet use, or third-level digital divides, by reviewing which clusters have the highest earnings and job density and also which clusters experienced the highest share of population furloughed during this period in the pandemic.
The results of the auxiliary regression are presented in . The dependent variable is the LAD cluster membership as described in the methods and data section and EquationEquation 1(1)
(1) . Each column represents a different cluster. The reference case is Cluster 4, which includes only the local authority of Hambleton in North Yorkshire, a rural area of just over 90,000 people. Mean experienced upload speed in Cluster 4 (see ) is close to the preclustered average for the whole sample (9.3 Mb/s). The standard deviation for Cluster 4 and the difference between average speeds in the morning compared to the evening peak periods, however, are indications of worse reliability than many of the other clusters. Hence, the results in should be seen as relative rather than absolute probabilities.
Table 2. Auxiliary multinomial regression of upload speed clusters on socioeconomic and geographic local authority district variables
First, we control for the number of speed tests run per cluster inhabitant between 9:00 and 10:59 as well as the share of fast Virgin Media Internet connections.Footnote5 Regarding the former, we expect people in LADs with more unreliable connections to test their Internet speeds more often, and the results show that those in Cluster 6 are by far the most concerned about reliability at that time of day. Meanwhile, those in Clusters 2, 3, and 9 benefit from a higher proportion of Virgin connections, which is an indication that people in these clusters are more likely to live in urban areas, with more profitable broadband markets and a better choice of broadband services. We also employ distance from London and from the nearest metropolitan area (including London) as two variables depicting peripherality and urban structure. Although significant, the pattern of coefficients of these variables is inconclusive in confirmed first-level digital divides. Even though London was one of the ten largest metropolitan areas in England that, along with Glasgow and Cardiff, were identified to calculate the variable estimating the impact of distance from the center of a metropolitan area, the coefficients for the two variables are mostly small and the signs for some are opposite.
When looking at the constituent authorities (see the full list of LADs in Appendix A as well as ), however, Cluster 9 is clearly more urban, including thirteen of thirty-two London boroughs, five of the seven constituent LADs of the West Midlands conurbation, nine of the ten boroughs of Greater Manchester, and five of nine other large metropolitan areas coded in for the “distance to nearest met area” variable. Cluster 9 also includes the other main cities in the East Midlands, Leicester, and Derby, as well as smaller cities known for their knowledge economy, such as Oxford and Milton Keynes. As previously mentioned, though, there is more noise within the variables for the two largest clusters than the smaller ones, and Cluster 6 also contains many urban areas. These include sixteen London boroughs, Birmingham City, Bolton in Greater Manchester, Leeds, Liverpool, Newcastle, and Bristol, as well as small cities with knowledge economies such as Cambridge, Edinburgh, and Reading and its neighbors in the high-tech agglomeration of the Thames Valley. Yet Cluster 6 also includes some of the most rural areas in the country, showing how important it is to interpretation to consider the membership of the cluster as well as the regression results.
The coefficients in demonstrate that those in Cluster 6 were more likely to hold managerial, tech, and professional jobs than those in Cluster 9 and were the least likely to be furloughed of any cluster. Thus, although speeds were slow and not as reliable during the morning peak as in Cluster 9, the skills that enabled telecommuting also enabled greater returns from doing so, despite lower than average earnings. Cluster 6 also has the second highest job density, with more jobs to keep. Likewise, those in LADs in Clusters 1 and 8 had the highest and second highest proportions of residents working in tech or managerial occupations despite suffering from lower speeds and unreliable services, another mismatch between first- and second-level digital divides. Yet unlike Cluster 6 and despite occupations with better digital skills, Cluster 8, with its five peripheral suburban areas in the Midlands, Scotland, and south of London, as well as rural West Devon, saw the third highest proportion of its working population furloughed. It also had the second lowest average earnings in 2019, suggesting that its population was more likely to be on the wrong side of the third-level digital divide before, as well as during the pandemic. In contrast, the nine LADs of Cluster 1, which include more rural areas, plus Westminster in central London had the lowest earnings of any cluster but also the lowest level of furlough after Cluster 6.
The regression results for Cluster 7 also reveal the complexity of intersecting and diverging digital divides. Along with Clusters 3 and 9, the preceding analysis suggested that this cluster was on the right side of any first-level digital divides, yet the regression shows that it has the lowest proportion of Virgin connections. It is furthest from a metropolitan area but closest to London. The five LADs in Cluster 7 are all suburban, making it sensible that the cluster is in the group with better infrastructure, but none are central urban boroughs and, along with a London suburb, Leeds suburb, Manchester suburb, and West Midlands suburb, the fifth LAD is outside Belfast. Belfast was not included among the metropolitan areas, and although there has been substantial investment in high-speed broadband in Northern Ireland in recent years, including by Virgin, take-up might still lag behind historic networks in other urban markets.
Cluster 7 has the lowest proportion of residents currently employed in professional occupations and among the lowest proportions in managerial or technical occupations. This potentially suggests a low level of skills to take advantage of the quality Internet service available, a second-level digital divide. Cluster 7 also has the lowest job density. With the largest proportion of skilled tradespeople and the second highest number of businesses per inhabitant, however, those in Cluster 7 ranked second in terms of earnings in 2019. On the other hand, the lack of some of the occupations most likely to telecommute during lockdown might have contributed to a substantial proportion being furloughed in 2020 and even to the relative reliability of broadband speeds compared to many of the other smaller clusters.
Cluster 3, meanwhile, had the greatest proportion of its workforce furloughed of any cluster, despite having the highest job density and the second highest average speeds. Ranking in the middle for most of the occupations estimated, at least some of its population should have the skills to work from home. The geography would suggest economic advantage as well, with eight of its twelve LADs in the south of England, including two London boroughs, four suburban areas north of London, and the two tightly bounded urban areas of Eastbourne and Ipswich—a greater proportion than any other cluster. Yet geographic position and job density do not appear to equate to particularly high average earnings in 2019, nor did they protect residents from furlough in 2020. In contrast, Cluster 5, comprised of three suburban districts in the Northwest, Midlands, and the London green belt, had the highest average earnings in 2019, despite low levels of residents working in managerial, tech, and professional occupations. Suburbs are considered the most likely urban form in which telecommuters live (de Abreu e Silva and Melo Citation2018), yet the contrast between these small, mainly suburban clusters—7, 3, and 5—suggests that they are not all equally economically resilient in a pandemic.
Cluster 2, which, like Cluster 5, had faster morning broadband speeds than evening speeds, as shown in , contains two remote LADs, the Isles of Scilly and Northeast Lincolnshire. Although the low demand might be due to the fewest residents in tech occupations, it might also be due to high numbers of retired people. Rural areas such as those in Cluster 2 are often home to many older, retired people (Blank, Graham, and Calvino Citation2018), which could also explain some of the contradictions in Cluster 1 with its low levels of furlough and low earnings, whereas the presence of Westminster in that cluster might be why there are the highest levels of tech and managerial occupations.
In summary, the regression results indicate the complexity of measuring second- and third-level digital divides within spatial aggregations where the geography of first-level digital divides has been captured using time series clustering of experienced broadband upload speeds as a product of reliability, not just availability. Although the differences in mean speeds between clusters were not large, the temporal clustering of Internet resilience showed much greater variation and was not spatially dependent on distance to large urban areas or relative location. Internet resilience supports a wide range of small and large urban economies but also fails, or at least frustrates a wide range of other urban economies, as demonstrated by the number of morning peak tests per capita run in Cluster 6. Yet our analysis of the likelihood of furlough within the population, especially in the smaller suburban Clusters 7, 3, 5, and 8, shows that digital divides were as likely to diverge as intersect during the pandemic and did not necessarily overlap with prior economic divides. With a much greater share of the population likely to continue to work from home in the future, and with changing attitudes toward residential locations, our analysis suggests that first-level digital divides should be seen as a function of reliability as well as availability of upload speeds as well as download speeds and of greater spatial variation than might have previously been considered.
Discussion and Conclusions
Our analysis demonstrated that the temporal profiles of seven of our nine clusters had slower upload speeds in the morning than in the evening. The opposite is likely to have been the norm prior to the pandemic, because level of demand and bandwidth management is the most common cause of temporal variation in experienced speeds and why evening download speeds, rather than daytime upload speeds, have been used to benchmark the performance of Internet services. Thus, the new patterns can be taken as evidence of widespread telecommuting and other daytime Internet use that changed the temporal profile of Internet activity throughout the United Kingdom, not just in areas with more digital industry or better skills. Furthermore, upload speeds have not previously been seen as integral to universal service, considering that there has never before been such extreme demand for telecommuting and operations such as video calls. Yet those in the largest cluster, Cluster 6, clearly experienced lower upload speeds. Their speeds were also less reliable, perhaps because they had higher levels of demand than the second largest cluster, Cluster 9, where many more employees were furloughed. Indeed, those with the skills and jobs to work from home were often left with the least robust services and greatest slowdown.
Therefore, home-based digital infrastructure that considers upload speeds and working day reliability as well as availability are likely to be particularly important in a future where telecommuting might be a more common means of accessing work and broadband services must be fit for purpose. Although the long-term effects of such drastic changes in telecommuting and attitudes toward working from home are difficult to predict, the reliability of home broadband services deserves more consideration than in the past. This would represent a switch from previous demand-side broadband policies in the United Kingdom, which tended to be aimed at supporting small and medium enterprises (Henderson Citation2020). Such policies were based on previous research regarding the productivity effects of broadband infrastructure (DeStefano, Kneller, and Timmis Citation2018). This stream of research, however, tended not to consider residential locations as places that host economic activity. Such policies also made some assumptions about the quality of service in residential markets that could be assured without government intervention—an assumption that our analysis suggests is not entirely accurate.
Policy and development proposals should also consider how the potential changes wrought by the pandemic span various aspects of economy and society. Changes to transportation planning due to altered commuting patterns also imply changes in land use and urban planning to accommodate people who work from home (Budnitz, Tranos, and Chapman Citation2020; Elldér Citation2020). Productivity and innovation changes will reflect on changes in agglomeration externalities and the attraction of large cities (Nathan and Overman Citation2020). Further research might be able to measure the economic resilience of the different clusters of places discussed in this article once this pandemic is firmly past. Our analysis demonstrates, however, that the economic resilience made possible by working from home cannot be understood without considering the underpinning digital divides and cannot be achieved without planning for how the levels of digital, social, and economic divides might intersect. For example, our results suggest that broadband policies cannot improve the economic resilience of places where the industrial structure does not align with occupations that incorporate the digital skills and capabilities to work from home. Such places instead experienced higher proportions of their labor force being placed on furlough.
Early research on COVID-19 and cities also speculated on the changes that potential extensive post-COVID working from home patterns might generate for spatial structure: from more walkable cities and more localized production and consumption patterns to more extensive urban sprawl, the decline in public transportation, and increased private car usage (Batty Citation2020). Despite the essential role it played during the pandemic, less effort has been spent in understanding the current and future role of digital infrastructure. Our results indicate that probably for the first time the future of cities and spatial structure are so intertwined with digital infrastructure. If the post-COVID world is a world with extensive working from home, then we need to build, among other things, resilient digital infrastructure capable of bridging the first layer of the digital divide. Contrary to previous broadband business and deployment plans, emphasis should be placed not only on download speeds but also on upload speeds (Brake Citation2020). In essence, COVID-19 accentuated the old argument, now more valid than ever: Digital infrastructure, just like any other network infrastructure, only becomes visible when it stops working (Star Citation1999; Tranos Citation2013).
On the other hand, the nuanced picture we gained through our analysis of the UK case study suggests that being on the right side of the second-level digital divide had a greater impact on economic resilience and therefore the third-level digital divide than having quality Internet connectivity. Our regression results for Clusters 1 and 6 are a demonstration of this. Our analysis shows both the intersections and divergences of digital and economic division. Almost all of the largest urban areas in the United Kingdom, as well as many smaller cities, were split between the largest two clusters—6 and 9—and both contain LADs that are centers of the knowledge economy, from Cambridge in the former to Oxford in the latter or have high concentrations of digital businesses, like Reading in the former and Milton Keynes in the latter (UK and Tech City 2018). Yet although LADs in Cluster 9 were able to benefit both from reliable Internet connections and populations familiar with working from home to capitalize on their digital infrastructure, they appeared to have a lower rate of return in the pandemic, with far greater numbers furloughed. Is this an indication of historic economic division, as well as the third-level digital divide, in cities in the North and Midlands unable to capitalize on their digital infrastructure? Meanwhile, did the greater presence in London and the south of LADs in Cluster 6, as well as the inclusion of many rural areas less affected by the pandemic, help those in this cluster be more resilient and gain greater returns, despite using less reliable Internet services? Further research would be necessary to pry apart the detail, particularly in the largest clusters where averages are less distinct.
In conclusion, this article offers a new perspective on telecommuting from the viewpoint of the complex web of digital divides. We employ novel data regarding experienced upload speeds and time series clustering methods, a family of unsupervised machine learning techniques that are rarely used in geographical research. Fast, reliable Internet connections are necessary for the population to be able to work from home. Although not every place hosts individuals in occupations that allow for telecommuting or with the necessary skills to effectively use the Internet to telecommute, this article raises the issue that places might depend on good Internet reliability as well as connectivity to achieve economic resilience in a period like the current pandemic when Internet resilience is so vital.
Supplemental Material
Download HTML (21.2 MB)Acknowledgments
The authors thank https://www.broadbandspeedchecker.co.uk/ for providing the main data used for this article.
Supplemental Material
The LAD upload clusters as well as the mean morning and evening upload speeds are presented in the Supplemental Material. Download the .html file and open it using your Internet browser. Hovering over the LAD polygons provides the mean Internet speeds. Supplemental data for this article can be accessed on the publisher’s site at http://dx.doi.org/10.1080/24694452.2021.1939647.
Additional information
Notes on contributors
Hannah Budnitz
HANNAH BUDNITZ is a Research Associate in Urban Mobility at the Transport Studies Unit in the School of Geography and the Environment at the University of Oxford, Oxford OX1 3QY, UK. E-mail: [email protected]. Her research interests include transport’s role in tackling climate change, how shared and virtual transport options influence the flexibility of activity patterns, the potential of data and technology to deliver innovative transport solutions, and the basic interactions between land use and accessibility, sustainability and resilience.
Emmanouil Tranos
EMMANOUIL TRANOS is a Reader in Quantitative Human Geography at the University of Bristol, School of Geographical Sciences, Bristol BS8 1RL, UK, and a Fellow at the Alan Turing Institute. E-mail: [email protected]. His research has been exposing the spatial dimensions of digital technologies and the digital economy from their early stages until today. He has published on issues related to the geography of the internet, the economic impacts that digital technologies can generate on cities and regions and the position of cities within spatial, complex networks.
Notes
1 See, for example, the huge success of videoconferencing apps such as Zoom (Marks Citation2020).
2 See also the popular social media hashtag #WFM.
4 and were created with the R package openair (Carslaw and Ropkins Citation2012).
5 See Appendix C for the descriptive statistics.
Related Research Data
References
- Aggarwal, C. C. , A. Hinneburg, and D. A. Keim. 2001. On the surprising behavior of distance metrics in high dimensional space. In Database Theory – ICDT 2001. ICDT 2001. Lecture Notes in Computer Science, ed. J. Van den Bussche and V. Vianu, vol. 1973, 420–34. Berlin, Heidelberg: Springer.
- Aggarwal, C. C., and C. K. Reddy. 2013. Time-series data clustering. In Data clustering: algorithms and applications, ed. C. Aggarwal Charu and C. K. Reddy, 1. Boca Raton, FL: CRC Press.
- Aghabozorgi, S., A. S. Shirkhorshidi, and T. Y. Wah. 2015. Time-series clustering—A decade review. Information Systems 53:16–38. doi: https://doi.org/10.1016/j.is.2015.04.007.
- Allen, T. D., T. D. Golden, and K. M. Shockley. 2015. How effective is telecommuting? Assessing the status of our scientific findings. Psychological Science in the Public Interest 16 (2):40–68. doi: https://doi.org/10.1177/1529100615593273.
- Bailey, D. E., and N. B. Kurland. 2002. A review of telework research: Findings, new directions, and lessons for the study of modern work. Journal of Organizational Behavior 23 (4):383–400. doi: https://doi.org/10.1002/job.144.
- Batty, M. 2020. The Coronavirus crisis: What will the post-pandemic city look like? Environment and Planning B: Urban Analytics and City Science 47 (4):547–52. doi: https://doi.org/10.1177/2399808320926912.
- Berndt, D. J., and J. Clifford. 1994. Using dynamic time warping to find patterns in time series. In KDD workshop, Vol. 10, 359–70. Seattle, WA.
- Blank, G., M. Graham, and C. Calvino. 2018. Local geographies of digital inequality. Social Science Computer Review 36 (1):82–102. doi: https://doi.org/10.1177/0894439317693332.
- Blank, G., and D. Groselj. 2014. Dimensions of Internet use: Amount, variety, and types. Information, Communication & Society 17 (4):417–35. doi: https://doi.org/10.1080/1369118X.2014.889189.
- Brake, D. 2020. Lessons from the pandemic: Broadband policy after COVID-19. Technical report, Information Technology and Innovation Foundation, Washington, DC.
- Bris, M., J. Pawlak, and J. W. Polak. 2017. How is ICT use linked to household transport expenditure? A cross-national macro analysis of the influence of home broadband access. Journal of Transport Geography 60:231–42. doi: https://doi.org/10.1016/j.jtrangeo.2017.03.012.
- Brynjolfsson, E., J. J. Horton, A. Ozimek, D. Rock, G. Sharma, and H.-Y. TuYe. 2020. COVID-19 and remote work: An early look at US data. Technical report, National Bureau of Economic Research, Cambridge, MA.
- Budnitz, H., E. Tranos, and L. Chapman. 2020. Telecommuting and other trips: An English case study. Journal of Transport Geography 85:102713. doi: https://doi.org/10.1016/j.jtrangeo.2020.102713.
- Carslaw, D. C., and K. Ropkins. 2012. openair—An R package for air quality data analysis. Environmental Modelling & Software 27–28:52–61.
- de Abreu e Silva, J., and P. C. Melo. 2018. Does home-based telework reduce household total travel? A path analysis using single and two worker British households. Journal of Transport Geography 73:148–62. doi: https://doi.org/10.1016/j.jtrangeo.2018.10.009.
- DeStefano, T., R. Kneller, and J. Timmis. 2018. Broadband infrastructure, ICT use and firm performance: Evidence for UK firms. Journal of Economic Behavior & Organization 155:110–39. doi: https://doi.org/10.1016/j.jebo.2018.08.020.
- Dingel, J. I., and B. Neiman. 2020. How many jobs can be done at home? Working Paper 26948, National Bureau of Economic Research, Cambridge, MA. http://www.nber.org/papers/w26948.
- Dorling, D. 2018. Peak inequality: Britain’s ticking time bomb. Bristol, UK: Policy Press.
- Elldér, E. 2020. Telework and daily travel: New evidence from Sweden. Journal of Transport Geography 86:102777. doi: https://doi.org/10.1016/j.jtrangeo.2020.102777.
- Eurofound. 2020. Living, working and COVID-19. COVID-19 series. https://www.eurofound.europa.eu/publications/report/2020/living-working-and-covid-19.
- Everitt, B. 1974. Cluster analysis. London: Heinemann Educational.
- Felstead, A. 2012. Rapid change or slow evolution? Changing places of work and their consequences in the UK. Journal of Transport Geography 21:31–38. doi: https://doi.org/10.1016/j.jtrangeo.2011.10.002.
- Felstead, A., and D. Reuschke. 2020. Homeworking in the UK: Before and during the 2020 lockdown. WISERD Report. Cardiff: Wales Institute of Social and Economic Research. https://wiserd.ac.uk/publications/homeworking-ukand-during-2020-lockdown
- Gal, P., and J. Egeland. 2018. Reducing regional disparities in productivity in the United Kingdom. OECD Economics Department Working Papers 1456, OECD Publishing.
- Google. 2020. See how your community is moving around differently due to COVID-19. Google Mobility Reports. Accessed March 18, 2021. https://www.google.com/covid19/mobility/.
- Gordon, A. D. 1977. Classification: Methods for the exploratory analysis of multivariate data. London: Chapman and Hall.
- GOV.UK. 2020. News and communications. https://www.gov.uk/search/news-and-communications?level_one_taxon=5b7b9532-a775-4bd2-a3aa-6ce380184b6c&order=updated-oldest.
- Haddad, H., G. Lyons, and K. Chatterjee. 2009. An examination of determinants influencing the desire for and frequency of part-day and whole-day homeworking. Journal of Transport Geography 17 (2):124–33. doi: https://doi.org/10.1016/j.jtrangeo.2008.11.008.
- Harris, R., P. Sleight, and R. Webber. 2005. Geodemographics, GIS and neighbourhood targeting. Vol. 8. Chichester, UK: Wiley.
- Hauge, J., M. Jamison, and M. Marcu. 2011. Consumer usage of broadband Internet services: An analysis of the case of Portugal. In Adoption, usage, and global impact of broadband technologies: Diffusion, practice and policy, 198–213. New York: IGI Global.
- Headicar, P., and G. Stokes. 2016. On the move 2: Making sense of travel trends in England 1995–2014. Technical report, Independent Transport Commission, London. http://www.theitc.org.
- Henderson, D. 2020. Demand-side broadband policy in the context of digital transformation: An examination of SME digital advisory policies in Wales. Telecommunications Policy 44 (9):102024. doi: https://doi.org/10.1016/j.telpol.2020.102024.
- Hyndman, R. J., E. Wang, and N. Laptev. 2015. Large-scale unusual time series detection. In 2015 IEEE international conference on data mining workshop (ICDMW), 1616–19. IEEE. doi: https://doi.org/10.1109/ICDMW.2015.104.
- James, G., D. Witten, T. Hastie, and R. Tibshirani. 2013. An introduction to statistical learning. Vol. 112. New York: Springer.
- Jia, J. S., X. Lu, Y. Yuan, G. Xu, J. Jia, and N. A. Christakis. 2020. Population flow drives spatio-temporal distribution of COVID-19 in China. Nature 582 (7812):389–94. doi: https://doi.org/10.1038/s41586-020-2284-y.
- Kitsos, A., and P. Bishop. 2018. Economic resilience in Great Britain: The crisis impact and its determining factors for local authority districts. The Annals of Regional Science 60 (2):329–47. doi: https://doi.org/10.1007/s00168-016-0797-y.
- Lee, N. 2014. Grim down South? The determinants of unemployment increases in British cities in the 2008–2009 recession. Regional Studies 48 (11):1761–78. doi: https://doi.org/10.1080/00343404.2012.709609.
- Li, R., K. Chen, and D. Wu. 2020. Challenges and opportunities for coping with the smart divide in rural America. Annals of the American Association of Geographers 110 (2):559–70. doi: https://doi.org/10.1080/24694452.2019.1694402.
- Lin, J., M. Vlachos, E. Keogh, and D. Gunopulos. 2004. Iterative incremental clustering of time series. In Advances in Database Technology - EDBT 2004. EDBT 2004. Lecture Notes in Computer Science, vol 2992, ed. E. Bertino et al., 106–22. Berlin: Springer.
- Marks, P. 2020. News: Virtual collaboration in the age of the coronavirus. Communications of the ACM 63 (9):21–23. doi: https://doi.org/10.1145/3409803.
- Martin, R. 1988. The political economy of Britain’s north-south divide. Transactions of the Institute of British Geographers 13 (4):389–418. doi: https://doi.org/10.2307/622738.
- Martin, R. 2012. Regional economic resilience, hysteresis and recessionary shocks. Journal of Economic Geography 12 (1):1–32. doi: https://doi.org/10.1093/jeg/lbr019.
- McCann, P. 2016. The UK regional-national economic problem: Geography, globalisation and governance. London and New York: Routledge.
- McCann, P. 2020. Perceptions of regional inequality and the geography of discontent: Insights from the UK. Regional Studies 54 (2):256–67. doi: https://doi.org/10.1080/00343404.2019.1619928.
- Mongey, S., L. Pilossoph, and A. Weinberg. 2020. Which workers bear the burden of social distancing policies? Working Paper 27085, National Bureau of Economic Research, Cambridge, MA. http://www.nber.org/papers/w27085.
- Montero, P., and J. A. Vilar. 2014. TSclust: An R package for time series clustering. Journal of Statistical Software 62 (1):1–43. doi: https://doi.org/10.18637/jss.v062.i01.
- Mu, X., A. G.-O. Yeh, and X. Zhang. 2020. The interplay of spatial spread of COVID-19 and human mobility in the urban system of China during the Chinese New Year. Environment and Planning B: Urban Analytics and City Science. Advance online publication. doi:https://doi.org/10.1177/2399808320954211.
- Nardotto, M., T. Valletti, and F. Verboven. 2015. Unbundling the incumbent: Evidence from UK broadband. Journal of the European Economic Association 13 (2):330–62. doi: https://doi.org/10.1111/jeea.12127.
- Nathan, M., and H. Overman. 2020. Will coronavirus cause a big city exodus? Environment and Planning B: Urban Analytics and City Science 47 (9):1537–42. doi: https://doi.org/10.1177/2399808320971910.
- Niesterowicz, J., T. F. Stepinski, and J. Jasiewicz. 2016. Unsupervised regionalization of the United States into landscape pattern types. International Journal of Geographical Information Science 30 (7):1450–68. doi: https://doi.org/10.1080/13658816.2015.1134796.
- OfCom. 2016. Connected nations report 2016. https://www.ofcom.org.uk/__data/assets/pdf_file/0035/95876/CN-Report-2016.pdf.
- OfCom. 2017. UK home broadband performance: The performance of fixed-line broadband delivered to UK residential consumers. Research report. https://www.ofcom.org.uk/__data/assets/pdf_file/0015/100761/UK-home-broadband-performance,-November-2016-Technical-report.pdf.
- Office for National Statistics. 2020a. Coronavirus and homeworking in the UK: April 2020. https://www.ons.gov.uk/employmentandlabourmarket/peopleinwork/employmentandemployeetypes/bulletins/coronavirusandhomeworkingintheuk/april2020.
- Office for National Statistics. 2020b. Coronavirus and homeworking in the UK labour market: 2019. https://www.ons.gov.uk/employmentandlabourmarket/peopleinwork/employmentandemployeetypes/articles/coronavirusandhomeworkingintheuklabourmarket/2019.
- Peters, P., K. G. Tijdens, and C. Wetzels. 2004. Employees’ opportunities, preferences, and practices in telecommuting adoption. Information & Management 41 (4):469–82. doi: https://doi.org/10.1016/S0378-7206(03)00085-5.
- Philip, L., C. Cottrill, J. Farrington, F. Williams, and F. Ashmore. 2017. The digital divide: Patterns, policy and scenarios for connecting the “final few” in rural communities across Great Britain. Journal of Rural Studies 54:386–98. doi: https://doi.org/10.1016/j.jrurstud.2016.12.002.
- Ratanamahatana, C. A., and E. Keogh. 2004. Everything you know about dynamic time warping is wrong. In Third workshop on mining temporal and sequential data. Vol. 32, 22–25. Seattle, WA.
- Riddlesden, D., and A. D. Singleton. 2014. Broadband speed equity: A new digital divide? Applied Geography 52:25–33. doi: https://doi.org/10.1016/j.apgeog.2014.04.008.
- Salemink, K., D. Strijker, and G. Bosworth. 2017. Rural development in the digital age: A systematic literature review on unequal ICT availability, adoption, and use in rural areas. Journal of Rural Studies 54:360–71. doi: https://doi.org/10.1016/j.jrurstud.2015.09.001.
- Sardá-Espinosa, A. 2019a. dtwclust: Time series clustering along with optimizations for the dynamic time warping distance. R package version 5.5.6. https://CRAN.R-project.org/package=dtwclust.
- Sardá-Espinosa, A. 2019b. Time-series clustering in R using the dtwclust package. The R Journal 11 (1):22–43. doi: https://doi.org/10.32614/RJ-2019-023.
- Shibayama, T., F. Sandholzer, B. Laa, and T. Brezina. 2021. Impact of COVID-19 lockdown on commuting: A multi-country perspective. European Journal of Transport and Infrastructure Research 21 (1):70–93.
- Siha, S. M., and R. W. Monroe. 2006. Telecommuting’s past and future: A literature review and research agenda. Business Process Management Journal 4:455–82. doi: https://doi.org/10.1108/14637150610678078.
- Singh, P., R. Paleti, S. Jenkins, and C. R. Bhat. 2013. On modeling telecommuting behavior: Option, choice, and frequency. Transportation 40 (2):373–96. doi: https://doi.org/10.1007/s11116-012-9429-2.
- Singleton, A. D., and P. A. Longley. 2009. Geodemographics, visualisation, and social networks in applied geography. Applied Geography 29 (3):289– 98. doi: https://doi.org/10.1016/j.apgeog.2008.10.006.
- Star, S. L. 1999. The ethnography of infrastructure. American Behavioral Scientist 43 (3):377–91. doi: https://doi.org/10.1177/00027649921955326.
- Stern, M., A. Adams, and S. Elsasser. 2009. How levels of Internet proficiency affect usefulness of access across rural, suburban, and urban communities. Sociological Inquiry 79 (4):391–417. doi: https://doi.org/10.1111/j.1475-682X.2009.00302.x.
- Tranos, E. 2013. The geography of the Internet: Cities, regions and Internet infrastructure in Europe. Cheltenham, UK: Edward Elgar.
- UK, Tech City. 2018. Tech nation 2017. https://technation.io/wp-content/uploads/2018/04/Tech_City_2017_report_full_web.pdf.
- Van Deursen, A. J., and E. J. Helsper. 2015. The third-level digital divide: Who benefits most from being online? In Communication and information technologies annual, ed. L. Robinson, S. R. Cotten, and J. Schulz, 29–52. Bingley: Emerald Group.
- Van Deursen, A. J, and J. Van Dijk. 2011. Internet skills and the digital divide. New Media & Society 13 (6):893–911. doi: https://doi.org/10.1177/1461444810386774.
- Van Deursen, A. J., and J. A. Van Dijk. 2014. The digital divide shifts to differences in usage. New Media & Society 16 (3):507–26. doi: https://doi.org/10.1177/1461444813487959.
- Warren Liao, T. 2005. Clustering of time series data—A survey. Pattern Recognition 38 (11):1857–74. http://www.sciencedirect.com/science/article/pii/S0031320305001305. doi: https://doi.org/10.1016/j.patcog.2005.01.025.
- Yang, C., D. Sha, Q. Liu, Y. Li, H. Lan, W. W. Guan, T. Hu, Z. Li, Z. Zhang, J. H. Thompson, et al. 2020. Taking the pulse of COVID-19: A spatiotemporal perspective. International Journal of Digital Earth 13 (10):1186–1211. doi: https://doi.org/10.1080/17538947.2020.1809723.
Appendix A.
This is the LAD cluster membership for the upload speed time series.
Cluster 1: Ceredigion, Darlington, Eden, Erewash, Kettering, Rossendale, Runnymede, Rutland, Westminster
Cluster 2: Isles of Scilly, North East Lincolnshire
Cluster 3: Broxbourne, Carlisle, Corby, Dundee City, Eastbourne, Harlow, Hertsmere, Hounslow, Ipswich, Luton, Newham, South Northamptonshire
Cluster 4: Hambleton
Cluster 5: Fylde, Rugby, Three Rivers
Cluster 6: Aberdeenshire, Adur, Allerdale, Amber Valley, Angus, Antrim and Newtownabbey, Argyll and Bute, Armagh City, Banbridge and Craigavon, Arun, Ashford, Aylesbury Vale, Babergh, Barnet, Barrow-in-Furness, Basildon, Bassetlaw, Bath and North East Somerset, Bedford, Belfast, Birmingham, Blackburn with Darwen, Blackpool, Blaenau Gwent, Bolton, Boston, Bournemouth, Christchurch and Poole, Bracknell Forest, Bradford, Braintree, Breckland, Brentwood, Bridgend, Brighton and Hove, City of Bristol, Broadland, Bromley, Calderdale, Cambridge, Camden, Canterbury, Carmarthenshire, Causeway Coast and Glens, Central Bedfordshire, Chelmsford, Cherwell, Cheshire East, Cheshire West and Chester, Chesterfield, Chichester, Chiltern, City of Edinburgh, City of London, Clackmannanshire, Conwy, Copeland, Cornwall, Cotswold, County Durham, Coventry, Craven, Croydon, Dacorum, Dartford, Denbighshire, Derbyshire Dales, Derry City and Strabane, Dorset, Dover, Dumfries and Galloway, Ealing, East Cambridgeshire, East Devon, East Dunbartonshire, East Hampshire, East Hertfordshire, East Lindsey, East Renfrewshire, East Riding of Yorkshire, East Suffolk, Elmbridge, Epping Forest, Epsom and Ewell, Exeter, Fareham, Fenland, Fermanagh and Omagh, Fife, Flintshire, Folkestone and Hythe, Forest of Dean, Gateshead, Gloucester, Gosport, Great Yarmouth, Greenwich, Gwynedd, Hackney, Harborough, Haringey, Hartlepool, Hastings, Havering, Herefordshire, County of, High Peak, Highland, Hillingdon, Horsham, Huntingdonshire, Inverclyde, Isle of Anglesey, King’s Lynn and West Norfolk, Kingston upon Hull, City of, Kingston upon Thames, Kirklees, Lambeth, Lancaster, Leeds, Lincoln, Liverpool, Maidstone, Malvern Hills, Mansfield, Melton, Merthyr Tydfil, Mid Devon, Mid Suffolk, Mid Ulster, Midlothian, Mole Valley, Monmouthshire, Moray, Na h-Eileanan Siar, Neath Port Talbot, New Forest, Newcastle upon Tyne, Newry, Mourne and Down, North Devon, North East Derbyshire, North Lanarkshire, North Lincolnshire, North Norfolk, North Somerset, North Tyneside, North Warwickshire, North West Leicestershire, Northumberland, Orkney Islands, Pembrokeshire, Pendle, Perth and Kinross, Peterborough, Plymouth, Powys, Preston, Reading, Redcar and Cleveland, Reigate and Banstead, Rhondda Cynon Taf, Ribble Valley, Richmondshire, Rother, Rotherham, Rushcliffe, Rushmoor, Ryedale, Scottish Borders, Sedgemoor, Sefton, Sevenoaks, Shetland Islands, Shropshire, Somerset West and Taunton, South Ayrshire, South Bucks, South Cambridgeshire, South Gloucestershire, South Hams, South Holland, South Lakeland, South Norfolk, South Oxfordshire, South Ribble, South Somerset, South Staffordshire, Southend-on-Sea, Southwark, St Albans, Stafford, Stirling, Stoke-on-Trent, Stratford-on-Avon, Stroud, Swale, Swansea, Swindon, Teignbridge, Tendring, Test Valley, Tewkesbury, Thanet, Tonbridge and Malling, Torbay, Torfaen, Torridge, Tower Hamlets, Tunbridge Wells, Uttlesford, Wakefield, Waltham Forest, Wandsworth, Warrington, Watford, Waverley, Wellingborough, West Berkshire, West Lancashire, West Lindsey, West Oxfordshire, Wiltshire, Winchester, Windsor and Maidenhead, Wirral, Wokingham, Worcester, Worthing, Wrexham, Wychavon, Wycombe, Wyre
Cluster 7: Lisburn and Castlereagh, Selby, Tameside, Welwyn Hatfield, Wyre Forest
Cluster 8: Cannock Chase, East Lothian, Lichfield, Oadby and Wigston, Tandridge, West Devon
Cluster 9: Aberdeen City, Ards and North Down, Ashfield, Barking and Dagenham, Barnsley, Basingstoke and Deane, Bexley, Blaby, Bolsover, Brent, Bromsgrove, Broxtowe, Burnley, Bury, Caerphilly, Cardiff, Castle Point, Charnwood, Cheltenham, Chorley, Colchester, Crawley, Daventry, Derby, Doncaster, Dudley, East Ayrshire, East Northamptonshire, East Staffordshire, Eastleigh, Enfield, Falkirk, Gedling, Glasgow City, Gravesham, Guildford, Halton, Hammersmith and Fulham, Harrogate, Harrow, Hart, Havant, Hinckley and Bosworth, Hyndburn, Isle of Wight, Islington, Kensington and Chelsea, Knowsley, Leicester, Lewes, Lewisham, Maldon, Manchester, Medway, Mendip, Merton, Mid and East Antrim, Mid Sussex, Middlesbrough, Milton Keynes, Newark and Sherwood, Newcastle-under-Lyme, Newport, North Ayrshire, North Hertfordshire, North Kesteven, Northampton, Norwich, Nottingham, Nuneaton and Bedworth, Oldham, Oxford, Portsmouth, Redbridge, Redditch, Renfrewshire, Richmond upon Thames, Rochdale, Rochford, Salford, Sandwell, Scarborough, Sheffield, Slough, Solihull, South Derbyshire, South Kesteven, South Lanarkshire, South Tyneside, Southampton, Spelthorne, St. Helens, Staffordshire Moorlands, Stevenage, Stockport, Stockton-on-Tees, Sunderland, Surrey Heath, Sutton, Tamworth, Telford and Wrekin, Thurrock, Trafford, Vale of Glamorgan, Vale of White Horse, Walsall, Warwick, Wealden, West Dunbartonshire, West Lothian, West Suffolk, Wigan, Woking, Wolverhampton, York
Appendix B.
Figure B1 Upload speed clusters for local authority districts before the pandemic (2019).