
 ?Mathematical formulae have been encoded as MathML and are displayed in this HTML version using MathJax in order to improve their display. Uncheck the box to turn MathJax off. This feature requires Javascript. Click on a formula to zoom.
Abstract
Decisions about sensor placement in cities are inherently complex, balancing social-technical, digital, and structural inequalities with the differential needs of populations, local stakeholder priorities, and the technical specificities of the sensors themselves. Rapid developments in urban data collection and geographic data science have the potential to support these decision-making processes. Focusing on a case study of air-quality sensors in Newcastle-upon-Tyne, UK, we employ spatial optimization algorithms as a descriptive tool to illustrate the complex trade-offs that produce sensor networks that miss important groups—even when the explicit coverage goal is one of equity. We show that the problem is not technical; rather, it is demographic, structural, and financial. Despite the considerable constraints that emerge from our analysis, we argue the data collected via sensor networks are of continued importance when evidencing core urban injustices (e.g., air pollution or climate-related heat). We therefore make the case for a clearer distinction to be made between sensors for monitoring and sensors for surveillance, arguing that a wider presumption of bad intent for all sensors potentially limits the visibility of positive types of sensing. For the purpose of monitoring, we also propose that basic spatial optimization tools can help to elucidate and remediate spatial injustices in sensor networks.
城市传感器的布设非常复杂,需要平衡社会技术、数字和结构等方面的不平等,需要考虑人群的差异性需求、当地有关方面的优先事项和传感器技术指标。城市数据采集和地理数据科学的快速发展,可能会支持这些决策过程。以英国纽卡斯尔的空气质量传感器为例,以空间优化算法为描述手段,我们阐明了这个复杂的平衡过程。即使传感器布设的明确目标是公平,这些平衡仍然导致传感器网络错过了重要人群。我们证明,这不是技术问题,而是人口、结构和金融方面的问题。尽管我们的分析有很大限制,但是我们认为,传感器网络数据对于证明城市核心不公正(例如,空气污染、气候炎热)仍然很重要。因此,我们有理由对监测传感器和安保传感器进行更明确的区分。对所有传感器的泛恶意假设,可能会限制优质传感器的可见性。我们还提出,为了达到监测目标,简单的空间优化工具能帮助我们阐述和纠正传感器网络中的空间不公平现象。
Las decisiones acerca del emplazamiento de sensores en las ciudades son asunto intrínsecamente complejo, puesto que equilibran las desigualdades sociotécnicas, digitales y estructurales con las diferentes necesidades de las poblaciones, las prioridades de los interesados locales y las especificidades técnicas de los propios sensores. Los rápidos desarrollos en la recopilación de datos urbanos y la ciencia de los datos geográficos tienen el potencial de ayudar en estos procesos de toma de decisiones. Enfocándonos en un estudio de caso de los sensores para la calidad del aire en Newcastle-upon-Tyne, Reino Unido, utilizamos algoritmos de optimización espacial como la herramienta descriptiva que ilustra las complejas compensaciones que producen las redes de sensores que soslayan a grupos importantes, incluso cuando el objetivo explícito por cubrir es uno de equidad. Mostramos que el problema no es técnico, sino demográfico, estructural y financiero. A pesar de notables limitaciones que aparecen en nuestro análisis, sostenemos que los datos recogidos a través de las redes de sensores tienen una importancia sostenida cuando evidencian las principales injusticias urbanas (e.g., contaminación aérea o calor relacionado con clima). En consecuencia, abogamos porque se precise una distinción más clara entre los sensores destinados al monitoreo y los de vigilancia, arguyendo que una presunción amplia de mala intención para todos los sensores potencialmente limita la visibilidad de los tipos positivos de detección. En lo que se refiere a monitoreo, diríamos también que las herramientas básicas de optimización espacial pueden ayudar a dilucidar y remediar las injusticias espaciales en las redes de sensores.
Surveillance is a core concern when it comes to smart city sensor technologies (Kitchin, Lauriault, and McArdle Citation2015). The increasing ubiquity of sensors in the urban environment means that citizens are subject to much greater levels of scrutiny than ever before (Kitchin Citation2016). Sensor technologies can underpin, on the one hand, a growing “surveillance economy” that exploits personal data to generate profit (Zuboff Citation2015), and on the other, discriminatory policing practices informed by big data (Ferguson Citation2019). As such, the aims of speed and convenience that typify today’s “fast infrastructures” create ease for some and harm for others, exacerbating social and environmental crises around the world (Barlow and Drew Citation2020). Understandably, surveillance-oriented sensor technologies that collect data about people have attracted considerable critique (Barocas and Nissenbaum Citation2014; Crawford and Schultz Citation2014; Kitchin, Lauriault, and McArdle Citation2015; Sadowski and Pasquale Citation2015; Kitchin, Cardullo, and Di Feliciantonio Citation2019).
Often attracting less attention are those sensor technologies that have the potential to generate data for people, providing some form of public good. Sensors that fulfill a monitoring function can play an important role in evidencing environmental injustices (Mah Citation2017), including poor air quality (Mitchell and Dorling Citation2003) or excessive urban heat (Sanchez and Reames Citation2019). Monitoring sensors provide evidence of the disproportionate exposure of selected populations to urban ills (Grineski and Collins Citation2018; Nadybal, Collins, and Grineski Citation2020), and the ways in which they can be displaced by changes in policy. Without monitoring, the ubiquity of spatial environmental injustices can remain invisible. Frustratingly, the two types of sensors—surveillance and monitoring—are often integrated within smart city platforms that include, for example, sensors recording both air quality and footfall. The wider presumption of bad intent for all sensors (irrespective of purpose) limits the visibility of positive types of sensing in critical smart urbanisms and—importantly—hinders our capacity to ensure that monitoring networks are deployed as equitably as possible for all urban inhabitants.
This is not to say that sensors that collect data for people cannot generate or perpetuate injustice. Indeed, just because a sensor is “good” in principle does not mean that it is generating good sensor coverage in practice. Unjust technologies are both a symptom and a cause of injustice and it is well understood that smart- or data-oriented injustices are driven by the uneven and discriminatory social processes that inform the selection and design of technologies (Shelton, Zook, and Wiig Citation2015; Mah Citation2017; Benjamin Citation2019; D’Ignazio and Klein Citation2020). Rather, it is instead to recognize that some types of sensors have the potential to do important work for social justice, when underpinned by social processes that seek to bring about equitable change in cities, or to evidence and challenge disadvantage or discrimination.
With this potential in mind, our analysis works within the constraints of existing infrastructures and decision-making algorithms, reorienting the social processes that inform monitoring sensor technologies, and especially their placement, to concentrate on equity. Our approach emphasizes the trade-offs inherent to sensor locations, particularly where demographic coverage is concerned. Urban landscapes are populated by a diverse range of individuals, possessed of differential vulnerabilities and needs that sensors can help remediate—but only if these sensors are located in such a way that valid information is collected for these groups. We adapt widely accepted spatial optimization algorithms to show how conceptualization of coverage, density of network, and spatial sorting of inhabitants have important equity impacts that limit the capacity for networks to be judged truly inclusive or just. We illustrate our approach with a case study of air quality sensors in Newcastle-upon-Tyne, UK (hereafter Newcastle). Newcastle is home to the Urban Observatory (UO), an extensive network of sensors that provides the “largest set of publicly available real time urban data in the UK” (UO Citation2021). Using Newcastle as a case study allows for comparison between an “actually exisiting” sensor network and the sensor networks estimated in our analysis (Shelton, Zook, and Wiig Citation2015).
Our results highlight some of the ways in which—even with the best of intentions—urban decision makers are limited in their capacity to develop equitable sensor networks. Inequities in sensor networks need not be the result of deliberately unjust and malicious decision-making processes; even when aiming to maximize equity, sensor networks are likely to miss important subgroups (and locations). Despite the considerable constraints of our resultant sensor networks, we argue that “just good enough” (Gabrys, Pritchard, and Barratt Citation2016), or “satisficing” (Simon Citation1960) networks and the urban data they produce have the potential to play a valuable role in evidencing core urban injustices by supporting transparency in the decision-making process. The article is structured as follows. We first discuss the different purposes of sensor infrastructures: sensors for surveillance and sensors for monitoring. We then explore the trade-offs in sensor placement before outlining our methodological strategy. We then discuss the networks that emerge from our analysis and the associated trade-offs, before concluding with a discussion about the ways in which we might reimagine the use of sensors in cities.
Surveillance Versus Monitoring: What are Sensors for?
A sociotechnical perspective envisions the relations between social structures and technical systems as mutual and coproductive, with an emphasis on contextualizing these relations in both space and time. Sensor technologies and networks therefore can—and should—be understood as intertwined with society. Political and socioeconomic structures within society influence the formation of smart cities and associated infrastructures, and vice versa (Graham and Marvin Citation2001). In this way, sensor technologies are the outcome of the complex social relations that flow through them—social relations that shape the design, placement, and use of sensors, to fulfill different purposes. For example, smart cities and associated sensor networks have been widely critiqued as political technologies via which austerity measures have been enacted in cities following the 2008 global financial crisis (Pollio Citation2016; Cardullo and Kitchin Citation2019). In the section that follows we distinguish between sensors for the purpose of surveillance and sensors for monitoring.
Sensors for Surveillance
Surveillance is a core concern when it comes to smart cities and technologies (Barocas and Nissenbaum Citation2014; Crawford and Schultz Citation2014; Kitchin, Lauriault, and McArdle Citation2015; Sadowski and Pasquale Citation2015; Zuboff Citation2015; Kitchin, Cardullo, and Di Feliciantonio Citation2019). Subsequently, sensors that collect data about people have attracted considerable critique. A growing “surveillance economy,” generating profit from personal data, has emerged (Zuboff Citation2015). New sensor technologies, the frictionless flow of data, and sophisticated urban analytics have attracted greater levels of private-sector involvement in both the commissioning and funding of sensor networks. This has led to ethical concerns about the ways in which value can be extracted from data generated, and the potential for new data to inform urban governance processes (Kitchin, Lauriault, and McArdle Citation2015; Sadowski and Pasquale Citation2015).
Such datafication is also coupled with concerns about privacy. Individuals are subject to intensified scrutiny as their daily lives are increasingly captured as data (Dodge and Kitchin Citation2005), including geolocation or tracking technologies such as closed-circuit television (CCTV), facial recognition, traffic flow monitoring, and spending patterns, especially when used commercially (Kitchin Citation2016). The use of multiple and interacting systems run by a variety of commercial and state actors means that consent is increasingly diluted or lost (Solove Citation2013; Barocas and Nissenbaum Citation2014). As new forms of urban governance based on datafication tend to inherit public trust, it is not always clear how new forms of data are produced and used, and whether individuals have the capacity to change these processes (Lagoze Citation2014; Michael and Lupton Citation2016; Jameson, Richter, and Taylor Citation2019).
Issues of surveillance are further compounded by the tendency for the systems and technologies on which such practices are founded to discriminate (Ferguson Citation2019). As argued by Benjamin (Citation2019), the basic conditions for creating technology are racist. Differential policing and surveillance based on demographics have attracted particular attention in this regard. In their recent book, Data Feminism, D’Ignazio and Klein (Citation2020) highlighted how important societal decisions are increasingly made by automated systems systematically analyzing large volumes of information. D’Ignazio and Klein cited the example of PredPol, a predictive policing company founded in 2012 that has informed the policing practices of the City of Los Angeles for almost a decade. PredPol’s predictive policing is predicated on historical crime data, therefore reproducing the enduring discriminatory practices that have resulted in the disproportionate policing and surveillance of neighborhoods of color in the United States (see also O’Neil Citation2016). The case of predictive policing illustrates how specific groups within the city have the privilege of invisibility from sensors deployed with the purpose of surveillance, versus those subgroups who are not afforded that privilege.
Sensors for Monitoring
In response, Kitchin (Citation2016, Citation2018) argued that, although they have the potential to provide new and useful insights into cities and systems, smart cities and urban science need to be reimagined and recast. Grassroots environmental justice activists have increasingly used big data techniques for monitoring and evidencing toxic environmental exposures, and “taken science into their own hands” (Mah Citation2017, 123). The potential for sensors for monitoring purposes has been discussed most extensively in relation to citizen sensing, typically using low-cost sensors (e.g., Corburn Citation2005; Pritchard and Gabrys Citation2016; Gabrys Citation2017). Gabrys, Pritchard, and Barratt (Citation2016) evidenced how citizen sensing gives rise to alternative ways of creating, valuing, and interpreting data sets. Using low-cost sensors, indicative monitoring can be undertaken, generating data for a wider spatial area. For example, low-cost, distributed sensor networks are used to show the distribution of air pollution at a higher spatial and temporal resolution (e.g., Feinberg et al. Citation2019; Cao et al. Citation2020). The resultant “just good enough data” often falls outside recommended standards of scientific data (e.g., evaluating statutory air quality targets; Lagoze Citation2014). The data, however, open up new “political possibilities” (Irwin Citation1995) by mobilizing citizens around common issues, prompting conversations with policymakers, providing initial evidence for greater investment in regulatory-standard monitoring infrastructure (Gray, Lammerhirt, and Bounegru Citation2016), and dispelling the disadvantage of invisibility.
A Surveillance–Monitoring Continuum
Highlighting the differences between sensors for monitoring and sensors for surveillance is not to say that monitoring sensors that collect data for people do not generate or perpetuate injustice. Just because a sensor is “good” in principle (e.g., collecting information about local air quality) does not mean that it is generating good sensor data or coverage in practice (Robinson and Franklin Citation2021). Of course, many sensors are inherently equivocal or ambivalent in purpose; noise, for example, is a health and well-being issue, but can also be used to police populations in contested spaces (e.g., Bello, Mydlarz, and Salamon Citation2018; Hong, Kim, and Widener Citation2020). Dalton et al. (Citation2020) argued that measurement of any form (including via sensors in the smart city) is a political act, defining what processes should be measured, and reducing and representing one thing as another. Quantification processes play an integral role in the governance of urban populations (Foucault Citation2008). Moreover, sensors that monitor urban challenges are situated within urban environments and governance structures that are inherently unequal, and technologies tend to replicate this unevenness (Shelton, Zook, and Wiig Citation2015; Dencik, Hintz, and Cable Citation2016). Technologies have been shown to embed discriminatory and racist practices into their design, replicating and deepening existing social divisions (Mah Citation2017; Benjamin Citation2019; D’Ignazio and Klein Citation2020). As such, the data they produce rarely include everyone equally or in a representative way (Shelton, Zook, and Wiig Citation2015), typically divided based on existing forms of social difference (race, income, class, ethnicity, age, disability; Brannon Citation2017). The level of technicality and the ease of access associated with data also varies (Pak, Chua, and Vande Moere Citation2017; Puussaar et al. Citation2018). As such, Mah (Citation2017) highlighted a need to “avoid over-relying on new digital methods and techniques as a panacea for problems of voice” (130). So, a dilemma exists: Sensor technologies have the potential to do important work for social justice, but are constrained by a variety of factors that might include intent and willful ignorance, but also transparency and access to more sophisticated decision-making support.
Trade-Offs in the Placement of Sensors in the City
Although it is often assumed that decisions are well-defined, and that relevant parameters to inform decision-making are known or can be estimated in a meaningful way (Hansson and Hirsch Hadorn Citation2018), typically decision-making processes take place under much less systematic conditions—and sensor placement is no exception. Even in a context in which decision makers have inclusive intentions for the deployment of sensors within a city (e.g., seeking to provide coverage for all vulnerable populations, where air quality is concerned), limited information and expertise, as well as competing goals, mean sensor networks are likely to come up short given the myriad trade-offs involved. From the outset, trade-offs are embedded in sensor networks as they are rarely designed with a single function in mind. Instead, they seek to address competing requirements from different stakeholders with varied objectives—complicating the decision-making process. For example, in our case study of the UO in Newcastle, decisions about where to place sensors are made by a range of actors including policymakers, academics, and local community groups in response to specific local priorities. As such, real-world sensor networks must try to fulfill several functions simultaneously. Moreover, sensors are expensive, so some priorities necessarily go unmet. This variety of functions has important implications for what constitutes good coverage (Robinson and Franklin Citation2021). Functions range from hazard-oriented networks that provide coverage of hazard or nuisance producers (e.g., poor air quality or noise pollution) to vulnerability-oriented networks that encompass populations most at risk (whether due to health, age, or other factors).
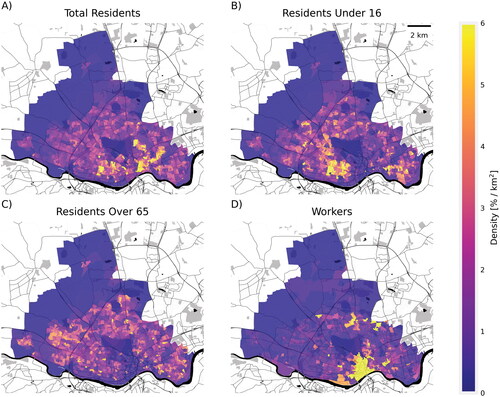
In the case of vulnerability-oriented networks, trade-offs also emerge as a result of the spatial demographic structure of the population within a city. Our case study area of Newcastle () is one of the UK’s core cities, located in the North East region of England. Here, as in most other cities, population subgroups sort differently across space. Approximately 293,700 inhabitants live within the Local Authority of Newcastle (Newcastle City Council Citation2021), the geographic focus of our analysis. Considering the distribution of the total population based on the 2011 Census, density decreases with distance from the city center; more people can be “covered” by fewer sensors in the city center, but that, of course, implies a lack of importance of those residing in the urban fringe. Where distribution of children (under sixteen years old) is concerned, their share is lower in the city center and highest in the major inner suburban areas, especially to the west of the city (). In contrast 14.4 percent of the population is aged sixty-five or over (Newcastle City Council Citation2021); based on Census 2011, areas with a higher proportion of these older persons are spatially concentrated across the suburbs of Newcastle, with lower rates in the center of the city. By comparison—and recognizing that inhabitants are mobile and place of residence is an imperfect locational anchor—the population based on place of work reverses many of these spatial patterns, with the city center and industrial areas on the periphery of the city of greatest importance. Even based on the subset of demographic variables presented—chosen here for their relevance where air quality is concerned—the relative importance of (and subsequent justification for) sensor coverage varies considerably. The point here is that, given differential location patterns of demographic subgroups, prioritizing coverage or monitoring for some groups is likely to disadvantage other groups unavoidably—unless financial resources pose no constraint.
Figure 1 Density of demographic variables across Newcastle. Distribution of each variable, all on the same scale using a density calculated as percent of people in the output area (OA), divided by the area of the OA. Source: Map tiles by Stamen Design, under CC BY 3.0. Data by OpenStreetMap, under ODbL. Office for National Statistics licensed under the Open Government License v.3.0. Contains OS data © Crown copyright and database right 2021.
Of course, even without the constant pressure of austerity measures, financial constraints are ubiquitous for local government actors with competing policy priorities, leading to a need to balance what is optimal (i.e., uniform coverage of the entire city and all inhabitants) with what is practical. Sensor networks are an expensive investment. This includes the initial costs of the infrastructure itself as well as the legacy of continual maintenance to ensure data are collected effectively and that the data (where openly available) are accessible to wider audiences. Bates (Citation2012) highlighted the path dependency in cities when they adopt particular commercial technologies and platforms that cannot easily be undone or adapted. The cost of a sensor also influences the quality of the data collected, with trade-offs to be made between the price and size of the device, and the accuracy and precision of the measurements made. Guidance from the Department for Environment, Food and Rural Affairs (Defra), the department responsible for air quality in the United Kingdom, recognizes that low-cost sensors could be particularly sensitive to changes in atmospheric humidity and temperature, or provide false signals in response to high concentrations of other air pollutants (Defra Citation2021). Subsequently, it is advised that low-cost sensors should not subsume the role of reference monitors used in the automatic monitoring network, making monitoring compliance with statutory air quality targets a potentially expensive endeavor (see also Lewis and Edwards Citation2016).
Maintenance work is also a sociotechnical effort, involving not just technical know-how about sensor technologies, but also human labor and ingenuity in how sensor infrastructures are “brought to life” (see Strebel Citation2011, 245, discussing maintenance in relation to buildings). Sensors are often embedded within an urban environment that is not fit for purpose, “integrated awkwardly into existing configurations of urban governance and the built environment” (Shelton, Zook, and Wigg Citation2015, 14). Sensor placement can also be contested by local actors, not least owing to the concerns about surveillance already discussed. Put briefly, decision makers face challenges and trade-offs not only about where to place sensors, but how many to deploy in the first place. The response to these challenges and trade-offs is also shaped by the knowledges, biases, and experiences of decision makers themselves that are operationalized during the decision-making process (Viitanen and Kingston Citation2014).
The complex dynamics and trade-offs associated with the placement of sensors merit systematic evaluation prior to placement. This process of evaluation often falls short, however. Instead, at best, sensor placement is typically informed by ad-hoc decision-making in response to specific issues. More often, sensors are deployed by companies on behalf of cities resulting in “a ‘one size fits all smart city in a box’ solutions that take little account of the uniqueness of places, peoples and cultures and thus works sub-optimally” (Kitchin Citation2018, 225). It is important, then, to evaluate what an optimal sensor network might look like, and more broadly whether it is possible to configure a truly equitable sensor network—and what is uncovered or learned through the process.
Here it is useful to draw on conceptualizations of “just good enough data” (Gabrys, Pritchard, and Barratt Citation2016), as well as the idea of satisficing (Simon Citation1955). The term satisficing has been used extensively in relation to decision-making, placing a focus on decisions that are satisfactory or adequate, as opposed to ideal or optimal. Although the concept of “just good enough data” has been used in relation to data generated by affected members of a population, here we apply the term more broadly to consider public urban data more generally. Uprichard (Citation2019) argued that new forms of big data from sensors are not “going to solve our big social problems … [but] it may help to describe them, to picture them in new ways, to visualise the available data differently, and this may help to communicate the problems to more people.” In considering what is optimal, given the significant injustices and trade-offs associated with sensor placement, it is also worth considering whether sensor networks can “satisfice” or be “just good enough” instead—and, if so, how to help ensure such decision-making is transparent. In the analysis that follows, we illustrate how the fundamental spatial optimization tools employed so widely in quantitative geography can be used by urban decision makers to assess these trade-offs, visualize impacts of different decisions, and elucidate spatial inequalities in sensor placement.
Optimizing Sensor Locations for Demographic Coverage in the “Smart City”
Spatial Optimization: Greedy and Genetic Algorithms
In the spatial sciences, decision-making about sensor locations and coverage is likely to be thought of as a problem of spatial optimization. Spatial optimization algorithms identify the best arrangement or allocation of infrastructures (Tong and Murray Citation2012). Such methods and tools have burgeoned in recent years due to increasing recognition of the need for an integrated approach to spatial planning to tackle complex societal challenges. A spatial optimization approach typically considers a particular geographical problem as a specific objective—for example, maximizing population served or minimizing distance to a nearest facility—that is operationalized by way of a set of constraints that capture the decision-making process (e.g., minimizing cost or distance). In our case, sensor placement can be augmented based on multiple objectives, such as maximizing coverage of a number of vulnerable populations or hazards, or constraints; that is, minimizing total sensor costs (e.g., Sun et al. Citation2019).
There are two different approaches to solving a multiple objective problem using spatial optimization: exact and heuristic. An exact approach exhausts all possibilities to identify the truly optimal solution to a problem. This exact approach to spatial optimization (e.g., integer or linear programming) is often limited in its applicability, as increasing numbers of variables lead to an exponential increase in the solution time (Delmelle Citation2010). In addition, even when solvable, a single solution is often not appropriate when seeking to represent complex, real-world issues. In comparison, heuristic approaches offer an approximate approach to spatial optimization, generating one or more good (enough) solutions to a problem.
To illustrate the challenges associated with providing equitable sensor network coverage, our analysis employs two heuristic approaches for optimizing sensor placement: a greedy algorithm and a genetic algorithm. In both instances, quality and exactness of results are partially dependent on how geographic space is represented, broken up, and conceptualized—for example, where points are used to represent a process or how coverage is estimated. This reinforces one of the ways in which spatial optimization problems are inherently complex to solve.
We begin by employing a greedy algorithm to derive sensor networks based on a single objective (i.e., maximizing coverage of a single demographic group). Greedy algorithms make the locally optimal choice at each stage of problem-solving, with the overarching aim of quickly finding a solution that is a reasonable approximation of the global optimum. Greedy algorithms iteratively build a solution. In our case, the first sensor in the network is placed at the location that maximizes overall coverage of the city for the given objective. The second sensor is then placed in the location that provides the most additional coverage, leaving the first sensor fixed in its original location. This process is repeated until a network with the desired number of sensors has been generated. Greedy algorithms are critiqued for their tendency to commit to certain choices early in the process, but typically provide a good, if often suboptimal, solution to a decision (Garai and Chaudhuri Citation2007; Delmelle Citation2010; Tong and Murray Citation2012). There are theoretical guarantees a greedy algorithm will provide an approximation within 1 − 1/e (where e is Euler’s number) of the global optimal solution (Hochbaum and Pathria Citation1998), making them a reliable choice for problems such as the one presented here. We have used our own implementation of a greedy algorithm, building on the approach in Sun et al. (Citation2019).
Next, a genetic algorithm is used to generate optimal sensor networks based on multiple objectives. Genetic algorithms are randomized search algorithms, developed to imitate processes of natural selection to search for the optimal or near-optimal solution. Genetic algorithms use techniques inspired by processes of inheritance, mutation, selection, and crossover to inform the problem-solving strategy (Holland Citation1992; Yang Citation2021). Specifically, we have used the implementation of NSGA-II (Deb et al. Citation2002) in the optimization library pygmo (Biscani and Izzo Citation2020). This aims to find “nondominated solutions”—in this context, sensor networks where it is not possible to move a sensor without decreasing the overall coverage of at least one demographic group. Its output is not a single network but rather a spectrum of many networks, each of which represents a unique compromise between the different objectives. Existing research using NSGA-II on related problems includes Ebrahimi Zade, Sadegheih, and Lotfi (Citation2014) and Changaival et al. (Citation2021).
Formulating the Sensor Coverage Decision Problem
In characterizing different spatial optimization problems, Tong and Murray (Citation2012) identifed a wide range of spatial features that can be the focus of optimization: “distance, adjacency, connectivity (contiguity), containment, intersection, shape, districts, and pattern” (1302)—often variations of what is typically referred to as a “coverage problem” in the spatial optimization literature. Coverage, where sensors are concerned, is a complicated concept, dependent on network purpose and perception (Robinson and Franklin Citation2021). To operationalize coverage here, we adopt the approach taken in Sun et al. (Citation2019) where the level of coverage at any given location depends on the distance to the nearest sensor and a parameter, Ѳ, which controls the rate that coverage decays. Formally:
(1)
(1)
where is the coverage at location a provided by a given network of sensors
and
is the distance between location a and the sensor s in the network (
). The Ѳ parameter can be thought of as a sensor coverage area, or the size of the neighborhood surrounding a sensor that is considered to benefit from its placement. For our purposes, two sensor coverage areas are selected for which to derive solutions: 100-m and 500-m (also described as Ѳ = 100-m and Ѳ = 500-m). The smaller value of 100-m provides a more realistic estimate of the distance within which a sensor is likely to provide technically accurate information (i.e., data recorded by a sensor is only technically accurate for areas near a sensor). In practice, this figure is likely to be even lower depending on the quality of the sensor infrastructure and the characteristics of the local built environment. The larger value of 500-m provides a perhaps more realistic picture of the granularity a decision maker might attempt to achieve when planning sensor coverage across a large urban conurbation, especially when thinking beyond data quality to consider sensor coverage as an issue of representation (Robinson and Franklin Citation2021).Footnote1
Our analysis emphasizes the different ways in which decision makers might prioritize sensor coverage if they were to take a demographic approach—that is, prioritizing coverage of different subsets of the population. We estimate and compare four contrasting conceptualizations of demographic sensor coverage: (1) coverage of the total residential population; (2) coverage of residents under sixteen (children); (3) coverage of residents over sixty-five; and (4) coverage of the working population at their place of work (). All variables are based on data from the 2011 Census, available at the output area (OA) level, an administrative unit representing on average 125 households (Office for National Statistics Citation2011). It is common to use population data mapped onto a 1-km2 grid. By using OAs instead, however, we retain data at much higher granularity, with a median area around twenty times smaller than this (0.05 km2). OAs in sparsely populated areas on the outskirts of the city can be much larger, however, with 10 of the 910 OAs in Newcastle having an area greater than 1 km2.
Table 1. Demographic variables at output area (OA) scale
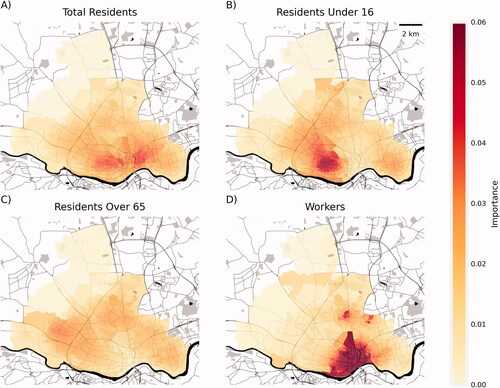
We use a count of the population in each OA, rather than a proportion, to reflect the number of people in each demographic group “covered” by a potential sensor. In the analysis that follows, these demographic variables shape the spatial optimization process, and the sensor networks that emerge. provides an illustration of the relative importance of different variables across Newcastle, based on the overall coverage provided by placing a sensor in this OA (using a 500-m solution). To calculate sensor coverage based on these demographic variables we consider an OA to have 100 percent coverage if it contains a sensor. In those OAs without a sensor, coverage is based on the distance to the nearest OA with a sensor (EquationEquation 1(1)
(1) ). We place sensors at, and calculate coverage based on the distance between, the population-weighted centroid of each OA (Office for National Statistics Citation2011). This allows us to better capture the distribution of people within an OA compared to using their geographical centers.
Figure 2 Distribution of demographic variables across Newcastle based on importance. Importance is the overall coverage provided by placing a sensor in an output area (using a 500-m solution).
In our single-objective greedy optimization we seek to find a network, with
sensors (
) that maximizes the total coverage of the city for a specific variable,
as defined by:
(2)
(2)
where is the number of people in OA a for the variable of interest (e.g., the number of children under sixteen resident in that OA), and
is the set of all OAs (i.e., the grid spanning the city, with
and
). In other words, we seek to maximize the weighted average of the coverage across all OAs, considering the demographic population of each OA:
(3)
(3)
This is a variant of a maximum coverage location problem (MCLP; Church and ReVelle Citation1974) allowing each OA to receive partial coverage (in the classical MCLP setting each location is either fully covered or not covered). In the multiobjective genetic algorithm, we calculate the overall coverage of each variable in the same way but search for promising compromise solutions between all four variables.
It is important to note that several important demographic variables are not considered within the analysis. Newcastle is a diverse city with 13.4 percent of its population born outside the United Kingdom (Newcastle City Council Citation2021). Furthermore, there are significant areas of deprivation within the city, with 23 percent of people in Newcastle living in the 10 percent most deprived areas nationally. Environmental justice research confirms how structural forms of inequality and discrimination mean that these populations are likely to be more exposed to pollution and other urban ills, making them a priority for sensor placement. Our analysis is intended as an illustration of the importance of incorporating demographic factors into the sensor placement decision-making process, and not as a statement on the universe of potential input variables that should be considered. In addition, age data are easily obtained for very small geographic areas of the United Kingdom and so offer the most tractable demographic data for our purposes. A strength of our approach is that it can be easily repurposed with different demographic input variables to suit local priorities and contexts.
Illustrating Trade-Offs and Inequities in Sensor Placement Using Spatial Optimization
Based on our optimization of sensor placement according to the demographic structure of Newcastle, the section that follows presents:
Single-objective sensor networks derived to prioritize coverage of a single demographic variable.
Multiobjective sensor networks derived to prioritize multiple demographic variables.
For both single and multiobjective sensor networks we also evaluate how they perform in comparison to the existing network of air quality sensors that form part of Newcastle’s UO. In both the single- and multiobjective cases, a heuristic approach is used, so the proposed networks are not guaranteed to be the global optimal solutions, but rather are good approximations illustrating the challenges a decision maker faces in making trade-offs between different social demographics.
Single-Objective Sensor Networks
Overall sensor coverage scores for each demographic variable of interest, based on a single objective network, provide a measure of the extent to which the population of interest is covered, or represented, with a given number of sensors, with a score of one indicating complete coverage. shows the relationship between the number of sensors (between one and fifty-five), and sensor coverage. The number fifty-five is chosen as a benchmark for analysis to allow for comparison with the existing UO network of air quality sensors, which provides sensor coverage in fifty-five OAs in Newcastle.
Figure 3 Sensor coverage score based on number of sensors for demographic variables (using a 500-m solution).
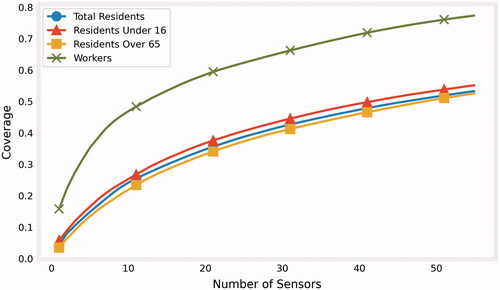
For the workplace population, a small number of sensors can cover a high proportion of the population. For example, the placement of a single sensor provides coverage for 16 percent of the workplace population, rising to 22 percent with two sensors. These high sensor coverage scores reflect the spatial concentration of the workplace population in the dense city center and the city airport, in comparison to other demographic variables that are more evenly distributed across Newcastle (). The remaining three variables (total residents, residents under sixteen, and residents over sixty-five) each have a similar relationship between coverage and the number of sensors. Subsequently, a high degree of sensor coverage among these populations is less straightforward to achieve compared to the workplace population. For example, when comparing the total resident population (i.e., whether a person is covered at home) to the workplace population (i.e., whether a person is covered in their place of work), using twenty-five sensors only 39 percent of the residential population has coverage in comparison to 62 percent of the workplace population using the same number of sensors.
Workplace populations offer an opportunity for urban decision makers to provide coverage to a large proportion of the population during the day, using only a small number of sensors. Workplaces are also likely to be located in denser, and relatively polluted, areas of cities given the high volume of people traveling to city centers or other major centers of industrial activity. Focusing on workplace population, however, means that resulting data are less likely to be collected about the locations of a range of demographic groups who are not in paid employment. This includes, for example, people who are retired or carers, including parents looking after children at home (Carr et al. Citation2018), as well as people who are structurally disadvantaged in the job market, including women (Hebson and Rubery Citation2018), ethnic minorities (Longhi Citation2020), and persons with poor physical or mental health that who are unable to work or have restricted employment opportunities (Maroto and Pettinicchio Citation2014). Arguably, it is precisely many of these demographics that are disproportionately vulnerable to poor air quality, for both physiological and structural reasons, meaning that they require greater (not less) representation in efforts to understand their exposure to hazards such as air pollution and to characterize broader inequalities in the urban environment (Heeks and Shekhar Citation2019; Kempin Reuter Citation2019).
A comparison of sensor coverage across the three residential demographic variables (younger, older, and total population) using a 500-m solution, based on the number of sensors () also highlights the relative gains in terms of coverage that can be made via the placement of a small number of sensors across each variable. In Newcastle, a medium-sized city in the UK context, the placement of ten sensors using a 500-m solution provides between 22 and 25 percent coverage in those networks optimized for the single objectives. Yet the addition of a further forty-five sensors results in a network that provides just over twice the level of coverage (53–55 percent) in each case. These results are highly context specific, however, and will likely vary depending on a number of factors, not least the size, density and diversity of the urban environment and populations that a sensor network seeks to represent.
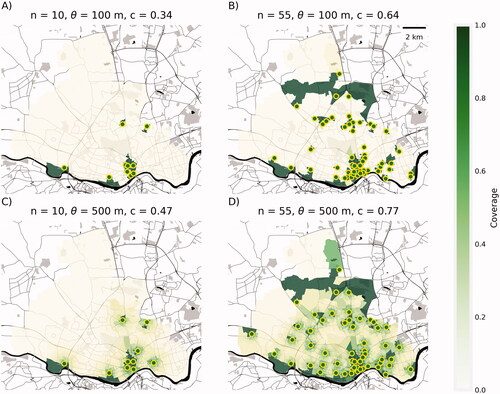
Focusing in detail on the spatialities of the single objective networks, in which sensor coverage is based on a specific demographic group, the configuration of sensors based on residents over sixty-five is more challenging from a coverage perspective. As illustrated in , older persons are the most geographically dispersed of the populations selected for analysis. As sensor coverage is based on distance (in our case a 100-m or 500-m solution) the tendency for older persons to live in less dense, suburban areas of Newcastle means that a large number of sensors are likely to be required to achieve similar levels of coverage. This reflects long-standing issues associated with understanding, tackling, and targeting some of the challenges in more rural areas in the United Kingdom (e.g., poverty and social exclusion), due to both their relative peripheralisation and diversity compared to their urban counterparts (Commins Citation2004; Walker et al. Citation2012). For example, the 100-m solution using ten sensors only provides coverage to 4 percent of older persons, compared to the 34 percent coverage achieved for a ten-sensor network estimated for the workplace population (). Despite this, a fifty-five-sensor network for a 500 m solution based on residents over sixty-five (53 percent) achieves similar levels of coverage to the deployment of the same number of sensors based on total residents and children under sixteen (53 percent and 55 percent, respectively).
Figure 4 Coverage of residents over sixty-five based on ten- and fifty-five-sensor networks using 100-m (top) and 500-m (bottom) solutions.
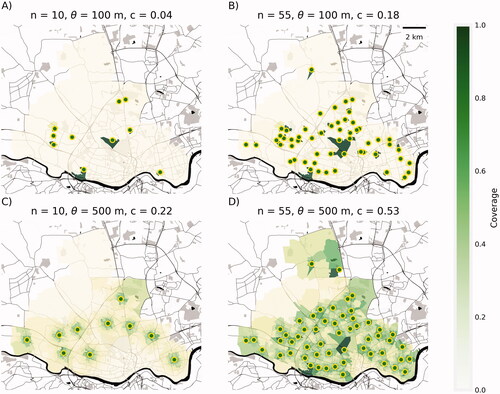
Figure 5 Coverage of workplace population based on ten- and fifty-five-sensor networks using 100-m (top) and 500-m (bottom) solutions.
These spatially optimized networks are limited, as they only account for a single variable of interest. Although in some cases evidence from sensor networks might be used to inform policies pertaining to a single group (e.g., when considering the physiological vulnerability of a particular age group to poor air quality), it is often useful for urban decision makers to consider populations more holistically—concurrently representing the distribution of a wider range of demographic groups. The following section seeks to address this, focusing on deriving multiple-objective sensor networks.
Multiple-Objective Sensor Networks
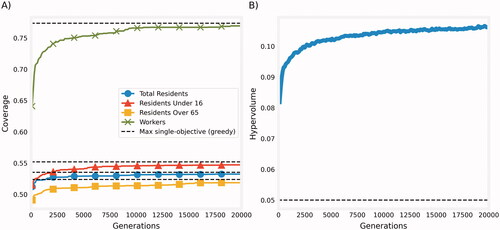
We now present networks that seek to balance the importance of multiple demographic variables. The set of 200 networksFootnote2 shown are nondominated (efficient compromise) solutions generated with the genetic algorithm NSGA-II. These represent the diverse range of sensor placements a decision maker could be asked to select from depending on their priorities. Each of the networks contains fifty-five sensors and is based on a 500-m solution. shows the performance of the algorithm across our run of 20,000 generations (iterations). Note that if a decision maker wishes to maximize coverage of a single demographic group only, rather than a compromise between the coverage of multiple demographics, the greedy algorithm slightly outperforms the genetic algorithm in our example.
Figure 6 Convergence of the 200 networks (fifty-five sensors, 500-m solution) generated with the multiple-objective genetic algorithm. (A) Maximum coverage achieved for each of the four objectives (among the 200 networks). Dashed lines show the maximum single-objective coverage achieved with the greedy algorithm. (B) The hypervolume metric, a multiple-objective measure of the quality of the solutions (Zitzler and Thiele Citation1998). The dashed line is a baseline showing the hypervolume of 10,000 randomly generated networks.
shows the degree of coverage achieved for each objective for each of the 200 different multiple-objective sensor networks. The lines and color scale in highlight the trade-offs that must be considered between the different objectives. Networks that achieve high coverage of workers (yellow) appear among those with the lowest coverage of the residential objectives.
Figure 7 Sensor coverage for multiple-objective sensor networks (200 sensor networks, fifty-five sensors in each network, based on a 500-m solution). Each network is represented by a line through four points—the coverage achieved by that sensor configuration for each of the demographics. The networks are colored according to their coverage of workers, from highest (yellow) to lowest (dark blue).
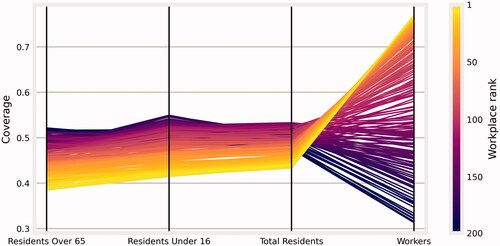
Consider an example scenario where a decision maker sets a target of a minimum of 45 percent coverage for each objective. Of the 200 networks, only 77 meet these criteria; more stringent benchmarks result in fewer networks that meet all demographic criteria. The sensor coverage achieved by the networks demonstrates just how tricky evaluating sensor placement based on multiple objectives can be. None of the networks achieve over 50 percent coverage of the population across all four objectives (three sensor networks have between 49 and 50 percent coverage). As the overall coverage of the city depends on the assumed sensor coverage area, a 100-m solution would need many more sensors to meet the 45 percent threshold for all objectives.
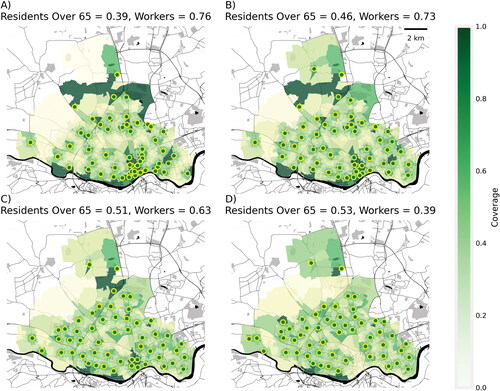
shows networks with varying priority given to the variables with the least similar spatial distribution: workplace population and residents over the age of sixty-five. As we move from a sensor network that prioritizes coverage of older persons (top left) to a network that prioritizes workplace coverage (bottom right) we see a shift in the spatial distribution of sensors toward the city center. As before, due to the high concentration of workers in the city center compared to the more dispersed distribution of older residents, this is an expected result (). It is worth observing the substantial gains in workplace coverage that can be made with a relatively small change in the degree of coverage of older persons, owing to the spatial concentration of working populations during the day. For a network of fifty-five sensors, a 14-percentage-point reduction in coverage of the residents over sixty-five (from 53 percent to 39 percent) results in a 37-percentage-point increase in coverage of workplace population.
Figure 8 A two-objective fifty-five-sensor network showing the trade-off between residents over sixty-five years and workplace population (using a 500-m solution). Network varies from (A) predominantly prioritizing older person coverage to (D) prioritizing workplace coverage.
Comparison with the Existing Urban Observatory Network
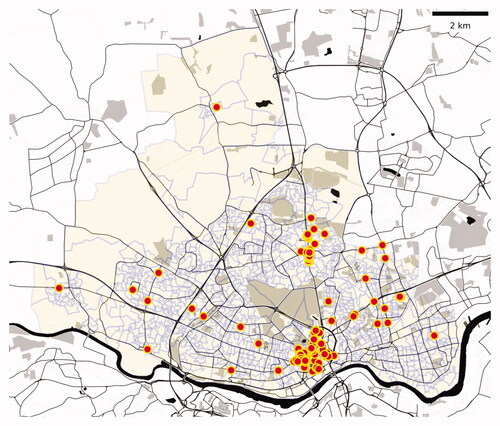
The existing UO sensor network in Newcastle was not necessarily designed with demographic coverage in mind; rather it is intended to respond to specific urban challenges and policy priorities. As a result, the 146 air quality sensors in Newcastle that form part of the UO network are disproportionately concentrated in the city center ().
Figure 9 Existing air quality sensors in the Urban Observatory (UO) network within Newcastle LA. Source: Sensor locations derived from UO at Newcastle University under CC BY 4.0, https://urbanobservatory.ac.uk/.
In we compare the existing UO network and each of the single objective sensor networks derived solely based on the spatial distribution of each population group. To calculate the degree of sensor coverage based on the existing UO network, we snap each UO sensor to the centroid of the OA it falls within, resulting in fifty-five OAs with sensors. Coverage is then calculated using the same method as our single-objective optimization. Orange areas illustrate where the existing UO network provides less coverage (or a deficit of coverage) and purple areas indicate where it provides more coverage (or an excess of coverage), when compared with the single objective networks. This comparison suggests that the exercise of optimizing for any subgroup will force a more even distribution of sensors than might otherwise be placed, showing one possible equity advantage of our approach.
Figure 10 Difference between existing Urban Observatory (UO) network of air quality sensors and single-objective networks derived for each demographic variable.
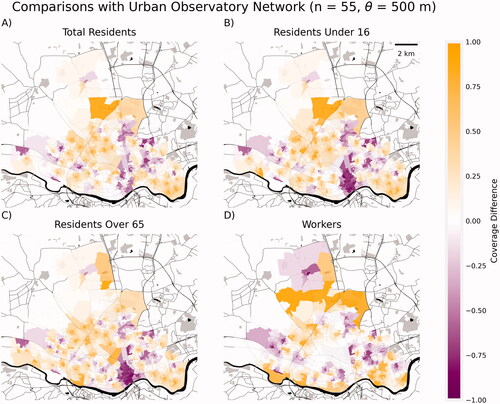
The spatial distribution of the existing UO network is most similar to the network optimized for workplace population (illustrated by a higher number of white areas in which coverage difference is zero, ten). There are areas, however, for which existing sensor coverage is sparse, including relatively deprived, postindustrialized areas along the north bank of the River Tyne—what might be termed sensor deserts in the existing network (Robinson and Franklin Citation2021). Yet the UO network provides a higher level of coverage in the center of the city, where people across all demographics are likely to congregate and spend much of their time, when compared with each single objective network. By prioritizing residential demographics and populations, our sensor networks impose a more dispersed allocation of sensors across the urban fabric, which might be a useful outcome—a nudge to decision makers to consider a wider range of areas in placing sensors.
We also evaluate sensor coverage for 200 multiple-objective networks each comprised of fifty-five sensors. In , the black line represents the level of coverage achieved using the existing UO sensor network (one sensor to represent each of the OAs that contain a sensor). The shading of each line tells us how a sensor network performs according to the four demographic objectives. Networks shaded blue have better coverage than the UO network across all four objectives; those shaded pink have worse workplace coverage than the UO network, although coverage is better than the UO network across the remaining three objectives.
Figure 11 Difference between existing Urban Observatory (UO) network of air quality sensors and multiple-objective sensor networks (200 sensor networks, fifty-five sensors in each network, based on a 500-m solution). Networks shaded blue have better coverage than the UO network across all four objectives. Networks shaded pink have worse workplace coverage than the UO network but better coverage than the UO network across the remaining three objectives.
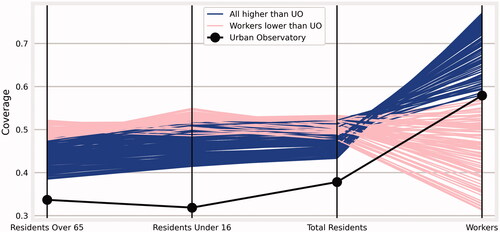
For three of the objectives—total residents, residents over 65, and residents under 16—all 200 of the spatially optimized sensor networks provide a higher degree of sensor coverage than the existing UO network. However, to achieve the coverage of workplace populations that matches the existing network in Newcastle it would be necessary to sacrifice some degree of coverage across the remaining three objectives, as illustrated by the band of networks shaded in pink at the top of the total residents, residents over 65, and residents under 16 variables. These networks have poorer workplace coverage than the UO network, but perform better across all other objectives.
Comparison with the UO air quality sensor network highlights some of the limitations of the networks derived via our optimization algorithms. The inputs to our algorithms only account for the distribution of the population, overlooking other aspects that decision makers might choose to prioritize to understand urban air quality—for example, sources of pollutants and relative exposure to pollutants. We are also unable to consider the practicalities of where sensors can be safely and effectively installed, a decision-making process that can be highly contested and political, thus shaping the distribution of the existing network. Furthermore, the analysis is limited by the OA boundaries in which demographic data are made available. For example, within the UO network there are areas in the city center in which air quality sensors are so densely located that they are not easily comparable with the lower granularity networks derived using a 500-m spatially-optimized solution. Finally, the pseudo-optimal demographic sensor networks consider the population as relatively immobile rather than ambient (Whipp et al. Citation2021), with the exception of some representation of the “daytime” configuration of a city’s residents, with the workplace population variable. Optimization of sensor placement should also prioritize understanding the coverage of the population as they travel within the city, whether to work, school or other activities, rather than solely focusing on their home location (as is prioritized by data available from the Census).
Reimagining the Role of Sensors in Cities
Even with a limited number of solely demographic priorities in our evaluation of the placement of air quality sensors in cities, the analysis suggests that there is no such thing as technically or demographically complete coverage, or representation, within the constraints of existing urban structures by sensor infrastructures—and that achieving such a goal lies so far outside the realm of possibility that we can consider it impossible, given existing technologies. Our results indicate that, even with access to appropriate information and analytics, urban decision makers might struggle to develop equitable solutions, where sensor networks are concerned. We view this as a peculiarly spatial instantiation of injustice in the smart city. These results also show that inequities in sensor networks need not be the outcome of conscious malintent on the part of the decision maker—even with decision-making that aims to maximize inclusion, sensor networks are likely to miss important groups or locations. In the absence of an unlimited budget for sensor placement and maintenance, and therefore an unlimited network of sensors across the city, our analysis suggests that sufficient sensor coverage that would allow for the collation of reliable and technically accurate real-time data across all groups and places in the city is likely an almost impossible task. This conclusion highlights one of the fundamental contradictions of smart city initiatives. Although the impacts of austerity policymaking have eroded local government capacity for monitoring in recent decades (Eckersley and Tobin Citation2019), contradictorily many smart city projects are themselves justified in relation to austerity urbanism (Cardullo and Kitchin Citation2019). If optimal spatial sensor coverage is impossible under the conditions and governance arrangements on which the smart city is based, attempts to use these data for justice or equity must assume that all they can do is satisfice.
Despite this, we would argue that “just good enough” (Gabrys, Pritchard, and Barratt Citation2016) or “satisficing” (Simon Citation1955) data still have the potential to play an important role in evidencing core urban injustices such as air pollution and climate-related heat, if data are collected with equity in mind. We therefore make the case for a clearer distinction to be made within critical debates about smart urbanisms between sensors for monitoring and sensors for surveillance, arguing that a wider presumption of bad intent for all sensors potentially limits the visibility of positive types of sensing—and might also limit uptake of existing analytical approaches, such as spatial optimization algorithms, that can support decision makers in understanding the spatial and demographic impacts of trade-offs, as they are made, and might even prompt them to make better placement decisions.
Rather than starting from what we think we already know about the city and working from there in the placement of sensors, the approach presented within this article allows us to evaluate and compare a variety of sensor configurations that have equity at their core. The networks developed are by no means perfect, limited in the lack of recognition of known sources of hazards, the range of demographic characteristics considered, or how people move in and out of sensor coverage within the city. Yet the widely used and replicable spatial optimization algorithms applied in our analysis allow for the construction of networks that offer a different perspective about who or what urban sensor infrastructures are for. In turn, those sensors are likely to generate data that we did not anticipate. Such an approach has the potential to provide a more holistic understanding of the city, rather than beginning with preconceived ideas about what is important to measure, or retrospectively evaluating whether an existing network is equitable or not. They also succeed in making visible the spatial and demographic implications of a core element of smart city technologies: the sensor.
That is not to argue, as we build these networks, that sensors are the panacea that proponents of smart cities and big data might claim. Instead, our analysis highlights the ways in which basic optimization tools can helpfully elucidate spatial inequalities, recognizing how optimization visualizations and tools can be a useful mechanism for communicating to decision makers and citizens just how difficult the challenge of equitable sensor placement is. In successfully conveying these difficulties, the analyses could act as a catalyst for important broader conversations about whether there are better alternatives to sensors for gathering data that help people. Given the challenges associated with sensors (whether for surveillance or monitoring purposes) it is useful to consider what we might do instead. Perhaps there are alternatives for collecting necessary information that do not invade privacy, or risk privileging some places or people over others, that would allow us to entirely reimagine the role of sensor infrastructures in our cities.
Acknowledgments
All code and source data for our analysis are available in the GitHub repository: https://github.com/alan-turing-institute/spatial-inequality. The authors are grateful for the thoughtful and constructive comments of the three reviewers and the editor. Early versions of this research were presented at a variety of seminars and the authors also appreciate the many helpful suggestions they received in those venues.
Notes
Additional information
Funding
Notes on contributors
Caitlin Robinson
CAITLIN ROBINSON is an Academic Fellow in Urban Analytics and a UKRI Future Leaders Fellow based in the Department of Geography and Planning and Geographic Data Science Lab, University of Liverpool L69 3BX, UK. E-mail: [email protected]. Her research interests include energy poverty, spatial inequality, and spatial data science.
Rachel S. Franklin
RACHEL S. FRANKLIN is Professor of Geographical Analysis in the Center for Urban and Regional Development Studies, Newcastle University, Newcastle upon Tyne NE1 7RU, UK. E-mail: [email protected]. Her research interests include spatial inequality, depopulation and shrinking cities, and demographic change.
Jack Roberts
JACK ROBERTS is a Research Data Scientist in the Research Engineering Group, The Alan Turing Institute, London NW1 2DB, UK. E-mail: [email protected]. His research interests lie in applying data science methodology across a variety of domains and creating reproducible software.
Notes
1 In the analysis, demographic data granularity is restricted to Census OAs. This has implications for the 100-m solution in particular, as we are not necessarily calculating coverage within 100 m owing to the relatively larger size of the OA. Rather the results indicate whether a sensor covers the immediate OA it is within, without benefiting any of the surrounding OAs. It is also worth noting that whatever the value of Ѳ, an OA is considered to have coverage of 100 percent if it has a sensor.
2 Two hundred was selected as an appropriate number of sensor networks that was computable within a reasonable analysis time but also allowed for a full spectrum of possible compromises to be generated.
References
- Barlow, M., and G. Drew. 2020. Slow infrastructures in times of crisis: Unworking speed and convenience. Postcolonial Studies 24:1–22. doi: 10.1080/13688790.2020.1804105.
- Barocas, S., and H. Nissenbaum. 2014. Big data’s end run around anonymity and consent. In Privacy, big data, and the public good: Frameworks for engagement, ed. J. Lane, V. Stodden, S. Bender, and H. Nissenbaun, 44–75. Cambridge, UK: Cambridge University Press.
- Bates, J. 2012. “This is what modern deregulation looks like”: Co-optation and contestation in the shaping of the UK’s Open Government Data Initiative. The Journal of Community Informatics 8 (2):1–20. doi: 10.15353/joci.v8i2.3038.
- Bello, J. P., C. Mydlarz, and Salamon, J. 2018. Sound analysis in smart cities. In Computational analysis of sound scenes and events, ed. T. Virtanen and M. D. Plumbley, 373–97. New York: Springer.
- Benjamin, R. 2019. Race after technology: Abolitionist tools for the new Jim code. Cambridge: Polity Press.
- Biscani, F., and D. Izzo. 2020. A parallel global multiobjective framework for optimization: Pagmo. Journal of Open Source Software 5 (53):2338. doi: 10.21105/joss.02338.
- Bradley, A. 2014. Office for National Statistics. 2011 Census: Workplace population analysis. Accessed July 23, 2021. https://www.ons.gov.uk/peoplepopulationandcommunity/populationandmigration/populationestimates/articles/workplacepopulationanalysis/2014-05-23.
- Brannon, M. M. 2017. Datafied and divided: Techno-dimensions of inequality in American cities. City & Community 16 (1):20–24. doi: 10.1111/cico.12220.
- Cao, R., B. Li, Z. Wang, Z. R. Peng, S. Tao, and S. Lou. 2020. Using a distributed air sensor network to investigate the spatiotemporal patterns of PM2.5 concentrations. Environmental Pollution 264:114549. doi: 10.1016/j.envpol.2020.114549.
- Cardullo, P., and R. Kitchin. 2019. Smart urbanism and smart citizenship: The neoliberal logic of “citizen-focused” smart cities in Europe. Environment and Planning C: Politics and Space 37 (5):813–30. doi: 10.1177/0263774X18806508.
- Carr, E., E. T. Murray, P. Zaninotto, D. Cadar, J. Head, S. Stansfeld, and M. Stafford. 2018. The association between informal caregiving and exit from employment among older workers: Prospective findings from the UK Household Longitudinal Study. The Journals of Gerontology: Series B 73 (7):1253–62. doi: 10.1093/geronb/gbw156.
- Changaival, B., K. Lavangnananda, G. Danoy, D. Kliazovich, F. Guinand, M. Brust, J. Musial, and P. Bouvry. 2021. Optimization of carsharing fleet placement in round-trip carsharing service. Applied Sciences 11 (23):11393. doi: 10.3390/app112311393.
- Church, R., and C. ReVelle. 1974. The maximal covering location model. Papers of the Regional Science Association 32 (1):101–18. doi: 10.1007/BF01942293.
- Commins, P. 2004. Poverty and social exclusion in rural areas: Characteristics, processes and research issues. Sociologia ruralis 44 (1):60–75.
- Corburn, J. 2005. Street science: Community knowledge and environmental health justice. Cambridge, MA: MIT Press.
- Crawford, K., and J. Schultz. 2014. Big data and due process: Toward a framework to redress predictive privacy harms. Boston College Law Review 55:93–129.
- Dalton, C., C. Wilmott, E. Fraser, and J. Thatcher. 2020. “Smart” discourses, the limits of representation, and new regimes of spatial data. Annals of the American Association of Geographers 110 (2):485–96. doi: 10.1080/24694452.2019.1665493.
- Deb, K., A. Pratap, S. Agarwal, and T. Meyarivan. 2002. A fast and elitist multiobjective genetic algorithm: NSGA-II. IEEE Transactions on Evolutionary Computation 6 (2):182–97. doi: 10.1109/4235.996017.
- Delmelle, E. 2010. Spatial optimisation methods. In Encyclopaedia of human geography, ed. B. Wharf, 2657–59. Thousand Oaks, CA: Sage.
- Dencik, L., A. Hintz, and J. Cable. 2016. Towards data justice? The ambiguity of anti-surveillance resistance in political activism. Big Data & Society 3 (2):205395171667967. doi: 10.1177/2053951716679678.
- Department for Environment, Food and Rural Affairs (Defra). 2021. “Low-cost” pollution sensors: Understanding uncertainties. Accessed June 24, 2021. https://uk-air.defra.gov.uk/research/aqeg/pollution-sensors/understanding-uncertainties.php.
- D’Ignazio, C., and L. F. Klein. 2020. Data feminism. Cambridge, MA: MIT Press.
- Dodge, M., and R. Kitchin. 2005. Code and the transduction of space. Annals of the Association of American Geographers 95 (1):162–80. doi: 10.1111/j.1467-8306.2005.00454.x.
- Ebrahimi Zade, A., A. Sadegheih, and M. M. Lotfi. 2014. A modified NSGA-II solution for a new multi-objective hub maximal covering problem under uncertain shipments. Journal of Industrial Engineering International 10 (4):185–97. doi: 10.1007/s40092-014-0076-4.
- Eckersley, P., and P. Tobin. 2019. The impact of austerity on policy capacity in local government. Policy & Politics 47 (3):455–72. doi: 10.1332/030557319X15613701303511.
- Feinberg, S. N., R. Williams, G. Hagler, J. Low, L. Smith, R. Brown, D. Garver, M. Davis, M. Morton, J. Schaefer, et al. 2019. Examining spatiotemporal variability of urban particulate matter and application of high-time resolution data from a network of low-cost air pollution sensors. Atmospheric Environment 213:579–84. doi: 10.1016/j.atmosenv.2019.06.026.
- Ferguson, A. G. 2019. The rise of big data policing: Surveillance, race, and the future of law enforcement. New York: NYU Press.
- Foucault, M. 2008. Security, territory, population: Lectures at the College de France 1977–1978. New York: Palgrave.
- Gabrys, J. 2017. Citizen sensing, air pollution and fracking: From “caring about your air” to speculative practices of evidencing harm. The Sociological Review 65 (2 Suppl.):172–92. doi: 10.1177/0081176917710421.
- Gabrys, J., H. Pritchard, and B. Barratt. 2016. Just good enough data: Figuring data citizenships through air pollution sensing and data stories. Big Data & Society 3 (2):205395171667967. doi: 10.1177/2053951716679677.
- Garai, G., and B. B. Chaudhuri. 2007. A distributed hierarchical genetic algorithm for efficient optimization and pattern matching. Pattern Recognition 40 (1):212–28. doi: 10.1016/j.patcog.2006.04.023.
- Graham, S., and S. Marvin. 2001. Splintering urbanism: Networked infrastructures, technological mobilities and the urban condition. London: Psychology Press.
- Gray, J., D. Lammerhirt, and L. Bounegru. 2016. Changing what counts. How can citizen-generated and civil society data be used as an advocacy tool to change official data collection? Civicus. Working paper. SSRN 2742871.
- Grineski, S. E., and T. W. Collins. 2018. Geographic and social disparities in exposure to air neurotoxicants at US public schools. Environmental Research 161:580–87. doi: 10.1016/j.envres.2017.11.047.
- Hansson, S. O., and G. Hirsch Hadorn. 2018. Argument-based decision support for risk analysis. Journal of Risk Research 21 (12):1449–64. doi: 10.1080/13669877.2017.1313767.
- Hebson, G., and J. Rubery. 2018. Employment relations and gender equality. In The Routledge companion to employment relations, ed. A. Wilkinson, T. Dundon and A.C. Donaghey, 107–21. London and New York: Routledge.
- Heeks, R., and S. Shekhar. 2019. Datafication, development and marginalised urban communities: An applied data justice framework. Information, Communication and Society 22 (7):992–1011. doi: 10.1080/1369118X.2019.1599039.
- Hochbaum, D., and A. Pathria. 1998. Analysis of the greedy approach in problems of maximum k-coverage. Naval Research Logistics 45 (6):615–27. doi: 10.1002/(SICI)1520-6750(199809)45:6<615::AID-NAV5>3.0.CO;2-5.
- Holland, J. H. 1992. Genetic algorithms. Scientific American 267 (1):66–73. doi: 10.1038/scientificamerican0792-66.
- Hong, A., B. Kim, and M. Widener. 2020. Noise and the city: Leveraging crowdsourced big data to examine the spatio-temporal relationship between urban development and noise annoyance. Environment and Planning B: Urban Analytics and City Science 47 (7):1201–18. doi: 10.1177/2399808318821112.
- Irwin, A. 1995. Citizen science: A study of people, expertise and sustainable development. London and New York: Routledge.
- Jameson, S., C. Richter, and L. Taylor. 2019. People’s strategies for perceived surveillance in Amsterdam Smart City. Urban Geography 40 (10):1467–84. doi: 10.1080/02723638.2019.1614369.
- Kempin Reuter, T. 2019. Human rights and the city: Including marginalized communities in urban development and smart cities. Journal of Human Rights 18 (4):382–402. doi: 10.1080/14754835.2019.1629887.
- Kitchin, R. 2016. The ethics of smart cities and urban science. Philosophical Transactions of the Royal Society A: Mathematical, Physical and Engineering Sciences 374 (2083):20160115. doi: 10.1098/rsta.2016.0115.
- Kitchin, R. 2018. Reframing, reimagining and remaking smart cities. In Creating smart cities, ed. C. Coletta, L. Evans, L. Heaphy, and R. Kitchin, 219–30. London and New York: Routledge.
- Kitchin, R., P. Cardullo, and C. Di Feliciantonio. 2019. Citizenship, justice, and the right to the smart city. In The right to the smart city, ed. P. Cardullo, C. Di Feliciantonio and R. Kitchin, 1–24. Bingley, UK: Emerald.
- Kitchin, R., T. P. Lauriault, and G. McArdle. 2015. Smart cities and the politics of urban data. In Smart urbanism: Utopian vision or false dawn, ed. S. Marvin, L. Luque-Ayala, and C. McFarlane, 16–33. London and New York: Routledge.
- Lagoze, C. 2014. Big data, data integrity, and the fracturing of the control zone. Big Data & Society 1 (2):205395171455828–11. doi: 10.1177/2053951714558281.
- Lewis, A., and P. Edwards. 2016. Validate personal air-pollution sensors. Nature 535 (7610):29–31. doi: 10.1038/535029a.
- Longhi, S. 2020. A longitudinal analysis of ethnic unemployment differentials in the UK. Journal of Ethnic and Migration Studies 46 (5):879–92. doi: 10.1080/1369183X.2018.1539254.
- Mah, A. 2017. Environmental justice in the age of big data: Challenging toxic blind spots of voice, speed, and expertise. Environmental Sociology 3 (2):122–33. doi: 10.1080/23251042.2016.1220849.
- Maroto, M., and D. Pettinicchio. 2014. Disability, structural inequality, and work: The influence of occupational segregation on earnings for people with different disabilities. Research in Social Stratification and Mobility 38:76–92. doi: 10.1016/j.rssm.2014.08.002.
- Michael, M., and D. Lupton. 2016. Toward a manifesto for the “public understanding of big data.” Public Understanding of Science 25 (1):104–16. doi: 10.1177/0963662515609005.
- Mitchell, G., and D. Dorling. 2003. An environmental justice analysis of British air quality. Environment and Planning A: Economy and Space 35 (5):909–29. doi: 10.1068/a35240.
- Nadybal, S. M., T. W. Collins, and S. E. Grineski. 2020. Light pollution inequities in the continental United States: A distributive environmental justice analysis. Environmental Research 189:109959. doi: 10.1016/j.envres.2020.109959.
- Newcastle City Council. 2021. Equality and diversity. Accessed June 24, 2021. https://www.newcastle.gov.uk/local-government/equality-and-diversity.
- Office for National Statistics. 2011. Population weighted centroids guidance. Accessed July 22, 2021. https://geoportal.statistics.gov.uk/documents/ons::population-weighted-centroids-guidance/.
- O’Neil, C. 2016. Weapons of math destruction: How big data increases inequality and threatens democracy. New York: Crown.
- Pak, B., A. Chua, and A. Vande Moere. 2017. FixMyStreet Brussels: Socio-demographic inequality in crowdsourced civic participation. Journal of Urban Technology 24 (2):65–87. doi: 10.1080/10630732.2016.1270047.
- Pollio, A. 2016. Technologies of austerity urbanism: The “smart city” agenda in Italy (2011–2013). Urban Geography 37 (4):514–34. doi: 10.1080/02723638.2015.1118991.
- Pritchard, H., and J. Gabrys. 2016. From citizen sensing to collective monitoring: Working through the perceptive and affective problematics of environmental pollution. GeoHumanities 2 (2):354–71. doi: 10.1080/2373566X.2016.1234355.
- Puussaar, A., I. G. Johnson, K. Montague, P. James, and P. Wright. 2018. Making open data work for civic advocacy. Proceedings of the ACM on Human-Computer Interaction 2(CSCW):1–20. doi: 10.1145/3274412.
- Robinson, C., and R. S. Franklin. 2021. The sensor desert quandary: What does it mean (not) to count in the smart city? Transactions of the Institute of British Geographers 46 (2):238–54. doi: 10.1111/tran.12415.
- Sadowski, J., and F. A. Pasquale. 2015. The spectrum of control: A social theory of the smart city. First Monday 20 (7):238–54. doi: 10.5210/fm.v20i7.5903.
- Sanchez, L., and T. G. Reames. 2019. Cooling Detroit: A socio-spatial analysis of equity in green roofs as an urban heat island mitigation strategy. Urban Forestry & Urban Greening 44:126331. doi: 10.1016/j.ufug.2019.04.014.
- Shelton, T., M. Zook, and A. Wiig. 2015. The actually existing smart city. Cambridge Journal of Regions, Economy and Society 8 (1):13–25. doi: 10.1093/cjres/rsu026.
- Simon, H. A. 1955. A behavioral model of rational choice. The Quarterly Journal of Economics 69 (1):99. doi: 10.2307/1884852.
- Simon, H. A. 1960. The new science of management decision. New York: Harper and Row. doi: 10.1037/13978-000.
- Solove, D. J. 2013. Privacy self-management and the consent paradox. Harvard Law Review 126 (7):1880–1903.
- Strebel, I. 2011. The living building: Towards a geography of maintenance work. Social & Cultural Geography 12 (3):243–62. doi: 10.1080/14649365.2011.564732.
- Sun, C., V. O. Li, J. C. Lam, and I. Leslie. 2019. Optimal citizen-centric sensor placement for air quality monitoring: A case study of city of Cambridge, the United Kingdom. IEEE Access 7:47390–400. doi: 10.1109/ACCESS.2019.2909111.
- Tong, D., and A. T. Murray. 2012. Spatial optimization in geography. Annals of the Association of American Geographers 102 (6):1290–1309. doi: 10.1080/00045608.2012.685044.
- Uprichard, E. 2019. Focus: Big data, little questions? Accessed June 24, 2021. https://discoversociety.org/2013/10/01/focus-big-data-little-questions/.
- Urban Observatory (UO). 2021. Urban Observatory. https://urbanobservatory.ac.uk/
- Viitanen, J., and R. Kingston. 2014. Smart cities and green growth: Outsourcing democratic and environmental resilience to the global technology sector. Environment and Planning A: Economy and Space 46 (4):803–19. doi: 10.1068/a46242.
- Walker, R., P. McKenzie, C. Liddell, and C. Morris. 2012. Area-based targeting of fuel poverty in Northern Ireland: An evidence-based approach. Applied Geography 34:639–49. doi: 10.1016/j.apgeog.2012.04.002.
- Whipp, A., N. Malleson, J. Ward, and A. Heppenstall. 2021. Estimates of the ambient population: Assessing the utility of conventional and novel data sources. ISPRS International Journal of Geo-Information 10 (3):131. doi: 10.3390/ijgi10030131.
- Yang, X. S. 2021. Nature-inspired optimisation algorithms. 2nd ed. London: Elsevier.
- Zitzler, E., and L. Thiele. 1998. Multiobjective optimization using evolutionary algorithms—A comparative case study. International Conference on Parallel Problem Solving from Nature 1498:292–301.
- Zuboff, S. 2015. Big other: Surveillance capitalism and the prospects of an information civilization. Journal of Information Technology 30 (1):75–89. doi: 10.1057/jit.2015.5.